Archive for the ‘Announcements’ Category

Citrixware

Sunday, July 8th, 2007

Citrix is a global leader in application delivery and access infrastructure solutions including application streaming and virtualization. There are so many great products developed by this company including WinFrame, MetaFrame, Presentation Server and its clients, Desktop Server, XenServer, XenApp, XenDesktop, Receiver and Dazzle, Access Gateway, Application Firewall, Application Gateway, NetScaler, WANScaler, GoToMeeting, GoToMyPC, GoToWebinar, GoToAssist, EdgeSight and Password Manager.

Citrix is no longer tied to Windows platforms because its products run on Linux, Solaris, FreeBSD, HP-UX, AIX, Symbian and Mac OS X as well. To bind them all together I propose to use the word “Citrixware”.

With more than 180,000 organizations in the world using Citrixware the chances are that you use it too. This is more encompassing word than just simple “accessware”. 

- Dmitry Vostokov @ DumpAnalysis.org -

Citrixofication

Thursday, July 5th, 2007

Following the invention of one of the greatest technological thinkers of our civilization, Thomas Edison, at the beginning of the 20th century, that prompted the electrification of our world, I would like to introduce and coin the word ”Citrixofication”, the electrifying power of Citrix that transforms our lives in the 21st century - instant access to any software application whenever and wherever we want. I am very proud that I work for Citrix, the company that changes the way we work at the beginning of the 21st century, like electricity transformed our lives a century ago. The moment you do remote access to your Windows application you use solutions and technology invented by Citrix. Every Windows computer in the world has the code developed by Citrix, ICA protocol code! To be honest I was thinking about “Citrification” but I found that it is already used in chemistry so I tried  ”Citrixification” but this was already used in one French document. The only word left was “Citrixofication” or just “Citrixfication”, whatever you prefer.

- Dmitry Vostokov @ DumpAnalysis.org -

PDBFinder (public version 3.5)

Sunday, July 1st, 2007

Version 3.5 uses the new binary database format and achieves the following results compare to the previous version 3.0.1:

  • 2 times smaller database size
  • 5 times faster database load time on startup!

It is fully backwards compatible with 3.0.1 and 2.x database formats and silently converts your old database to the new format on the first load.

Additionally the new version fixes the bug in version 3.0.1 sometimes manifested when removing and then adding folders before building the new database which resulted in incorrectly built database. 

The next version 4.0 is currently under development and it will have the following features:

  • The ability to open multiple databases
  • The ability to exclude certain folders during build to avoid excessive search results output
  • Fully configurable OS and language search options (which are currently disabled for public version)

PDBFinder upgrade is available for download from Citrix support.

If you still use version 2.x there is some additional information about features in version 3.5:

http://www.dumpanalysis.org/blog/index.php/2007/05/04/pdbfinder-public-version-301/

- Dmitry Vostokov @ DumpAnalysis.org -

Repair Clipboard Chain 2.0.1

Thursday, June 21st, 2007

The new version has been published and available for download from Citrix support:

http://support.citrix.com/article/CTX106226

It allows to repair clipboard chain for individual ICA sessions:

C:\>RepairCBDChain.exe "Sent Items - Microsoft Outlook - \\Remote"
C:\>RepairCBDChain.exe "Weekly report - Message - \\Remote"

You might also repair individual RDP sessions if you specify the window class as the second parameter although I didn’t test this.

MessageHistory tool shows the following RDP client window on my x64 Windows 2003 Server responsible for receiving clipboard change notifications:

HWND: 0x00000000000318A8
Class: "RdpClipRdrWindowClass"
Title: ""
20:31:59:562 S WM_DRAWCLIPBOARD (0x308) wParam: 0x31986 lParam: 0x0

The command line should be:

C:\>RepairCBDChain.exe "" "RdpClipRdrWindowClass"

Inside RDP session on Windows XP the following rdpclip.exe window receives clipboard change notifications:

HWND: 0x0004003A
Class: "CBMonitorClass"
Title: "CB Monitor Window"
19:36:57:484 S WM_DRAWCLIPBOARD (0x308) wParam: 0x50142 lParam: 0x0

and the command line should be:

C:\>RepairCBDChain.exe "CB Monitor Window" "CBMonitorClass"

Please see Clipboard Issues Explained for a background explanation.

- Dmitry Vostokov @ DumpAnalysis.org -

Using SSSL principle to design support tools

Sunday, May 6th, 2007

Start, Stop and Send Log (SSSL) principle was applied to design of many tools created in Citrix for troubleshooting customer issues. My favorite examples are WindowHistory, MessageHistory, and ScreenHistory

In a typical scenario, a customer has a GUI issue, downloads a tool, runs it, clicks on a “Start” button, tries to reproduce the issue, clicks on a “Stop” button and then sends a log either saved in a file or copied from the tool’s dialog. Simple action, no need for customers to become familiar with colored and complex GUI tools especially when an issue is hot and there is no time to play. Upon the arrival of the log file a skilled engineer can analyze it and provide further recommendations. Of course, SSSL tools must record all information that would be necessary to look at during analysis.

SSSL principle promotes agile iterative and incremental development of tools. Because it is difficult to know in advance about all information necessary to record, the first version usually implements logging of essential data only and what is missing in other available tools. The GUI is very simple and this shortens the development time. Later, after support incidents and analysis of their logs, it becomes apparent that more information needs to be recorded and then the second version is born, etc.

SSSL principle also promotes design and implementation reuse. Because GUI and certain operations are the same you can reuse common source code.

Finally after some time when more and more SSSL tools appear you can refactor them into a unified SSSL framework where individual tools become pluggable  components. This is what is coming this summer: GUI History Monitor that will combine all separate SSSL “History” tools together.

- Dmitry Vostokov -

PDBFinder (public version 3.0.1)

Friday, May 4th, 2007

Finally I’ve managed to create a slimmer version 3.0.1 with many resource consumption improvements:

  • Built database occupies 3.7 times less disk space
  • 2 times faster load
  • 5 times less memory consumption

Additional improvements:

  • “FIXFinder” feature: shows folders where you can find newer modules
  • Search can be restricted to folder names containing sub-string (for example, “release” or “full” symbols only)
  • Ready to copy and paste folder names (for WinDbg Symbol File Path dialog) – exe/dll/sys subfolders are stripped off
  • Additional minor interface improvements (larger screen, ellipsis in paths during build, better keyboard focus handling)

Screenshot:

The tool has been tested with more than 1,000,000 PDB files.

PDBFinder Deluxe Pro 3.0.1 and its documentation can be downloaded from Citrix support web site (requires free registration).

The motivation behind the tool is explained in my previous post: Cons of Symbol Server.

- Dmitry Vostokov -

The new version of WinDbg has been released

Tuesday, May 1st, 2007

Version 6.7.5 of Debugging Tools for Windows was released last week:

I haven’t found so far significant additions for crash dump analysis. What I noticed today is that when I open a user dump and enter
!analyze -v command the new field appears in the output:

NTGLOBALFLAG:  400

I ran gflags.exe and enabled page heap for notepad.exe. Then I launched notepad.exe, attached WinDbg, entered the command and NTGLOBALFLAG field reflected the change:

NTGLOBALFLAG:  2000000

So I don’t need to type !gflag command anymore. 

- Dmitry Vostokov -

Crash Dump Analysis Poster v1.1 (HTML version)

Sunday, April 22nd, 2007

Here is an HTML version of Crash Dump Analysis Poster with hyperlinks. Command links launch WinDbg Help for corresponding topic. If you click on !heap, for example, WinDbg Help window for that command will open. In order to have this functionality you need to save source code of the following HTML file below to your disk and launch it locally.

http://www.dumpanalysis.org/CDAPoster.html

Your WinDbg Help file must be in the default installation path, i.e.

C:\Program Files\Debugging Tools for Windows\debugger.chm

If you installed WinDbg to a different folder then you can simply create the default folder and copy debugger.chm there.

I keep this HTML file open locally on a second monitor and found it very easy to jump to an appropriate command help when I need its parameter description.

This HTML poster was created and edited in Notepad.

I’m working on the second version and will announce it as soon as it is ready.

- Dmitry Vostokov -

BSOD Shortcut Icon

Saturday, April 21st, 2007

Created the most simple blue screen icon and put it on my site. Now you can observe it when you run your browser:

- Dmitry Vostokov -

Crash Dump Analysis Poster v1.0

Sunday, April 15th, 2007

In December when I announced Crash Dump Analysis Card I talked about my plans to make a poster. Here is what I came to in the first version: A4 format poster with the following goals in mind:

  • Have it easy to stick nearby or have it handy
  • Foldable into two halves (user / kernel dumps)
  • Possibility to make it a background image on a PC desktop
  • Have it displayed on a second monitor
  • To facilitate mastering commands and their options
  • Encourage to look in WinDbg Help

You can download large JPEG file (1701×1208) for free (PDF file will be available later):

Download Crash Dump Analysis Poster

In a couple of months I’m going to release the new version after using and playing with the current one and collecting feedback. I have some extension commands missing in the first version of this poster like !list command, various scripting and meta-commands and I will add them in the next version. The current choice of commands is based on my previous Crash Dump Analysis Card and my personal day-to-day crash dump analysis work.

Originally I wanted to call it like something like WinDbg Cheat Sheet or WinDbg Poster but then I realized that I had to omit various live debugging commands and options and there are already several similar cheat sheets for live debugging. 

- Dmitry Vostokov -

ScreenHistory 1.0

Sunday, April 8th, 2007

After working with many customer issues where I needed good screenshots I decided to write a screen or window capture tool to make troubleshooting and reading other logs/traces easier. Here is ScreenHistory tool with familiar History-like GUI interface if you have seen WindowHistory, MessageHistory and ProcessHistory tools.

The tool captures the whole screen (currently the primary monitor) after specified interval (default is 1 second) or the contents of a current foreground window (multi-monitor independent) and saves its screenshot in JPEG, GIF (default) or PNG file. Additionally an HTML file is generated with links to screenshots. New forthcoming versions of WindowHistory and MessageHistory will reference these screenshots. Windows Mobile version will be released soon too.

Instead of forming a mental picture about screen when you look at messages or relating them to arbitrary screenshots sent by your customers you can easily check real-time screenshots when you look at message traces, for example, MessageHistory trace:

13:12:24:944 S WM_ACTIVATEAPP (0x1c) wParam: 0x0 lParam: 0x12ec Deactivated / TID of activated window: 0x12ec

[Screen]
13:12:47:268 S WM_ACTIVATEAPP (0×1c) wParam: 0×1 lParam: 0×0 Activated / TID of deactivated window: 0×0

[Screen]

or WindowHistory trace

Handle: 000300E4 Class: "MyClass" Title: "My Application"
Captured at: 13:11:47:983
Process ID: 6c4
Thread ID: 1054
Parent: 0
Screen position (l,t,r,b): (264,161,1032,691)
Visible: true
Window placement command: SW_SHOWNORMAL
Foreground: false
Foreground changed at 13:12:20:626 to true
[Screen]
Foreground changed at 13:12:24:959 to false
[Screen]
Foreground changed at 13:12:47:284 to true
[Screen]
Foreground changed at 13:12:51:852 to false
[Screen]

The following ScreenHistory screenshot was saved by the tool itself:

If you save an HTML file and load it in IE you would see formatted screen log (screenshot was saved by ScreenHistory):

- Dmitry Vostokov @ DumpAnalysis.org -

StressPrinters: Stressing Printer Autocreation

Tuesday, April 3rd, 2007

Printer drivers are great source of crash dumps especially in Citrix and Microsoft terminal services environments. Bad printer drivers crash or hang spooler service (spoolsv.exe) when multiple users connect to a server.

Most of bad drivers were designed and implemented for use in a single user environment without considering multithreading in mind. Some bad drivers display a dialog box every time the printer is created and because this is done on a server side users cannot dismiss it unless spooler service is configured to interact with the desktop and an administrator sees the dialog box. Some drivers are linked to a debug run-time library and every exception brings up a dialog effectively hanging the thread and sometimes the whole spooler service if there was heap corruption, for example.

Therefore before allowing terminal services users to use certain printers it is good to simulate multiple users trying to create particular printers to determine bad drivers and other printer components. Originally Citrix had very popular command line AddPrinter tool for this purpose and it has been replaced by StressPrinters tool where I designed and implemented GUI to set parameters, orchestration of multiple AddPrinter command line tools launched simultaneously with different parameters and overall log file management. You can even export your settings to a file and import it on another server. The tool also has 64-bit executables to test printer autocreation on x64 Windows.

Here are some screenshots:

The tool detects spooler crashes (if spoolsv.exe suddenly disappears from a process list) so you can check for crash dumps saved if you set up a default postmortem debugger (Dr. Watson or NTSD). If you see the progress bar hanging for a long time then you can dump the spooler service using MS userdump.exe to check for any stuck threads and resource contention.

You can register for free to read documentation and download this tool from Citrix support web site:

StressPrinters 1.2 for 32-bit and 64-bit platforms

- Dmitry Vostokov -

lvalues, rvalues and pointers

Monday, March 19th, 2007

I’ve just published stripped down HTML version of my old Code Reading lectures explaining lvalues and rvalues terminology (used in C and C++ standard documents) and pointers. It also explains how to read complex pointer declarations, const pointers and relationship between pointers and arrays. Understanding pointers is a must in low-level debugging. Can be found here:

lvalues, rvalues and pointers

- Dmitry Vostokov -

Practical Foundations of Debugging (x64)

Monday, March 19th, 2007

I’ve just published HTML slides for the first two original lectures on debugging on x64 platform written last year. Basically they are an improved version of my old lectures on debugging on x86 platforms developed in 2004. Now I put more emphasis on using WinDbg as a debugging tool and as previously no assembly language background is assumed. New lectures use x64 assembly language throughout. I’m planning to adapt them to ILP 32-32-64 Windows x64 model (integer-long-pointer) and port more old lectures this year.

- Dmitry Vostokov -

Internet Based Crash Dump Analysis Service

Friday, March 9th, 2007

I’m planning to launch a pilot version of free research online service IBCDAS (Internet Based Crash Dump Analysis Service) which is under development and will be integrated with Crash Dump Analysis Portal (www.dumpanalysis.org). The idea is to use Google API to search for crash signatures and stack traces on Internet and mine that information for a potential solution (a fix, a service pack, actual component vendor responsible for a bug, an article, etc.). Information from internet will be fed to a database in a structured form for further analysis and to help with similar or related problems.

- Dmitry Vostokov -

Crash Dump Analysis and Debugging Portal

Friday, March 9th, 2007

I’ve decided that content management system is more suitable for organizing links, blog feeds, books and book reviews, articles, etc. Last year I set up crash dump analysis forum mainly to keep all that information in one place. Then later I started my own blog. The amount of information I’m trying to organize is growing and I want it to be more structured than it is now so I installed Drupal CMS on www.dumpanalysis.org and the portal is currently under development. Updates will be posted regularly. The crash dump analysis forum that was parked there has been moved to www.dumpanalysis.org/forum and I made great efforts to preserve links to its topics.

- Dmitry Vostokov -

InstantDump (JIT Process Dumper)

Monday, February 19th, 2007

Techniques utilizing user mode process dumpers and debuggers like Microsoft userdump.exe, NTSD or WinDbg and CDB from Debugging Tools for Windows are too slow to pick up a process and dump it. You need either to attach a debugger manually, run the command line prompt or switch to Task Manager. This deficiency was the primary motivation for me to use JIT (just-in-time) technology for process dumpers. The new tool, InstantDump, will dump a process instantly and non-invasively in a moment when you need it. How does it work? You point to any window and press hot key.

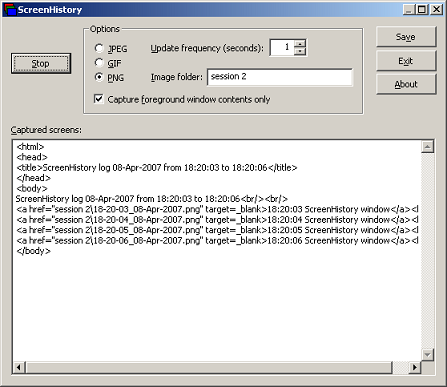
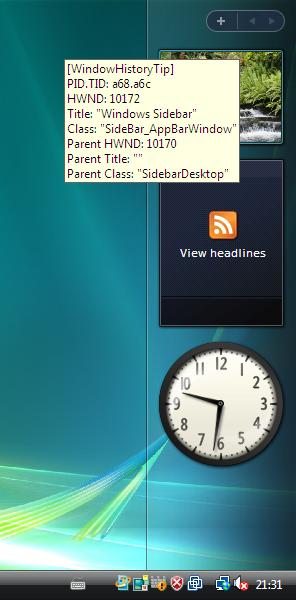
InstantDump could be useful to study hang GUI processes or to get several dumps of the same process during some period of time (CPU spiking case or memory leak, for example) or just dump the process for the sake of dumping it (for curiosity). The tool uses the same tooltip technology introduced in WindowHistory 4.0 to dynamically display window information.

Short user guide:

1. The program will run only on XP/W2K3/Vista (in fact it will not load on W2K).

2. Run InstantDump.exe on 32-bit system or InstantDump64.exe on x64 Windows. If you attempt to run InstantDump.exe on x64 Windows it will show this message box and quit:


3. InstantDump puts itself into task bar icon notification area:

4. By default when you move the mouse pointer over windows the tooltip follows the cursor describing the process and thread id and process image path (you can disable tips in Options dialog box):

5. If you hold Ctrl-RightShift-Break for less than a second then the process (which window is under the cursor) will be dumped according to the settings for external process dumper in options dialog (accessible via task bar icon right mouse click):


The saved dump name will be (in our Calculator window case): calc.exe_9f8(2552)_22-17-56_18-Feb-2007.dmp

Looks like there is no NTSD in Vista so you have to use another user mode dumper, for example, install MS userdump.exe and specify the following command line in Options dialog:

userdump.exe %d %s

or resort to WinDbg or CDB command line.

The tool can be downloaded from here.

The new version of this tool is under development that will automatically pick up a process name from Task Manager, Process Explorer or Process Monitor (in fact, from any tool that displays the list of processes) and then instantly dump it.

- Dmitry Vostokov -

WindowHistory 4.0

Thursday, February 15th, 2007

I’ve added tool tips showing window information when pointing at any window. Here are some screenshots:

This works inside Citrix seamless ICA sessions too. Additionally the new version tracks client window rectangle and its changes (this was missing in the previous versions).

It works on Vista (doesn’t require elevation):

32-bit version can be downloaded from Citrix support web site.

64-bit version, which tracks changes for both 32-bit and 64-bit windows on x64 Windows platform, can also be downloaded from Citrix support web site.

- Dmitry Vostokov @ DumpAnalysis.org -

Asmpedia.org update (2007, Week 6)

Tuesday, February 6th, 2007

Added EFLAGS/RFLAGS template:

http://www.asmpedia.org/index.php?title=EFLAGS/RFLAGS

AAA, MOV, NOP instructions have been updated to include EFLAGS (all other instructions will have it automatically):

Added 16-bit addressing ModRegRM table (for the sake of completeness):

http://www.asmpedia.org/index.php?title=ModRegRM_byte_%2816-bit_addressing%29

Added SIB byte translation table:

http://www.asmpedia.org/index.php?title=SIB_byte_%2832/64-bit_addressing%29

- Dmitry Vostokov -

SystemDump 3.1

Tuesday, January 23rd, 2007

New version of SystemDump for 32-bit and 64-bit platforms has been released. What’s new in this version:

  • Fixed the bug that prevented SystemDump to bugcheck second time after the first bugcheck and reboot happened (the known workaround was to run it twice second time)
  • Easter egg (hold key and click on About button)

The tool can be downloaded from Citrix support web site.

- Dmitry Vostokov -