Archive for September 12th, 2015

Trace Analysis Patterns (Part 113)
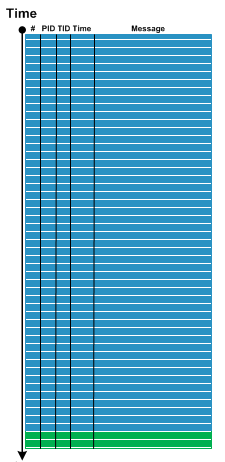
Saturday, September 12th, 2015

Recently we analyzed a few logs which ended with a specialized Activity Region from a subsystem that sets operational parameters. The problem description stated that the system became unresponsive after changing parameters in a certain sequence. Usually, for that system, when we stop logging (even after setting parameters) we end up with messages from some Background Components since some time passes between the end of setting parameters activity and the time the operator sends stop logging request:

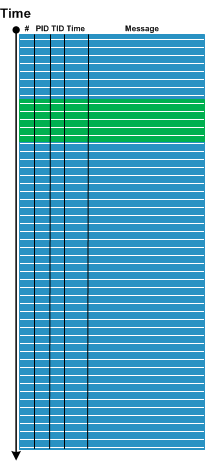
However, in the problem case we see message flow stops right in the middle of parameter setting activity:

So we advised to check for any crashes or hangs, and, indeed, it was found that the system was actually experiencing system crashes, and we got memory dumps for analysis where we found Top Module from a 3rd-party vendor related to parameter setting activity.

Please also note an analogy here between normal thread stack traces from threads that are waiting most of the time and Spiking Thread stack trace caught up in the middle of some function.

We call this pattern Ruptured Trace after a ruptured computation.

Note, that if it is possible to restart the system and resume the same tracing we may get an instance of Blackout analysis pattern.

- Dmitry Vostokov @ DumpAnalysis.org + TraceAnalysis.org -

Crash Dump Analysis Patterns (Part 35b)

Saturday, September 12th, 2015

Sometimes we notice the anomalies in object distribution in heaps and pools. Memory consumption may be high in case of big objects. Such anomalies may point to possible memory, handle, and object leaks. But it may also be a temporary condition (Memory Fluctuation) due to the large amount of queued or postponed work that can be solved by proper software configuration. Diagnosed anomalies may also direction troubleshooting efforts if they cluster around certain component(s) or specific functionality. The distribution can be assessed by both the total memory consumption and the total number of objects of a particular class.

Here’s an example of Object Distribution Anomaly analysis pattern from .NET heap. The output of !DumpHeap -stat WinDbg SOS extension command shows the abnormal distribution of objects related to SQL data queries:

Count TotalSize
[…]
2342 281040 System.Reflection.RuntimeParameterInfo
3868 309440 System.Data.Metadata.Edm.TypeUsage
13218 317232 System.Object
3484 390208 System.Reflection.RuntimeMethodInfo
6092 508044 System.Int32[]
2756 617344 System.Data.SqlClient._SqlMetaData
2770 822870 System.Char[]
24560 1375360 System.RuntimeType
18 4195296 System.Int64[]
449691 10792584 System.Data.SqlClient.SqlGen.SqlBuilder
449961 10799064 System.Int64
449691 14390112 System.Data.Query.InternalTrees.ComparisonOp
449695 14390240 System.Data.Query.InternalTrees.ConditionalOp
6360 15509435 System.Byte[]
449690 17987600 System.Data.Query.InternalTrees.ConstantOp
449938 17997520 System.Data.Query.InternalTrees.VarRefOp
450898 21643104 System.Data.Common.CommandTrees.DbPropertyExpression
[…]

The anomalous character of the distribution is also illustrated in the following diagrams:

- Dmitry Vostokov @ DumpAnalysis.org + TraceAnalysis.org -