Archive for October 12th, 2014

Crash Dump Analysis Patterns (Part 25c)

Sunday, October 12th, 2014

Sometimes threads related to file system operations may be blocked with not easily recognizable 3rd-party Top Module with only OS vendor modules such as NTFS or fltmgr present:

nt!KiSwapContext+0x7a
nt!KiCommitThreadWait+0x1d2
nt!KeWaitForSingleObject+0x19f
nt!FsRtlCancellableWaitForMultipleObjects+0x5e
nt!FsRtlCancellableWaitForSingleObject+0x27
fltmgr! ?? ::FNODOBFM::`string’+0×2bfa
fltmgr!FltpCreate+0×2a9

nt!IopParseDevice+0×14d3
nt!ObpLookupObjectName+0×588
nt!ObOpenObjectByName+0×306
nt!IopCreateFile+0×2bc
nt!NtCreateFile+0×78
nt!KiSystemServiceCopyEnd+0×13
ntdll!NtCreateFile+0xa
[…]

We see the same modules in I/O Request Stack Trace from the thread IRP. But because we see filter manager involved there may be some 3rd-party file system filters involved. Such filters are called before a device processes a request and also upon the completion of the request. There may be different filter callbacks registered for each case and they form a similar structure like I/O stack locations (we call this pattern Filter Stack Trace):

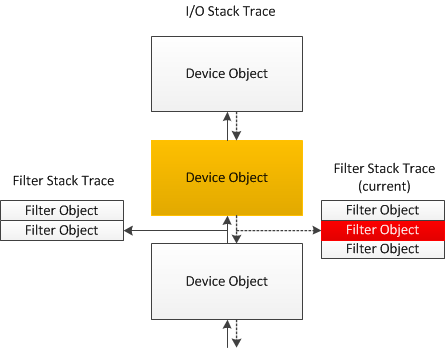
If one of such filters is blocked in a wait chain this may not be visible on I/O request or thread stacks because of possible asynchronous processing. But we may use !fltkd.irpctrl debugging extension command to examine the IRP context:

0: kd> !irp fffffa80162aa230
cmd flg cl Device File Completion-Context
[...]
[ 0, 0] 0 0 fffffa800cb28030 00000000 fffff880012048f0-fffffa8016f64010
\FileSystem\Ntfs fltmgr!FltpSynchronizedOperationCompletion
Args: 00000000 00000000 00000000 00000000
>[ 0, 0] 0 1 fffffa800ca00890 fffffa801060d070 00000000-00000000 pending
\FileSystem\FltMgr
Args: fffff88014450868 02000060 00000006 00000000

0: kd> !fltkd.irpctrl fffffa8016f64010
[...]
Cmd IrpFl OpFl CmpFl Instance FileObjt Completion-Context Node Adr
--------- -------- ----- ----- -------- -------- ------------------ --------
[0,0] 00000884 00 0000 fffffa800d29c010 fffffa801060d070 fffff8800518b474-0000000000000000 fffffa8016f641e0
("luafv","luafv") luafv!LuafvPostCreate
Args: fffff88014450868 0000000002000060 0000000000000006 0000000000000000 0000000000000000 0000000000000000
>[0,0] 00000884 00 0000 fffffa800e8051d0 fffffa801060d070 fffff88006808440-0000000000000000 fffffa8016f64160
(”3rdPartyFilter”,”3rdPartyFilter Instance”) FilterA!FltDriver_PostOperationCallback
Args: fffff88014450868 0000000002000060 0000000000000006 0000000000000000 0000000000000000 0000000000000000

[…]

So we see that FilterA module may be involved in blocking the thread (Blocking Module pattern extended to I/O request and filter stack traces).

- Dmitry Vostokov @ DumpAnalysis.org + TraceAnalysis.org -

Crash Dump Analysis Patterns (Part 25b)

Sunday, October 12th, 2014

If a thread has an associated I/O Request Packet (IRP) we may see another type of a stack trace we call I/O Request Stack Trace. It also grows bottom-up as can be seen on the diagram 3. We can see this stack trace by using !irp WinDbg command:

0: kd> !thread fffffa801827a4c0 3f
THREAD fffffa801827a4c0 Cid 06c0.50cc Teb: 000007ffffec8000 Win32Thread: fffff900c1c64010 WAIT: (Executive) KernelMode Alertable
fffffa8016f64028 SynchronizationEvent
IRP List:
fffffa80162aa230: (0006,03a0) Flags: 00000884 Mdl: 00000000
[…]
nt!KiSwapContext+0×7a
nt!KiCommitThreadWait+0×1d2
nt!KeWaitForSingleObject+0×19f
nt!FsRtlCancellableWaitForMultipleObjects+0×5e
nt!FsRtlCancellableWaitForSingleObject+0×27
fltmgr! ?? ::FNODOBFM::`string’+0×2bfa
fltmgr!FltpCreate+0×2a9
nt!IopParseDevice+0×14d3
nt!ObpLookupObjectName+0×588
nt!ObOpenObjectByName+0×306
nt!IopCreateFile+0×2bc
nt!NtCreateFile+0×78
nt!KiSystemServiceCopyEnd+0×13
ntdll!NtCreateFile+0xa
[…]

0: kd> !irp fffffa80162aa230
Irp is active with 10 stacks 10 is current (= 0xfffffa80162aa588)
No Mdl: No System Buffer: Thread fffffa801827a4c0: Irp stack trace.
cmd flg cl Device File Completion-Context
[ 0, 0] 0 0 00000000 00000000 00000000-00000000

Args: 00000000 00000000 00000000 00000000
[ 0, 0] 0 0 00000000 00000000 00000000-00000000

Args: 00000000 00000000 00000000 00000000
[ 0, 0] 0 0 00000000 00000000 00000000-00000000

Args: 00000000 00000000 00000000 00000000
[ 0, 0] 0 0 00000000 00000000 00000000-00000000

Args: 00000000 00000000 00000000 00000000
[ 0, 0] 0 0 00000000 00000000 00000000-00000000

Args: 00000000 00000000 00000000 00000000
[ 0, 0] 0 0 00000000 00000000 00000000-00000000

Args: 00000000 00000000 00000000 00000000
[ 0, 0] 0 0 00000000 00000000 00000000-00000000

Args: 00000000 00000000 00000000 00000000
[ 0, 0] 0 0 00000000 00000000 00000000-00000000

Args: 00000000 00000000 00000000 00000000
[ 0, 0] 0 0 fffffa800cb28030 00000000 fffff880012048f0-fffffa8016f64010
\FileSystem\Ntfs fltmgr!FltpSynchronizedOperationCompletion
Args: 00000000 00000000 00000000 00000000

>[ 0, 0] 0 1 fffffa800ca00890 fffffa801060d070 00000000-00000000 pending
\FileSystem\FltMgr
Args: fffff88014450868 02000060 00000006 00000000

We see the current stack trace pointer points to the bottom I/O stack location. Non-empty top locations are analogous to Past Stack Trace. Further exploration of Device and File column information may point to further troubleshooting directions such as the Blocking File pattern example.

By analogy with Stack Trace Collection pattern that dumps stack traces from all threads based on memory dump type there is also I/O Stack Trace Collection pattern that dumps I/O request stack traces from all IRPs that were possible to find.

- Dmitry Vostokov @ DumpAnalysis.org + TraceAnalysis.org -