Trace Analysis Patterns (Part 12)
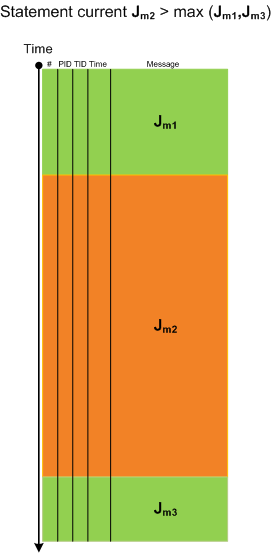
Tuesday, November 17th, 2009When looking at lengthy traces with thousands and millions of messages (trace statements) we can see regions of activity where statement current (Jm, msg/s) is much higher than in surrounding temporal regions. Hence the name of this pattern, Activity Region. Here is an illustration for a typical ETW/CDF trace where a middle region of activity (Jm2) signifies a system performing some response function like a user session initialization and application launch:
- Dmitry Vostokov @ TraceAnalysis.org -