Bugtation No.67
Thursday, November 20th, 2008Easy to remember 67th bugtation: 6 days and 7 nights and especially
“Seven” debugging “nights.”

- Dmitry Vostokov @ DumpAnalysis.org -
Easy to remember 67th bugtation: 6 days and 7 nights and especially
“Seven” debugging “nights.”
- Dmitry Vostokov @ DumpAnalysis.org -
DumpAnalysis.org jointly with OpenTask publisher announces forthcoming 2009 as
The Year of Debugging
More plans and projects will be announced soon with the new updated publishing roadmap! Stay tuned.
- Dmitry Vostokov @ DumpAnalysis.org -
Got this book yesterday in the post and started reading. Table of contents is amazing for its practical depth and breadth. If you want me to provide a review in a language of concurrency (I’m reading many books in parallel) I would simply say one word:
Priority!
It simply means priority reading for any Windows software developer and maintainer. Invaluable for any engineer debugging complex software problems and analyzing Windows crash dumps. Simply because Microsoft OS and CLR developers use all this concurrent stuff and best practices described in the book so it is vital to be able recognize them in memory dumps. After reading this book you also get priority boost in your understanding of process and thread dynamics and your ability to plan, architect, design and implement concurrent applications and services.
Concurrent Programming on Windows (Microsoft .NET Development Series)
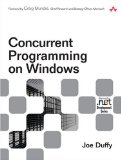
- Dmitry Vostokov @ DumpAnalysis.org -
Previously announced my old Resume and CV as a book was submitted to print and distribution worldwide this morning.
It features UML statechart diagrams on the following front cover I designed myself:
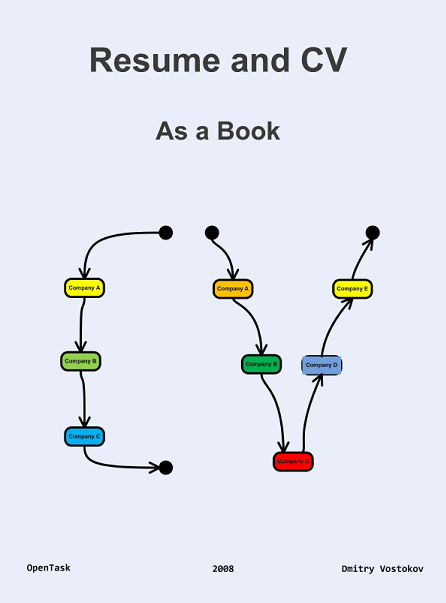
- Dmitry Vostokov @ DumpAnalysis.org -
“The” computer “is the only place where” a crash “comes before” hang.
Anonymous American Saying
- Dmitry Vostokov @ DumpAnalysis.org -
“… the” debugger “(my almighty” application ”) …”
Thomas Jefferson, TO JAMES MONROE, Paris Mar. 18. 1785
- Dmitry Vostokov @ DumpAnalysis.org -
A book can serve the role of CV but this weekend another idea got into my mind is to publish my old pre-Citrix times CV (1987 - 2003) as a book and as an example of a guy with CV-writing obsession like I had 5 - 8 years ago:
Soon it should appear on Amazon and bookshops around the world. Now when someone asks me to send a CV I can send them a link to buy it. ![]()
- Dmitry Vostokov @ DumpAnalysis.org -
OpenTask, a publisher of my books, is about to release a notebook for bloggers. For details please visit the page:
I found it indispensable to keep track of my own blog post ideas in a hardcopy format, work on several blog transformations into books and simultaneously keep track of work and home-related tasks.
- Dmitry Vostokov @ DumpAnalysis.org -
Noticed that my blog is clearly visible from outside my apartment window even in daylight:

- Dmitry Vostokov @ DumpAnalysis.org -
“Avoid” crashes and hangs, “but do not seek” total stability “- nothing so expensive as” total stability.
Sydney Smith, A Memoir of the Reverend Sydney Smith by his daughter, Lady Holland, with a Selection from his Letters
- Dmitry Vostokov @ DumpAnalysis.org -
Because of large book density on my table disasters are inevitable. And it happened a month ago. I spilled coffee. One bottom level book sank like Titanic. The book on top of it which I was browsing at that moment survived heavily damaged:

Recently I noticed that spilled coffee left a mark on one book side. It is clearly visible ”1“ on the picture above.
- Dmitry Vostokov @ DumpAnalysis.org -
“How can you say my” computation “is not a success?” Has it “not for more than sixty” days “got enough to” process “and escaped being” crashed?
Logan Pearsall Smith, Last Words
- Dmitry Vostokov @ DumpAnalysis.org -
Recently I got another manual complete memory dump from a hang workstation where default analysis pointed to a possibility for a Spiking Thread pattern:
0: kd> !analyze -v

[...]

MANUALLY_INITIATED_CRASH (e2)

The user manually initiated this crash dump.

Arguments:

Arg1: 00000000

Arg2: 00000000

Arg3: 00000000

Arg4: 00000000

[...]

GetContextState failed, 0x80070026

Unable to read selector for PCR for processor 1

GetContextState failed, 0x80070026

Unable to read selector for PCR for processor 1
PROCESS_NAME: AppA.exe
CURRENT_IRQL: 0
LAST_CONTROL_TRANSFER: from 808b73a4 to 808b72cb
STACK_TEXT:

f46f5b44 808b73a4 e1a36008 00000004 00000018 nt!HvpFindFreeCellInThisViewWindow+0xd7

f46f5b6c 808bd07b e1a36008 00000002 00000018 nt!HvpFindFreeCell+0x98

f46f5b98 808bd588 e1a36008 e1a362fc 00000000 nt!HvpDoAllocateCell+0x69

f46f5bbc 808d0b22 e1a36008 009214a0 c94e24a4 nt!HvReallocateCell+0x9a

f46f5bdc 808c1028 e1a36008 051fa3e8 00000003 nt!CmpAddValueToList+0x46

f46f5c28 808c406a e1a36008 cddb7ccc f46f5d0c nt!CmpSetValueKeyNew+0xfa

f46f5cb4 808b7e2f e45872e0 f46f5d0c 00000004 nt!CmSetValueKey+0x426

f46f5d44 8088978c 00000438 0012fad0 00000000 nt!NtSetValueKey+0x241

f46f5d44 7c8285ec 00000438 0012fad0 00000000 nt!KiFastCallEntry+0xfc

0012fa58 7c827b7b 77f77703 00000438 0012fad0 ntdll!KiFastSystemCallRet

0012fa5c 77f77703 00000438 0012fad0 00000000 ntdll!ZwSetValueKey+0xc

0012faa0 77f5ec90 00000438 0012fad0 00000004 ADVAPI32!LocalBaseRegSetValue+0x12c

0012fb04 60072e40 00000438 6290c0c4 00000000 ADVAPI32!RegSetValueExA+0x160

WARNING: Stack unwind information not available. Following frames may be wrong.

0012fbf4 628e2d57 60062e70 60062b40 80000001 DLLA!GetObjectId+0×9600

[…]
FOLLOWUP_IP:

nt!HvpFindFreeCellInThisViewWindow+d7

808b72cb 034508          add     eax,dword ptr [ebp+8]
Looking at this thread information we see it RUNNING (this is also evident from its call stack):
0: kd> !thread

THREAD 8a0b2890  Cid 0814.10e8  Teb: 7ffdf000 Win32Thread: bc217c68 RUNNING on processor 0

Not impersonating

DeviceMap                 e440acc0

Owning Process            8a0d85f8       Image:         AppA.exe

Wait Start TickCount      153974         Ticks: 0

Context Switch Count      16905                 LargeStack

UserTime                  00:00:03.109

KernelTime                00:00:17.500

[…]
We also see that the thread accumulated 17 seconds as time spent in kernel. Switching to AppA process context and looking at its Image version we see that it is 5.80.x:
0: kd> lmv m AppA

start    end        module name

00400000 0049c000   AppA   (deferred)

    Image path: C:\PROGRA~1\AppA\AppA.exe

    Image name: AppA.exe

    Timestamp:        Thu Jun 05 14:51:52 2008 (4847EF78)

    CheckSum:         0009D068

    ImageSize:        0009C000

    File version:     5.80.5.1764

    Product version:  5.80.0.0
However from Google search we can find that there is newer version available (variant of Not My Version pattern) and even some indication on various forums that the older ones had problems with CPU resource utilization. We may stop here but I usually scan all threads for any suspicious signs and we can see another running thread on the second CPU:
THREAD 8a2ed5d0  Cid 11b4.1100  Teb: 7ffdf000 Win32Thread: bc342b80 RUNNING on processor 1

Not impersonating

DeviceMap                 e44fc100

Owning Process            8a1efcb0       Image:         calc.exe

Wait Start TickCount      153973         Ticks: 1 (0:00:00:00.015)

Context Switch Count      50736                 LargeStack

UserTime                  00:01:04.515

KernelTime                00:00:00.015

Win32 Start Address calc (0×0101e23a)

Start Address kernel32!BaseProcessStartThunk (0×77e617f8)

Stack Init f4cd6000 Current f4cd5d00 Base f4cd6000 Limit f4cd1000 Call 0

Priority 6 BasePriority 6 PriorityDecrement 0

Unable to get context for thread running on processor 1, Win32 error 0n38
We also see that this thread spent more than a minute in user mode. Unfortunately we cannot see its thread stack because the dump shows signs of Truncated Dump pattern:
Loading Dump File [MEMORY.DMP]

Kernel Complete Dump File: Full address space is available
************************************************************

WARNING: Dump file has been truncated.  Data may be missing.

************************************************************

[…]
0: kd> ~1

GetContextState failed, 0×80070026

Unable to read selector for PCR for processor 1

WARNING: Unable to reset page directories

GetContextState failed, 0×80070026

GetContextState failed, 0×80070026

GetContextState failed, 0×80070026

Unable to get program counter

GetContextState failed, 0×80070026

Unable to get current machine context, Win32 error 0n38

GetContextState failed, 0×80070026

GetContextState failed, 0×80070026

GetContextState failed, 0×80070026

GetContextState failed, 0×80070026

GetContextState failed, 0×80070026

GetContextState failed, 0×80070026

GetContextState failed, 0×80070026

GetContextState failed, 0×80070026

GetContextState failed, 0×80070026
The dump file size 4,177,920 Kb is less than amount of physical memory 4,192,948 Kb:
1: kd> !vm

GetContextState failed, 0x80070026

GetContextState failed, 0x80070026

GetContextState failed, 0x80070026

Unable to get program counter
*** Virtual Memory Usage ***

 Physical Memory:     1048237 (   4192948 Kb)

 Page File: \??\R:\pagefile.sys

   Current:   4177920 Kb  Free Space:   4154440 Kb

   Minimum:   4177920 Kb  Maximum:      4194304 Kb
We can stop here and still recommend to upgrade AppA product seen from the thread running on the first processor but the fact that the second thread belongs to innocent calc.exe demands some attention. Was it calculating incessantly some financial figures following button clicks from a financial genius? Taking advantage of a complete memory dump and the fact that this process spent most of the time in user space we can check for Hooked Functions pattern:
1: kd> .process /r /p 8a1efcb0

Implicit process is now 8a1efcb0

Loading User Symbols

..........................

GetContextState failed, 0x80070026

GetContextState failed, 0x80070026

GetContextState failed, 0x80070026

GetContextState failed, 0x80070026

GetContextState failed, 0x80070026

GetContextState failed, 0x80070026

GetContextState failed, 0x80070026

GetContextState failed, 0x80070026

GetContextState failed, 0x80070026

GetContextState failed, 0x80070026

GetContextState failed, 0x80070026

GetContextState failed, 0x80070026
1: kd> !chkimg -lo 50 -d !user32 -v

GetContextState failed, 0x80070026

GetContextState failed, 0x80070026

GetContextState failed, 0x80070026

Unable to get program counter

Searching for module with expression: !user32

Will apply relocation fixups to file used for comparison

Will ignore NOP/LOCK errors

Will ignore patched instructions

Image specific ignores will be applied

Comparison image path: c:\mss\USER32.dll\45D70AC791000\USER32.dll

No range specified
Scanning section:    .text

Size: 392891

Range to scan: 77381000-773e0ebb

    7738c341-7738c345  5 bytes - USER32!CreateWindowExA

 [ 8b ff 55 8b ec:e9 ba 3c 00 c0 ]

[…]

Total bytes compared: 73728(18%)

Number of errors: 75

75 errors : !user32 (7738c341-773a154d)

GetContextState failed, 0×80070026

GetContextState failed, 0×80070026

GetContextState failed, 0×80070026

GetContextState failed, 0×80070026

GetContextState failed, 0×80070026

GetContextState failed, 0×80070026
1: kd> u 7738c341

USER32!CreateWindowExA:

7738c341 e9ba3c00c0      jmp     37390000

7738c346 6801000040      push    40000001h

7738c34b ff7534          push    dword ptr [ebp+34h]

7738c34e ff7530          push    dword ptr [ebp+30h]

7738c351 ff752c          push    dword ptr [ebp+2Ch]

7738c354 ff7528          push    dword ptr [ebp+28h]

7738c357 ff7524          push    dword ptr [ebp+24h]

7738c35a ff7520          push    dword ptr [ebp+20h]

GetContextState failed, 0×80070026

GetContextState failed, 0×80070026

GetContextState failed, 0×80070026
1: kd> u 37390000

37390000 e96b91562e      jmp     HookA!CreateWindowExA (658f9170)

37390005 8bff            mov     edi,edi

37390007 55              push    ebp

37390008 8bec            mov     ebp,esp

3739000a e937c3ff3f      jmp     USER32!CreateWindowExA+0×5 (7738c346)

3739000f 0000            add     byte ptr [eax],al

37390011 0000            add     byte ptr [eax],al

37390013 0000            add     byte ptr [eax],al

GetContextState failed, 0×80070026

GetContextState failed, 0×80070026

GetContextState failed, 0×80070026

GetContextState failed, 0×80070026

GetContextState failed, 0×80070026

GetContextState failed, 0×80070026
Indeed we see that HookA module is involved and we can recommend to test the stability of the system without the product that uses it or upgrading or disabling this component.
- Dmitry Vostokov @ DumpAnalysis.org -
OpenTask, a publisher of my books, is about to release a notebook for small and self-publishers. It’s title is Title itself. For details please visit the page:
Title: Book Publisher’s Notebook
I found it indispensable to keep track of my own book titles and their book data in a hardcopy format.
- Dmitry Vostokov @ DumpAnalysis.org -
“To” debug “is to” code “twice.”
Joseph Joubert, Pensées
- Dmitry Vostokov @ DumpAnalysis.org -
“Impatient” engineers “always” debug “too late.”
Jean Gwenaël Dutourd, Le Fond et la Forme, essai alphabétique sur la morale et sur le style
- Dmitry Vostokov @ DumpAnalysis.org -
A number of writers expressed their wishes to be a co-author of the forthcoming SF novel Googol Dump. I have selected Dun Bugmons for his name sounding like Dún Laoghaire where I live nearby by walking distance in Monkstown and his surname accidentally reminding me of Bug Monitors. Please join me in congratulating Dun Bugmons!
- Dmitry Vostokov @ DumpAnalysis.org -
While working on WinDbg command cards and even before that when compiling a comparison table for both WinDbg and GDB I came to an idea of abstract debugging commands that correspond to common debugging tasks, have clear syntax and semantics and serve metaphorically as a basis for conversion of analog thinking to digital debugger assistance (see analog-to-digital conversion for ADC abbreviation). Here a WinDbg extension can help but now I think about using a tree-based approach similar to CMDTREE.TXT for CDA Checklist. More on this later. Any comments or suggestions are greatly appreciated.
- Dmitry Vostokov @ DumpAnalysis.org -
When we have tool commands that sound similar to English words like common root French or German vocabulary to English why not to leverage time-proven foreign language learning techniques:
WinDbg: A Reference Poster and Learning Cards
- Dmitry Vostokov @ DumpAnalysis.org -
Suddenly the course of my publishing activities bended a little to produce a DIY poster and learning cards to be published soon. Here are the product details:
Annotation:
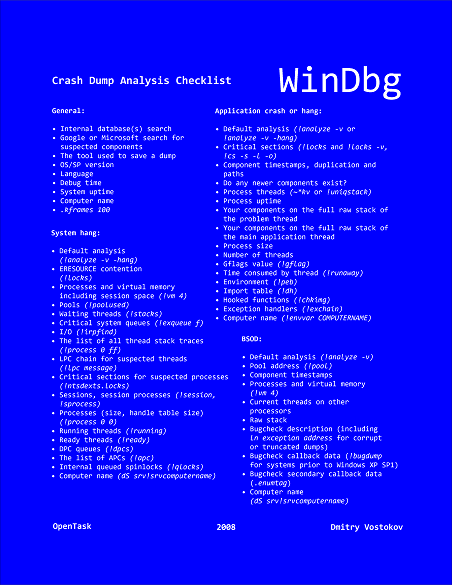
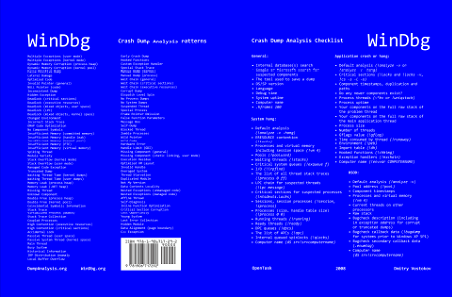
WinDbg is a powerful debugger from Microsoft Debugging Tools for Windows. It has more than 350 commands that can be used in different debugging scenarios. The cover of this book is a poster featuring crash dump analysis checklist and common patterns seen in memory dumps and live debugging sessions. Inside the book you can find ready to cut learning cards with commands and their descriptions coloured according to their use for crash dump or live debugging sessions and user, kernel or complete memory dumps. Tossing cards can create unexpected connections between commands and help to learn them more quickly. Uncut pages can also serve as birds eye view to WinDbg debugging capabilities. More than 350 WinDbg commands including meta-commands and extensions are included.
Front cover:
Back cover:
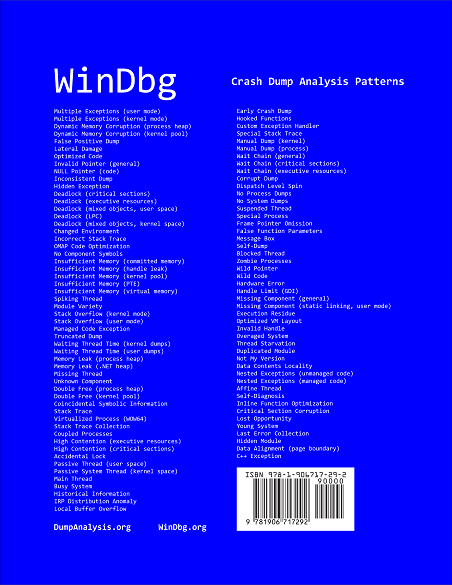
After you take inside pages out you are left with a cover that you can use as a crash dump analysis checklist and patterns poster:
I also plan to update this book on a yearly basis.
- Dmitry Vostokov @ DumpAnalysis.org -