Archive for October, 2006

Musical Dumps

Wednesday, October 18th, 2006

After listening to “An Anthology of Noise and Electronic Music”

Buy from Amazon

Buy from Amazon

Buy from Amazon

Buy from Amazon

and remembering that long time ago I was asked to convert stock charts into sound waves an idea came to me to convert memory dump files into WAV files by appending an appropriate header in front of them. So depending on imposed sampling frequency (Hz), quantization level (bits) and mono/stereo settings you can enjoy listening to dumps. Long time ago I wrote a component for hard-disk recording while working on my voice recognition projects and I’m going to reuse it now.

Forthcoming DumpPlayer will be released this weekend for free download so stay tuned. 

If it goes well I promise to write a WinDbg extension to listen to a given memory range.

- Dmitry Vostokov -

Dumps, Debuggers and Virtualization (…)

Tuesday, October 17th, 2006

I’ve been thinking about this since my previous DDV post and came up with the following example of general DDV architecture:

So we need:

  • A “Debugger” to debug “Virtualization layer”
  • A “Debugger plugin” to help the “Debugger” to understand the “Subject of virtualization”
  • Not to mention various virtualized “debuggers” debugging their virtualized subjects

- Dmitry Vostokov -

Dumps, Debuggers and Virtualization

Monday, October 16th, 2006

Everyone now speaks about virtualization and its benefit. New horizons. I would like to add my 2 cents from dump analysis and debugging perspective. There will be more complex debugging environment as my recent experience with WOW64 tells me:

So if we generalize this to virtualization environment we would come up with the following picture:

- Dmitry Vostokov -

Forthcoming new tool: ProcessHistory

Sunday, October 15th, 2006

New addition to “History” toolbox: ProcessHistory. It has similar GUI interface as WindowHistory and MessageHistory:

ProcessHistory tracks process creation and exit, thread creation and termination and also modules (DLL, OCX, etc.) and their loading and unloading.

The tool has 2 executables: ProcessHistory.exe for 32-bit platforms and ProcessHistory64.exe for 64-bit platforms. In fact, you need both for your 64-bit platform if you want to track modules: if your application is 32-bit ProcessHistory.exe will correctly show loaded and unloaded 32-bit modules whereas ProcessHistory64.exe will only show WOW64 components.

I’m already working on the next version 2.x which can record changes in real-time and I’m also porting the current version to Windows CE and Windows Mobile.

- Dmitry Vostokov -

Troubleshooting tool ideas

Saturday, October 14th, 2006

If you have any troubleshooting or debugging tool idea you can post a comment here, write to me (if you know my Citrix e-mail) or simply drop a message to my personal address.

Full credit and thank you note will be given in About dialog box if I implement the idea. I already developed a nice component for that purpose. Demo will be posted soon.

I write most of my tools using C++/STL/MFC/Win32 API and occasionally plain C (for device drivers). Most of them are released in both 32-bit and 64-bit versions and occasionally ported to Windows Mobile. Written tools don’t carry .NET baggage with them although I plan to utilize managed C++ in future MFC-based tools if certain .NET functionality is required.

Thank you!

- Dmitry Vostokov -

Crash Dumps for Dummies (Part 2)

Saturday, October 14th, 2006

Part 2 follows the discussion of various dump types depicted here: Dumps for Dummies (Part 1) 

So the question arises: how to make sure the customer got the right dump? And if the dump type is not what you asked for provide a recommendation for further actions. Troubled with such questions during my first years in Citrix technical support I decided to develop a lightweight Explorer extension and a command line version of dump checking tool called Citrix DumpCheck:

Here it does basic checks for dump validity and shows the dump type: Complete memory dump

If it found small mini dump type (64Kb) the tool would have suggested to change settings in Control Panel.

The extension can be downloaded from Citrix support web site:

Citrix DumpCheck Explorer Extension version 1.4 

FAQ:

Q. Is it possible to show more information like process name in a user dump or whether full page heap was enabled?

A. Certainly it is possible to include. However it requires access to OS symbol files during runtime and most customers don’t have them installed or downloaded from MS symbol server. So the design decision was not to include these checks in version 1.x. I consider to include this in next versions 2.x.

Q. The customer doesn’t want to modify environment by installing extension. Is there any command line version of this tool?

A. Yes, there is. The following article contains a download link to a command line version of Citrix DumpCheck:

Citrix DumpCheck Utility (Command Line) version 1.4   

Q. Does this extension work in 64-bit Windows?

A. No, but you can use command line equivalent shown in the answer to the previous question. Also I’m planning to port this extension to 64-bit soon and will announce as soon as I release it.

- Dmitry Vostokov  @ DumpAnalysis.org -

Looking for strings in a dump

Thursday, October 12th, 2006

Recently I discovered wonderful WinDbg commands dpu (UNICODE strings) and dpa (ASCII strings). Look at WinDbg help for other d** equivalents like dpp.

I needed to examine raw stack data and check if any pointers on stack were pointing to strings. For example:

0:143> !teb
TEB at 7ff2b000
...
    StackBase:            05e90000
    StackLimit:           05e89000
...
...
...
0:143> dpu 05e89000 05e90000
05e8f58c  00120010 ""
...
...
...
05e8f590  77e7723c "Debugger"
05e8f594  00000000
05e8f598  08dc0154
05e8f59c  01000040
05e8f5a0  05e8f5dc "G:\WINDOWS\system32\faultrep.dll"
05e8f5a4  0633adf0 ""
05e8f5a8  00000000
05e8f5ac  00000001
05e8f5b0  00000012
05e8f5b4  7c8723e0
05e8f5b8  ffffffff
05e8f5bc  00000004
05e8f5c0  69500000
05e8f5c4  00000000
05e8f5c8  00000aac
05e8f5cc  00000002
05e8f5d0  05e8f740
05e8f5d4  0633adfc "drwtsn32 -p %ld -e %ld -g"
05e8f5d8  00000000
...
...
...

Of course, you can apply these commands to any memory range, not only stack.

- Dmitry Vostokov -

Quiz: 32/64 = ?

Tuesday, October 10th, 2006

Q: What proportion of Citrix customers uses 64-bit server environment?

Hint: search Citrix support web site but don’t run complex search queries - think Citrix tools

A: If we look at download counts for two Citrix tools ADSCleaner and WindowHistory which were published separately for 32-bit and 64-bit platforms but at the same time (links might require free registration):

http://support.citrix.com/kb/category.jspa?categoryID=682 

ADSCleaner 2.0  - 299 downloads

ADSCleaner64 2.0 (for x64 platforms)  - 33 downloads

WindowHistory 2.1  - 140 downloads

WindowHistory64 2.1 (for x64 platforms)  - 31 downloads

So we have approximately 10 - 20% of Citrix customers using 64-bit environments. 20% is the upper limit. What about lower limit? Let’s look at another published tool:

Repair CBD Chain  - 4282 downloads

RepairCBDChain64  - 60 downloads

Therefore the lower limit is less than 2%.

Conclusion: 2 - 20% of Citrix customers use 64-bit environments :-)

- Dmitry Vostokov -

Crash Dumps for Dummies (Part 1)

Monday, October 9th, 2006

There is much confusion among MS and therefore Citrix customers about different dump types - Windows has 3 major dump types (not including various mini-dumps): complete, kernel and user. Long time ago I created a hand-crafted picture showing how various parts of computer memory are saved in a dump and I want to share it with a wider part of Citrix community and perhaps with the rest of the world:

- Dmitry Vostokov  @ DumpAnalysis.org -

UML and Device drivers

Sunday, October 8th, 2006

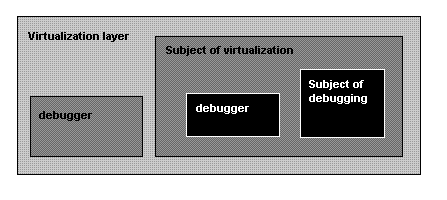
I got the impression after reading numerous books and articles about device drivers that UML is almost never used in describing kernel and device driver design and architecture. Everything is described either by words or using proprietary notations. If you don’t know about UML (Unified Modeling Language) it is time to learn because it is an industry standard general purpose modeling language with graphical notation. You can find many good tutorials on the Web and I can recommend the book to start:

UML Distilled: A Brief Guide to the Standard Object Modeling Language, Third Edition

Buy from Amazon

Recently I created some diagrams based on my past experience in using UML to describe and communicate architecture and design:

0. Component diagram depicting major driver interfaces 

driverinterfaces2.JPG

1. Class and object diagram depicting relationship between drivers and devices

 Drivers and Devices

2. Component diagram showing dependencies and interfaces when calling Win32 API function ReadFile

iomanager.JPG

3. Component diagram showing IRP flow in a driver stack (driver-to-driver communication)

Actually I found that some driver books incorrectly depict the ordering of I/O stack locations in IRP stack corresponding to driver or device stack. The correct layout is depicted above. IRP I/O stack locations grow down (to lower addresses) in memory like any other Wintel stack. You can see it from kernel dumps or the following macro from DDK header file wdm.h which shows that next IRP I/O stack location is down in memory (1 is subtracted from current stack location pointer):

#define IoGetNextIrpStackLocation( Irp ) (\
    (Irp)->Tail.Overlay.CurrentStackLocation - 1 )

Dumps (and live debugging) are good in studying component relationships, reconstructing sequence diagrams, etc. For example, this edited fragment below is from crash dump and it shows who calls whom and component dependencies be reconstructed from call stack of Win32 API function GetDriveType: SHELL32 (calls it) -> kernel32 -> ntdll -> nt (ntoskrnl.exe). You can also see various Citrix hooks and filters here (CtxSbxXXX):

kd> kL
CtxSbx!xxx
nt!IovCallDriver
nt!IofCallDriver
CtxAltStr!xxx
nt!IovCallDriver
nt!IofCallDriver
nt!IopParseDevice
nt!ObpLookupObjectName
nt!ObOpenObjectByName
nt!IopCreateFile
nt!IoCreateFile
nt!NtOpenFile
nt!KiSystemService
SharedUserData!SystemCallStub
ntdll!ZwOpenFile
CtxSbxHook!xxx
kernel32!GetDriveTypeW
SHELL32!CMountPoint::_EnumMountPoints

- Dmitry Vostokov -

Studying Linux kernel

Thursday, October 5th, 2006

I believe studying Linux kernel and playing with it will broaden your conceptual understanding of kernel development and issues and you can apply it to Wintel stuff too. I’m not a complete Windows guy as you might think after reading my previous posts. I spent 1.5 years (before joining Citrix) under RedHat Linux writing C++ software quality tools in C++ using Emacs editor (working for Programming Research Ltd www.programmingresearch.com). And I did multi platform (Windows - Linux - Solaris) architecture, design and programming for Boeing Commercial Airplanes Group 6 years ago (when working for the biggest Russian outsourcing company Luxoft www.luxoft.com). Coupled with all this prior knowledge about Linux I’m on my journey to study the latest Linux kernel (2.6) and I would recommend 2 wonderful books I’m reading now:

Linux Kernel Development, 2nd Edition

Buy from Amazon

Understanding Linux Kernel, 3rd Edition

Buy from Amazon

and another fantastic book about Unix internals in general:

UNIX Internals

Buy from Amazon

- Dmitry Vostokov -

WinDbg as a big calculator

Tuesday, October 3rd, 2006

Noticed as one engineer was frequently switching between WinDbg and Calc. Forget about using calc.exe during debugging or dump analysis sessions. Save your valuable time. Don’t multiprocess. Use ? and .formats commands:

0:000> ? 2 + 2
Evaluate expression: 4 = 00000004
0:000> .formats 4
Evaluate expression:
  Hex:     00000004
  Decimal: 4
  Octal:   00000000004
  Binary:  00000000 00000000 00000000 00000100
  Chars:   ....
  Time:    Thu Jan 01 00:00:04 1970
  Float:   low 5.60519e-045 high 0
  Double:  1.97626e-323

Now you can do your finance calculations in WinDbg too.

The WinDbg Way!

- Dmitry Vostokov -

Statistics: 100% CPU spread over all processes

Tuesday, October 3rd, 2006

If this scenario happens after some event or user action most likely some notification hooks were involved. WinDbg !thread command on the current processor will most likely catch running thread than IdleLoop thread and !process command will show the current process context. Then from thread stack you can make an educated guess which components were likely responsible for that.

To change the current processor when looking at the dump from multiprocessor platform use ~”p”s command where “p” is zero-based processor number, for example, ~1s changes the current processor to the second processor. Remember that every processor has its own thread and process context. If processor has nothing to do it is looping in KiIdleLoop thread which belongs to Idle process.

- Dmitry Vostokov -