The first Memory Analysis CD album
June 1st, 2008Just discovered this album from Polish band Gutter Sirens on Amazon:


I haven’t listened to it yet. Will post a review as soon as it arrives 
- Dmitry Vostokov @ DumpAnalysis.org -
Just discovered this album from Polish band Gutter Sirens on Amazon:
I haven’t listened to it yet. Will post a review as soon as it arrives
- Dmitry Vostokov @ DumpAnalysis.org -
ManagementBits Blog:
Managing Reading via Cooperative Multireading
LiterateScientist Blog:
The Science of Sherlock Holmes
- Dmitry Vostokov @ DumpAnalysis.org -
Just discovered that priority goes to Mikel Lasa
Memory Dump: 1960-1990 (Poesía vasca, hoy)
- Dmitry Vostokov @ DumpAnalysis.org -
Sometimes certain files are opened but not closed when not needed and this prevents other applications and users from using, deleting or replacing them. Sometimes on behalf of certain API calls another process opens them. One of the questions I was asked recently is how to find that process. The answer that I found is very simple: just list all handles from all processes and search for that file name there. This works in kernel and complete memory dumps and also in live kernel debugging session including its local kernel debugging variant. The following WinDbg command lists all objects (we need to open a log because the output is usually of several megabytes):
3: kd> !for_each_process "!handle 0 3 @#Process"
!handle 0 3 @#Process

processor number 3, process 8a392818

PROCESS 8a392818  SessionId: none  Cid: 0004    Peb: 00000000  ParentCid: 0000

    DirBase: bfc51000  ObjectTable: e1001e00  HandleCount: 2650.

    Image: System
Handle table at e16a3000 with 2650 Entries in use

0004: Object: 8a392818  GrantedAccess: 001f0fff Entry: e1004008

Object: 8a392818  Type: (8a392e70) Process

    ObjectHeader: 8a392800 (old version)

        HandleCount: 3  PointerCount: 235
0008: Object: 8a391db0  GrantedAccess: 00000000 Entry: e1004010

Object: 8a391db0  Type: (8a392ca0) Thread

    ObjectHeader: 8a391d98 (old version)

        HandleCount: 1  PointerCount: 1
000c: Object: e101bca0  GrantedAccess: 00000000 Entry: e1004018

Object: e101bca0  Type: (8a37db00) Key

    ObjectHeader: e101bc88 (old version)

        HandleCount: 1  PointerCount: 3

        Directory Object: 00000000  Name: \REGISTRY
[...]
1fac: Object: 88ec72b0  GrantedAccess: 00000003 (Protected) Entry: e1ed7f58

Object: 88ec72b0  Type: (8a36f900) File

    ObjectHeader: 88ec7298 (old version)

        HandleCount: 1  PointerCount: 2

        Directory Object: 00000000  Name: \Documents and Settings\MyUserName\NTUSER.DAT {HarddiskVolume1}
[...]
07fc: Object: e1000768  GrantedAccess: 00000003 Entry: e2fefff8

Object: e1000768  Type: (8a387e70) KeyedEvent

    ObjectHeader: e1000750 (old version)

        HandleCount: 273  PointerCount: 274

        Directory Object: e1001a48  Name: CritSecOutOfMemoryEvent
processor number 3, process 8873f3b8

PROCESS 8873f3b8  SessionId: 6  Cid: 4c1c    Peb: 7ffdf000  ParentCid: 42bc

    DirBase: 49dbb000  ObjectTable: e325f788  HandleCount:  90.

    Image: PROFLWIZ.EXE
Handle table at e36c3000 with 90 Entries in use

0004: Object: e1000768  GrantedAccess: 00000003 Entry: e36c3008

Object: e1000768  Type: (8a387e70) KeyedEvent

    ObjectHeader: e1000750 (old version)

        HandleCount: 273  PointerCount: 274

        Directory Object: e1001a48  Name: CritSecOutOfMemoryEvent
[...]
- Dmitry Vostokov @ DumpAnalysis.org -
Following the introductory division of memory analysis into two broad categories I decided to plan yet another book with the following title and preliminary product details:
As you might have noticed, I prefer to put 128, 256 or 512 pages in my book announcements. What that would say about the author’s background? I would like to set 1024 pages for my memory dump analysis anthology series but 740 or 800 pages is the limit for POD technology I use.
- Dmitry Vostokov @ DumpAnalysis.org -
Software ageing can be the cause of the problem. Sometimes a look at the following WinDbg output can give irresistible temptation to suggest periodic reboots:
Debug session time: Wed April 28 15:36:52.330 2008 (GMT+0)

System Uptime: 124 days 6:27:16.658
The suggested pattern name is Overaged System.
- Dmitry Vostokov @ DumpAnalysis.org -
While working on WDN book I noticed that it is possible to analyze managed code in complete memory dumps. We just need to switch to the process in question and load SOS DLL (if memory dumps are from 64-bit Windows we need to run 64-bit WinDbg because it needs to load 64-bit SOS from Microsoft.NET \ Framework64 \ vX.X.XXXXX folder).
Here is some command output from a complete memory dump generated from SystemDump when running TestDefaultDebugger.NET application where we try to find and disassemble IL code for this function:
namespace WindowsApplication1

{

  public partial class Form1 : Form

  {

[...]

  private void button1_Click(object sender, EventArgs e)

  {

  System.Collections.Stack stack = new System.Collections.Stack();
stack.Pop();
}
}
}
Loading Dump File [C:\W2K3\MEMORY_NET.DMP]

Kernel Complete Dump File: Full address space is available
Symbol search path is: srv*c:\mss*http://msdl.microsoft.com/download/symbols

Executable search path is:

Windows Server 2003 Kernel Version 3790 (Service Pack 2) UP Free x64

Product: Server, suite: Enterprise TerminalServer

Built by: 3790.srv03_sp2_gdr.070321-2337

Kernel base = 0xfffff800`01000000 PsLoadedModuleList = 0xfffff800`01198b00
kd> !process 0 0

**** NT ACTIVE PROCESS DUMP ****

[...]

PROCESS fffffadfe7287610

    SessionId: 0  Cid: 0ad8    Peb: 7fffffdf000  ParentCid: 0acc

    DirBase: 12cd9000  ObjectTable: fffffa800163c260  HandleCount: 114.

    Image: TestDefaultDebugger.NET.exe
PROCESS fffffadfe67905a0

    SessionId: 0  Cid: 085c    Peb: 7fffffd4000  ParentCid: 0acc

    DirBase: 232e2000  ObjectTable: fffffa8000917e10  HandleCount:  55.

    Image: SystemDump.exe
kd> .process /r /p fffffadfe7287610

Implicit process is now fffffadf`e7287610

Loading User Symbols
kd> .loadby sos mscorwks
kd> !threads
ThreadCount: 2

UnstartedThread: 0

BackgroundThread: 1

PendingThread: 0

DeadThread: 0

Hosted Runtime: no

                                              PreEmptive                                                Lock

       ID OSID        ThreadOBJ     State   GC     GC Alloc Context                  Domain           Count APT Exception

       1  a94 0000000000161150      6020 Enabled  0000000000000000:0000000000000000 000000000014ccb0     0 STA

       2  604 00000000001688b0      b220 Enabled  0000000000000000:0000000000000000 000000000014ccb0     0 MTA (Finalizer)
kd> !process fffffadfe7287610 4

PROCESS fffffadfe7287610

    SessionId: 0  Cid: 0ad8    Peb: 7fffffdf000  ParentCid: 0acc

    DirBase: 12cd9000  ObjectTable: fffffa800163c260  HandleCount: 114.

    Image: TestDefaultDebugger.NET.exe
        THREAD fffffadfe668cbf0  Cid 0ad8.0a94  Teb: 000007fffffdd000 Win32Thread: fffff97ff4df2830 WAIT

        THREAD fffffadfe727e6d0  Cid 0ad8.0f54  Teb: 000007fffffdb000 Win32Thread: 0000000000000000 WAIT

        THREAD fffffadfe72d5bf0  Cid 0ad8.0604  Teb: 000007fffffd9000 Win32Thread: 0000000000000000 WAIT

        THREAD fffffadfe679cbf0  Cid 0ad8.06b0  Teb: 000007fffffd7000 Win32Thread: 0000000000000000 WAIT

        THREAD fffffadfe67d23d0  Cid 0ad8.0b74  Teb: 000007fffffd5000 Win32Thread: fffff97ff4b99010 WAIT
kd> !EEHeap -gc

Number of GC Heaps: 1

generation 0 starts at 0x0000000002a41030

generation 1 starts at 0x0000000002a41018

generation 2 starts at 0x0000000002a41000

ephemeral segment allocation context: (0x0000000002a8d528, 0x0000000002a8dfe8)

         segment            begin         allocated             size

00000000001a1260 0000064274e28f60  0000064274e5f610 0x00000000000366b0(222896)

00000000001a1070 000006427692ffe8  000006427695af20 0x000000000002af38(175928)

0000000000164f60 00000642787c7380  0000064278809150 0x0000000000041dd0(269776)

0000000002a40000 0000000002a41000  0000000002a8dfe8 0x000000000004cfe8(315368)

Large object heap starts at 0x0000000012a41000

         segment            begin         allocated             size

0000000012a40000 0000000012a41000  0000000012a4e738 0x000000000000d738(55096)

Total Size           0xfdad8(1039064)

------------------------------

GC Heap Size           0xfdad8(1039064)
kd> !gchandles

Bad MethodTable for Obj at 0000000002a7a7b8

Bad MethodTable for Obj at 0000000002a7a750

Bad MethodTable for Obj at 0000000002a445b0

GC Handle Statistics:

Strong Handles: 25

Pinned Handles: 7

Async Pinned Handles: 0

Ref Count Handles: 1

Weak Long Handles: 30

Weak Short Handles: 63

Other Handles: 0

Statistics:

              MT    Count    TotalSize Class Name

[...]

0000064280016580        1          464 WindowsApplication1.Form1

[…]
kd> !dumpmt -md 0000064280016580

EEClass: 0000064280143578

Module: 0000064280012e00

Name: WindowsApplication1.Form1

mdToken: 02000002  (C:\TestDefaultDebugger.NET.exe)

BaseSize: 0×1d0

ComponentSize: 0×0

Number of IFaces in IFaceMap: 15

Slots in VTable: 375

————————————–

MethodDesc Table

           Entry       MethodDesc      JIT Name

[…]

0000064280150208 00000642800164d0      JIT WindowsApplication1.Form1.InitializeComponent()

0000064280150210 00000642800164e0      JIT WindowsApplication1.Form1..ctor()

0000064280150218 00000642800164f0     NONE WindowsApplication1.Form1.button1_Click(System.Object, System.EventArgs)
kd> !dumpil 00000642800164f0

ilAddr = 00000000004021bc

IL_0000: newobj System.Collections.Stack::.ctor

IL_0005: stloc.0

IL_0006: ldloc.0

IL_0007: callvirt System.Collections.Stack::Pop

IL_000c: pop

IL_000d: ret
- Dmitry Vostokov @ DumpAnalysis.org -
Motivated by the following book title that I bought a month ago:
The Oxford Book of Modern Science Writing

I decided to convert my library into a beautifully illustrated color book called
The Opentask Guide to Modern Software Engineering Writing
I plan to update it yearly with new titles that come to my attention. The first edition is planned for this summer and has the following draft product details:
Draft table of contents and sample chapter will be posted soon.
- Dmitry Vostokov @ DumpAnalysis.org -
Mistake #1 - Not looking at full stack traces
By default WinDbg cuts off stack traces after 20th line and an analyst misses essential information when looking at Stack Trace or Stack Trace Collection. Consider this thread stack trace taken from a user process dump where runaway information was not saved but customers reported CPU spikes:
0:000> ~3kvL

ChildEBP RetAddr

0290f864 773976f2 user32!_SEH_prolog+0xb

0290f86c 0047f9ec user32!EnableMenuItem+0xf

0290f884 00488f6d Application!Close+0x142c

0290f8a4 0047a9c6 Application!EnableMenu+0x5d

0290f8b8 0048890d Application!EnableWindows+0x106

0290f8d0 0048cc2b Application!SetHourGlass+0xbd

0290f8fc 0046327a Application!WriteDataStream+0x24b

0290f924 0048d8f9 Application!WriteDataStream+0x21a

0290fa68 00479811 Application!WriteDataStream+0xcb9

0290fadc 5b5e976c Application!OnWrite+0x3c1

0290fb70 5b60e0b0 mfc71!CWnd::OnWndMsg+0x4f2

0290fb90 5b60e14f mfc71!CWnd::WindowProc+0x22

0290fbf0 5b60e1b8 mfc71!AfxCallWndProc+0x91

0290fc10 00516454 mfc71!AfxWndProc+0x46

0290fc3c 7739c3b7 Application!ExitCheck+0x28f34

0290fc68 7739c484 user32!InternalCallWinProc+0x28

0290fce0 77395563 user32!UserCallWinProcCheckWow+0x151

0290fd10 773ad03f user32!CallWindowProcAorW+0x98

0290fd30 0047a59a user32!CallWindowProcA+0x1b
We can see that it uses MFC libraries and window messaging API but was it caught accidentally? Is it a typical message loop like idle message loops in Passive Thread pattern using GetMessage or it is an active GUI message pump using PeekMessage? If we expand stack trace we would see that the thread is actually MFC GUI thread that spins according to MFC source code:
int CWinThread::Run()

{

  for (;;)

  {

    while (bIdle &&

      !::PeekMessage(&(pState->m_msgCur),

         NULL, NULL, NULL, PM_NOREMOVE))

     {
0:000> ~3kvL 100

ChildEBP RetAddr

0290f864 773976f2 user32!_SEH_prolog+0xb

0290f86c 0047f9ec user32!EnableMenuItem+0xf

0290f884 00488f6d Application!Close+0x142c

0290f8a4 0047a9c6 Application!EnableMenu+0x5d

0290f8b8 0048890d Application!EnableWindows+0x106

0290f8d0 0048cc2b Application!SetHourGlass+0xbd

0290f8fc 0046327a Application!WriteDataStream+0x24b

0290f924 0048d8f9 Application!WriteDataStream+0x21a

0290fa68 00479811 Application!WriteDataStream+0xcb9

0290fadc 5b5e976c Application!OnWrite+0x3c1

0290fb70 5b60e0b0 mfc71!CWnd::OnWndMsg+0x4f2

0290fb90 5b60e14f mfc71!CWnd::WindowProc+0x22

0290fbf0 5b60e1b8 mfc71!AfxCallWndProc+0x91

0290fc10 00516454 mfc71!AfxWndProc+0x46

0290fc3c 7739c3b7 Application!ExitCheck+0x28f34

0290fc68 7739c484 user32!InternalCallWinProc+0x28

0290fce0 77395563 user32!UserCallWinProcCheckWow+0x151

0290fd10 773ad03f user32!CallWindowProcAorW+0x98

0290fd30 0047a59a user32!CallWindowProcA+0x1b

0290fdb0 7739c3b7 Application!OnOK+0x77a

0290fddc 7739c484 user32!InternalCallWinProc+0x28

0290fe54 7739c73c user32!UserCallWinProcCheckWow+0x151

0290febc 7738e406 user32!DispatchMessageWorker+0x327

0290fecc 5b609076 user32!DispatchMessageA+0xf

0290fedc 5b60913e mfc71!AfxInternalPumpMessage+0x3e

0290fef8 004ba7cf mfc71!CWinThread::Run+0×54

0290ff04 5b61b30c Application!CMyThread::Run+0xf

0290ff84 5b869565 mfc71!_AfxThreadEntry+0×100

0290ffb8 77e66063 msvcr71!_endthreadex+0xa0

0290ffec 00000000 kernel32!BaseThreadStart+0×34
There is also WinDbg .kframes meta-command that can change default stack trace depth:
2: kd> .kframes 0n100

Default stack trace depth is 0n100 frames
- Dmitry Vostokov @ DumpAnalysis.org -
It now becomes a tradition to publish a sample chapter about heap. As promised here are two draft pages from the forthcoming Windows® Debugging Notebook:
05 (0×05): Heap / Pool / Paged / NonPaged
- Dmitry Vostokov @ DumpAnalysis.org -
01:00 am 24.05 I noticed it reached #1 bestseller status in Assembly Language Programming category:
| Books > Computers & Internet > Programming > Languages & Tools > Assembly Language Programming |
Because the status is updated hourly you might not see the same status when you read this post
- Dmitry Vostokov @ DumpAnalysis.org -
Recently being interested in forensic science and intelligence I decided to elaborate on memory analysis classification and came up with the following division:
- Memory Analysis Forensics
Answering questions related to a committed computer crime. The suspect may be a human or a software / hardware component. Incident response, troubleshooting and debugging belong to this category. Postmortem memory analysis is usually analysis of dump files saved and detached from the original system or operating conditions.
- Memory Analysis Intelligence
Monitoring memory state for behavioural and structural patterns to prevent certain events from occurring. Usually done in situ. However digital dumpster divers and spies may also collect and analyze memory data that was detached from the original computer system.
Each category can be further subdivided into:
– Functional Memory Analysis
Tracing of events.
Analysis of memory states and their evolution.
The latter can be subdivided into:
— Static Memory Analysis
Traditional memory dump analysis.
— Dynamic Memory Analysis
Live debugging.
- Dmitry Vostokov @ DumpAnalysis.org -
There is a bit of confusion around the division of exceptions between the first- and second-chance. For example, I am often asked whether saving crash dumps on first-chance exceptions should be disabled or enabled. So I decided to clarify this issue.
First, let me say that the concept of first-chance exceptions is purely a debugger-related. There is only one exception that happens when we access an invalid address, for example. However, that exception may be handled or may not be handled by exception handlers. Or it might be handled in peculiar way and terminate the thread that caused the exception, for example. And if it was not handled then an unhandled exception filter might be called. The default one might launch a postmortem debugger (or any process that can read process memory) to save a postmortem memory dump. Any thread can replace the default filter with a custom exception filter that might also do peculiar things and quietly terminate or exit. Even the properly configured postmortem debugger can fail to save a dump file. Therefore we have this question: how can we catch the exception and examine the process state as earlier as possible, before the execution flow goes through the exception handling mechanism?
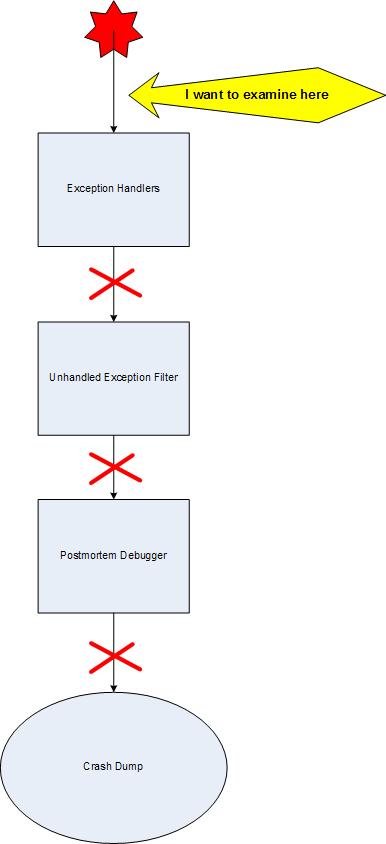
Here we have the concept of the first chance exception dispatched to the attached user-mode debugger. if it wasn’t handled we have the same exception but called the second chance that is dispatched to the same debugger again. We see that it has nothing to do with the postmortem debugger although the attached live debugger can save crash dump files too, which what ADPlus does, for example.
- Dmitry Vostokov @ DumpAnalysis.org -
In the article about memory dump analysis as forensic science CSI was proposed to mean “Crashed Server Investigation”. I’m interested in general forensic science as well and I’ve almost finished reading the book about the emergence of forensic science in 19th and 20th centuries:

As a result, yesterday I was rethinking CSI again and found these similar meanings:
- Crashed Software Investigation
- Crashed System Investigation
Any more suggestions? :-)
- Dmitry Vostokov @ DumpAnalysis.org -
The book has finally made it through Google Search program and is available for search here:
http://www.google.com/books?id=RR5whfK1BYsC
Also, yesterday I approved the hardcover version for distribution on Amazon and it should be available there in a week or so.
- Dmitry Vostokov @ DumpAnalysis.org -
Invalid Handle exception (0xC0000008) can frequently be seen in crash dumps. It results from an invalid handle value passed to CloseHandle and other Win32 API or when a handle or return status is checked manually for validity and the same exception is raised via RaiseException or internally via RtlRaiseStatus. Therefore it merits its own separate crash dump analysis pattern with the same name.
For example, critical sections are implemented using events and invalid event handle can result in this exception:
STACK_TEXT:

025bff00 7c94243c c0000008 7c9010ed 00231af0 ntdll!RtlRaiseStatus+0×26

025bff80 7c90104b 0015b4ac 77e76a6f 0015b4ac ntdll!RtlpWaitForCriticalSection+0×204

025bff88 77e76a6f 0015b4ac 010d2040 00000000 ntdll!RtlEnterCriticalSection+0×46

025bffa8 77e76c0a 0015b420 025bffec 7c80b683 rpcrt4!BaseCachedThreadRoutine+0xad

025bffb4 7c80b683 001feae8 010d2040 00000000 rpcrt4!ThreadStartRoutine+0×1a

025bffec 00000000 77e76bf0 001feae8 00000000 kernel32!BaseThreadStart+0×37
By default, unless raised manually, this exception doesn’t result in a default postmortem debugger called to save a crash dump. In order to do this we need to run the application under a debugger and save a crash dump upon this exception or use exception monitoring tools that save first-chance exceptions like Debug Diagnostics, ADPlus or Exception Monitor (see Early Crash Dump pattern):
0:002> g

(7b0.d1c): Invalid handle - code c0000008 (first chance)

First chance exceptions are reported before any exception handling.

This exception may be expected and handled.

eax=00000001 ebx=00000000 ecx=00000000 edx=00000000 esi=7d999906 edi=00403378

eip=7d61c92d esp=0012ff68 ebp=0012ff70 iopl=0 nv up ei pl nz na po nc

cs=0023 ss=002b ds=002b es=002b fs=0053 gs=002b efl=00000202

ntdll!NtClose+0×12:

7d61c92d c20400          ret     4
0:000> g

(7b0.d1c): Invalid handle - code c0000008 (!!! second chance !!!)

eax=00000001 ebx=00000000 ecx=00000000 edx=00000000 esi=7d999906 edi=00403378

eip=7d61c92d esp=0012ff68 ebp=0012ff70 iopl=0 nv up ei pl nz na po nc

cs=0023 ss=002b ds=002b es=002b fs=0053 gs=002b efl=00000202

ntdll!NtClose+0×12:

7d61c92d c20400          ret     4
In order to catch it using postmortem debuggers we can use Application Verifier and configure its basic checks to include invalid handles. Then we will have crash dumps if a postmortem debugger or WER is properly configured. The typical stack might look like this and pointing straight to the problem component:
EXCEPTION_RECORD:  ffffffff -- (.exr 0xffffffffffffffff)

ExceptionAddress: 6b006369

   ExceptionCode: 80000003 (Break instruction exception)

  ExceptionFlags: 00000000

NumberParameters: 1

   Parameter[0]: 00000000
DEFAULT_BUCKET_ID: STATUS_BREAKPOINT
0:000> kL

ChildEBP RetAddr

0301ff44 0489a480 ntdll!NtClose+0x12

WARNING: Stack unwind information not available. Following frames may be wrong.

0301ff54 7d4d8e4f vfbasics+0xa480

0301ff60 04894df9 kernel32!CloseHandle+0×59

0301ff70 00401022 vfbasics+0×4df9

0301ffc0 7d4e7d2a BadHandle+0×1022

0301fff0 00000000 kernel32!BaseProcessStart+0×28
or like this:
0:000> kL

Child-SP          RetAddr           Call Site

00000000`0012ed58 00000000`01f9395a ntdll!DbgBreakPoint

00000000`0012ed60 00000000`023e29a7 vrfcore!VerifierStopMessageEx+0×846

00000000`0012f090 00000000`023d9384 vfbasics+0×129a7

00000000`0012f0f0 00000000`77f251ec vfbasics+0×9384

00000000`0012f180 00000000`77ee5f36 ntdll!RtlpCallVectoredHandlers+0×26f

00000000`0012f210 00000000`77ee6812 ntdll!RtlDispatchException+0×46

00000000`0012f8c0 00000000`77ef325a ntdll!RtlRaiseException+0xae

00000000`0012fe00 00000000`77d6e314 ntdll!KiRaiseUserExceptionDispatcher+0×3a

00000000`0012fed0 00000001`40001028 kernel32!CloseHandle+0×5f

00000000`0012ff00 00000001`40001294 BadHandle+0×1028

00000000`0012ff30 00000000`77d5964c BadHandle+0×1294

00000000`0012ff80 00000000`00000000 kernel32!BaseProcessStart+0×29
vfbasics and vrfcore are Application Verifier DLLs that might translate an invalid handle exception to a breakpoint exception and therefore trigger the launch of a postmortem debugger from an unhandled exception filter. Application Verifier version (x64 or x86) must match the application platform (64-bit or 32-bit).
If invalid handle exception is raised manually we get the status code and possibly problem component immediately from !analyze command:
FAULTING_IP:

kernel32!RaiseException+53

7d4e2366 5e              pop     esi
EXCEPTION_RECORD:  ffffffff -- (.exr 0xffffffffffffffff)

ExceptionAddress: 7d4e2366 (kernel32!RaiseException+0x00000053)

   ExceptionCode: c0000008 (Invalid handle)

  ExceptionFlags: 00000000

NumberParameters: 0

Thread tried to close a handle that was invalid or illegal to close
DEFAULT_BUCKET_ID: STATUS_INVALID_HANDLE
PROCESS_NAME: BadHandle.exe
ERROR_CODE: (NTSTATUS) 0xc0000008 - An invalid HANDLE was specified.
STACK_TEXT:

0012ff64 00401043 c0000008 00000000 00000000 kernel32!RaiseException+0×53

WARNING: Stack unwind information not available. Following frames may be wrong.

0012ffc0 7d4e7d2a 00000000 00000000 7efde000 BadHandle+0×1043

0012fff0 00000000 004012f9 00000000 00000000 kernel32!BaseProcessStart+0×28
FAULTING_THREAD: 00000b64
PRIMARY_PROBLEM_CLASS: STATUS_INVALID_HANDLE
BUGCHECK_STR: APPLICATION_FAULT_STATUS_INVALID_HANDLE
Because we have WinDbg warning about stack unwind we can double check the disassembly of RaiseException return address:
0:000> ub 00401043

BadHandle+0×1029:

00401029 push    offset BadHandle+0×212c (0040212c)

0040102e push    0

00401030 call    esi

00401032 push    0

00401034 push    0

00401036 push    0

00401038 push    0C0000008h

0040103d call    dword ptr [BadHandle+0×2004 (00402004)]
0:000> dps 00402004 l1

00402004  7d4e2318 kernel32!RaiseException
Beware that in such cases the real problem might have been memory corruption overwriting stored valid handle values.
- Dmitry Vostokov @ DumpAnalysis.org -
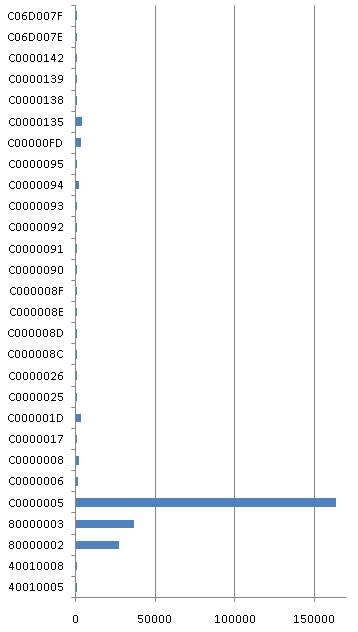
After Bug Check Frequencies post I was curious enough to do the same Google counting procedure for exceptions. Here are my results for exceptions listed in Visual C++ Debug \ Exceptions dialog:
|
Control-C |
40010005 |
43 |
|
Control-Break |
40010008 |
7 |
|
Datatype misalignment |
80000002 |
27300 |
|
Breakpoint |
80000003 |
36400 |
|
Access violation |
C0000005 |
164000 |
|
In page error |
C0000006 |
1210 |
|
Invalid handle |
C0000008 |
1670 |
|
Not enough quota |
C0000017 |
176 |
|
Illigal instruction |
C000001D |
3400 |
|
Cannot continue |
C0000025 |
804 |
|
Invalid exception disposition |
C0000026 |
121 |
|
Array bounds exceeded |
C000008C |
100 |
|
Floating-point denormal operand |
C000008D |
84 |
|
Floating-point division by zero |
C000008E |
523 |
|
Floating-point inexact result |
C000008F |
401 |
|
Floating-point invalid operation |
C0000090 |
509 |
|
Floating-point overflow |
C0000091 |
121 |
|
Floating-point stack check |
C0000092 |
102 |
|
Floating-point underflow |
C0000093 |
138 |
|
Integer division by zero |
C0000094 |
1610 |
|
Integer overflow |
C0000095 |
99 |
|
Stack overflow |
C00000FD |
3110 |
|
Unable to locate component |
C0000135 |
3970 |
|
Ordinal not found |
C0000138 |
43 |
|
Entry point not found |
C0000139 |
724 |
|
DLL initialization failed |
C0000142 |
918 |
|
Module not found |
C06D007E |
171 |
|
Procedure not found |
C06D007F |
248 |
The corresponding graph:
- Dmitry Vostokov @ DumpAnalysis.org -
Continuing Music for Debugging post I would like to recommend the following album that I used to listen to long time ago and have just found buried in the old corner. In it various movements correspond to different debugging sessions, some glorious and some filled with tension and worries, gradually building up the ultimate problem resolution. I think almost all Vangelis music is very suitable to accompany debugging.

- Dmitry Vostokov @ DumpAnalysis.org -
A small note from the field. Sometimes on x64 Windows platform we set a default postmortem debugger or configure WER and then install Microsoft Application Verifier to do some checks. However no crash dump files are saved. The reason for this might be that we installed and configured amd64 bit version of Application Verifier but the problem application was 32-bit. For this application we need to install and configure x86 version of Application Verifier.
- Dmitry Vostokov @ DumpAnalysis.org -
This is a new Xen book that I got in the post a few days ago and it seems to be so good that I took it home from work to start reading it during this weekend:
Running Xen: A Hands-On Guide to the Art of Virtualization

I’ll post a review once I read past the first chapter which is the excellent overview of different virtualization technologies.
See also another good Xen book that I discovered previously:
XEN from a system programmer’s perspective
- Dmitry Vostokov @ DumpAnalysis.org -


