Archive for the ‘Windows Server 2008’ Category
Sunday, April 18th, 2010
OpenTask to offer first 3 volumes of Memory Dump Analysis Anthology in one set:


The set is available exclusively from OpenTask e-Commerce web site starting from June. Individual volumes are also available from Amazon, Barnes & Noble and other bookstores worldwide.
Product information:
- Title: Modern Memory Dump and Software Trace Analysis: Volumes 1-3
- Author: Dmitry Vostokov
- Language: English
- Product Dimensions: 22.86 x 15.24
- Paperback: 1600 pages
- Publisher: Opentask (31 May 2010)
- ISBN-13: 978-1-906717-99-5
Information about individual volumes:
- Dmitry Vostokov @ DumpAnalysis.org + TraceAnalysis.org -
Posted in .NET Debugging, Aesthetics of Memory Dumps, Announcements, AntiPatterns, Art, Assembly Language, Books, Bugchecks Depicted, C and C++, CDA Pattern Classification, CDF Analysis Tips and Tricks, Categorical Debugging, Certification, Citrix, Code Reading, Common Mistakes, Computational Ghosts and Bug Hauntings, Computer Science, Countefactual Debugging, Crash Analysis Report Environment (CARE), Crash Dump Analysis, Crash Dump Patterns, Crash Dumps for Dummies, Data Recovery, DebugWare Patterns, Debugging, Debugging Methodology, Debugging Slang, Deep Down C++, Dictionary of Debugging, Dr. Watson, Education and Research, Escalation Engineering, Fun with Crash Dumps, Futuristic Memory Dump Analysis, GDB for WinDbg Users, Hardware, History, Horrors of Computation, Hyper-V, Intelligent Memory Movement, Kernel Development, Laws of Troubleshooting and Debugging, Mathematics of Debugging, Memiotics (Memory Semiotics), Memoidealism, Memoretics, Memory Analysis Culture, Memory Analysis Forensics and Intelligence, Memory Auralization, Memory Dump Analysis Jobs, Memory Religion (Memorianity), Memory Space Art, Memory Space Music, Memory Systems Language, Memory Visualization, Memuonics, Minidump Analysis, Multithreading, Music for Debugging, Music of Computation, New Acronyms, New Words, Occult Debugging, Philosophy, Psi-computation, Publishing, Science of Memory Dump Analysis, Science of Software Tracing, Security, Software Architecture, Software Defect Construction, Software Engineering, Software Generalist, Software Maintenance Institute, Software Narratology, Software Technical Support, Software Trace Analysis, Software Trace Visualization, Software Tracing for Dummies, Software Victimology, Stack Trace Collection, Testing, Tools, Trace Analysis Patterns, Training and Seminars, Troubleshooting Methodology, Victimware, Virtualization, Vista, Visual Dump Analysis, WinDbg Scripts, WinDbg Tips and Tricks, WinDbg for GDB Users, Windows 7, Windows Server 2008, Windows System Administration | No Comments »
Friday, April 9th, 2010
Plan to start providing training and seminars in my free time. If you are interested please answer these questions (you can either respond here in comments or use this form for private communication http://www.dumpanalysis.org/contact):
- Are you interested in on-site training, prefer traveling or attending webinars?
- Are you interested in software trace analysis as well?
- What specific topics are you interested in?
- What training level (beginner, intermediate, advanced) are you interested in? (please provide an example, if possible)
Additional topics of expertise that can be integrated into training include Source Code Reading and Analysis, Debugging, Windows Architecture, Device Drivers, Troubleshooting Tools Design and Implementation, Multithreading, Deep Down C and C++, x86 and x64 Assembly Language Reading.
Looking forward to your responses. Any suggestions are welcome.
- Dmitry Vostokov @ DumpAnalysis.org + TraceAnalysis.org -
Posted in .NET Debugging, Announcements, AntiPatterns, Assembly Language, Bugchecks Depicted, C and C++, CDA Pattern Classification, CDF Analysis Tips and Tricks, Certification, Code Reading, Common Mistakes, Crash Analysis Report Environment (CARE), Crash Dump Analysis, Crash Dump Patterns, Crash Dumps for Dummies, Data Recovery, DebugWare Patterns, Debugging, Debugging Methodology, Deep Down C++, Education and Research, Escalation Engineering, FreeBSD Crash Corner, GDB for WinDbg Users, Hardware, Hyper-V, Java Debugging, Kernel Development, Laws of Troubleshooting and Debugging, Linux Crash Corner, Mac Crash Corner, Memory Analysis Forensics and Intelligence, Memory Visualization, Minidump Analysis, Multithreading, Security, Software Architecture, Software Defect Construction, Software Engineering, Software Generalist, Software Maintenance Institute, Software Narratology, Software Technical Support, Software Trace Analysis, Software Trace Visualization, Software Tracing for Dummies, Software Victimology, Stack Trace Collection, Testing, Tools, Trace Analysis Patterns, Training and Seminars, Troubleshooting Methodology, Victimware, Virtualization, Vista, Visual Dump Analysis, WinDbg Scripts, WinDbg Tips and Tricks, WinDbg for GDB Users, Windows 7, Windows Server 2008, Windows System Administration, Workaround Patterns | No Comments »
Monday, April 5th, 2010
I’m very pleased to announce that the Korean edition is available:

The book can be found on:
- Dmitry Vostokov @ DumpAnalysis.org + TraceAnalysis.org -
Posted in Announcements, AntiPatterns, Assembly Language, Books, Books (Korean), C and C++, Computer Science, Crash Dump Analysis, Crash Dump Patterns, Crash Dumps for Dummies, Debugging, Dr. Watson, Escalation Engineering, Fun with Crash Dumps, GDB for WinDbg Users, Hardware, Kernel Development, Mathematics of Debugging, Memiotics (Memory Semiotics), Memoretics, Memory Space Music, Memory Visualization, Minidump Analysis, Multithreading, Publishing, Science of Memory Dump Analysis, Security, Software Architecture, Software Engineering, Software Technical Support, Testing, Tools, Troubleshooting Methodology, Virtualization, Vista, WinDbg Scripts, WinDbg Tips and Tricks, WinDbg for GDB Users, Windows Server 2008, Windows System Administration | No Comments »
Monday, February 22nd, 2010
As soon as I dug out the 3rd edition of this book to download samples for my internal projects I found that the new edition was published this month! I read all of them and now ordering the 4th edition:
Windows System Programming (4th Edition)
Actually I re-read the 2nd edition of Johnson M. Hart’s book when looking for a job in 2003 and coupled with timely reading of John Robbings’ book Debugging Applications (1st 2000 edition) secured my landing in Dublin East Point Business Park.
This book is an essential reading for Windows memory dump analysts, software maintenance and escalation engineers, software defect researchers and software tool developers. It lucidly describes and succinctly illustrates user-land Windows API with practical console mode samples in plain C. This book is especially valuable for software engineers coming from UNIX background because the author draws various parallels and provides maps between UNIX / Pthreads and Win32 / 64 APIs. Highly recommended! Plan to post an Amazon review when I get the copy of the 4th edition.
- Dmitry Vostokov @ DumpAnalysis.org + TraceAnalysis.org -
Posted in Books, C and C++, Citrix, Code Reading, Debugging, History, Tools, Vista, Windows 7, Windows Server 2008 | No Comments »
Thursday, February 11th, 2010
This is a revised, edited, cross-referenced and thematically organized volume of selected DumpAnalysis.org blog posts about crash dump analysis and debugging written in July 2009 - January 2010 for software engineers developing and maintaining products on Windows platforms, quality assurance engineers testing software on Windows platforms and technical support and escalation engineers dealing with complex software issues. The fourth volume features:
- 13 new crash dump analysis patterns
- 13 new pattern interaction case studies
- 10 new trace analysis patterns
- 6 new Debugware patterns and case study
- Workaround patterns
- Updated checklist
- Fully cross-referenced with Volume 1, Volume 2 and Volume 3
- New appendixes
Product information:
- Title: Memory Dump Analysis Anthology, Volume 4
- Author: Dmitry Vostokov
- Language: English
- Product Dimensions: 22.86 x 15.24
- Paperback: 410 pages
- Publisher: Opentask (30 March 2010)
- ISBN-13: 978-1-906717-86-5
- Hardcover: 410 pages
- Publisher: Opentask (30 April 2010)
- ISBN-13: 978-1-906717-87-2

Back cover features memory space art image: Internal Process Combustion.
- Dmitry Vostokov @ DumpAnalysis.org + TraceAnalysis.org -
Posted in .NET Debugging, Aesthetics of Memory Dumps, Announcements, AntiPatterns, Art, Assembly Language, Books, C and C++, CDA Pattern Classification, CDF Analysis Tips and Tricks, Categorical Debugging, Certification, Citrix, Code Reading, Common Mistakes, Computer Science, Countefactual Debugging, Crash Analysis Report Environment (CARE), Crash Dump Analysis, Crash Dump Patterns, Crash Dumps for Dummies, DebugWare Patterns, Debugging, Debugging Slang, Education and Research, Escalation Engineering, Fun with Crash Dumps, Games for Debugging, Hardware, Horrors of Computation, Hyper-V, Kernel Development, Laws of Troubleshooting and Debugging, Mathematics of Debugging, Memiotics (Memory Semiotics), Memoidealism, Memoretics, Memory Analysis Culture, Memory Analysis Forensics and Intelligence, Memory Dreams, Memory Dump Analysis Jobs, Memory Dumps in Movies, Memory Space Art, Memory Visualization, Memuonics, Minidump Analysis, Multithreading, Music for Debugging, New Acronyms, New Words, Opcodism, Philosophy, Physicalist Art, Publishing, Science Fiction, Science of Memory Dump Analysis, Science of Software Tracing, Security, Software Architecture, Software Defect Construction, Software Engineering, Software Generalist, Software Maintenance Institute, Software Narratology, Software Technical Support, Software Trace Analysis, Software Trace Visualization, Software Tracing for Dummies, Software Victimology, Stack Trace Collection, Testing, Tools, Trace Analysis Patterns, Training and Seminars, Troubleshooting Methodology, Victimware, Virtualization, Vista, Visual Dump Analysis, WinDbg Scripts, WinDbg Tips and Tricks, WinDbg for GDB Users, Windows 7, Windows Server 2008, Windows System Administration, Workaround Patterns | No Comments »
Friday, January 8th, 2010
After the installation of a DVD-ROM software coming from Longman Dictionary of Contemporary English for Advanced Learners I tried to launch it and my x64 system was totally frozen. I couldn’t even generate a complete memory dump via a keyboard (during troubleshooting I also discovered that I needed to manually set CrashDumpEnabled value under HKLM \ S \ CCS \ C \ CrashControl to 1 in order to enable complete memory dumps on my W2K8 system and on the next day the arrived 16.4 issue of NT Insider explained me why it was so). Scheduling NotMyFault tool to run 1 minute later after the freeze didn’t help either. So I dug out a dusty null-modem cable and connected it to my freezing W2K8 box (target) and x64 W2K3 box (host). The kernel debugger was already enabled on the problem computer because I used to frequently do local kernel debugging: memory inspection while reading Windows Internals book. The target computer showed satisfactory boot parameters:
C:\Users\Administrator>BCDEdit /dbgsettings

debugtype               Serial

debugport               1

baudrate                115200
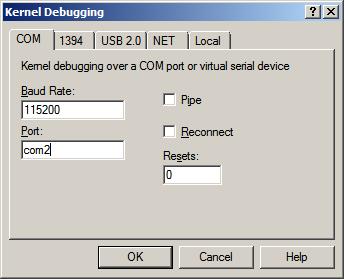
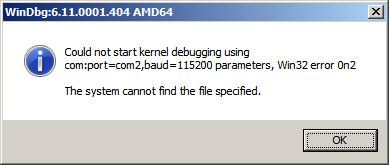
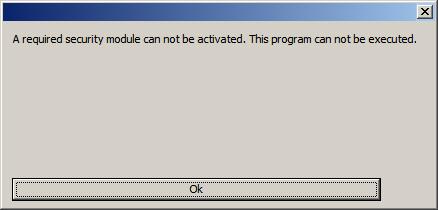
So I launched x64 WinDbg on the host and tried to connect to COM2 but got an error message:
Then I tried to connect to COM1 and it was a success (attaching a cable to two COM ports is like a flip coin game):
Microsoft (R) Windows Debugger Version 6.10.0003.233 AMD64

Copyright (c) Microsoft Corporation. All rights reserved.
Opened \\.\com1

Waiting to reconnect...
When I launched the English dictionary the target system became frozen but on the host system WinDbg became connected:
Connected to Windows 7 6002 x64 target at (Wed Jan  6 20:28:57.734 2010 (GMT+0)), ptr64 TRUE

Kernel Debugger connection established.

Symbol search path is: SRV*c:\websymbols*http://msdl.microsoft.com/download/symbols

Windows 7 Kernel Version 6002 (Service Pack 2) MP (2 procs) Free x64

Product: Server, suite: Enterprise TerminalServer SingleUserTS

Built by: 6002.18082.amd64fre.vistasp2_gdr.090803-2339

Kernel base = 0xfffff800`01813000 PsLoadedModuleList = 0xfffff800`019d7dd0

Debug session time: Wed Jan  6 20:33:41.584 2010 (GMT+0)

System Uptime: 0 days 0:30:50.694

Break instruction exception - code 80000003 (first chance)
* You are seeing this message because you pressed the SysRq/PrintScreen key on your test machine's keyboard.

*

* THIS IS NOT A BUG OR A SYSTEM CRASH

*

* If you did not intend to break into the debugger, press the "g" key, then press the "Enter" key now.  This message might immediately reappear.  If it does, press "g" and "Enter" again.
nt!RtlpBreakWithStatusInstruction:

fffff800`018676f0 cc              int     3
0: kd> g

The context is partially valid. Only x86 user-mode context is available.

WOW64 single step exception - code 4000001e (first chance)

First chance exceptions are reported before any exception handling.

This exception may be expected and handled.

00000000`006661d8 812f00500000    sub     dword ptr [edi],5000h
32.1: kd:x86> !analyze -v

Connected to Windows 7 6002 x64 target at (Wed Jan  6 20:40:16.359 2010 (GMT+0)), ptr64 TRUE
FAULTING_IP:

ldoce5+2661d8

00000000`006661d8 812f00500000    sub     dword ptr [edi],5000h
EXCEPTION_RECORD:  ffffffffffffffff -- (.exr 0xffffffffffffffff)

ExceptionAddress: 00000000006661d8 (ldoce5+0x00000000002661d8)

   ExceptionCode: 4000001e (WOW64 single step exception)

  ExceptionFlags: 00000000

NumberParameters: 0
BUGCHECK_STR: 4000001e
DEFAULT_BUCKET_ID: APPLICATION_FAULT
ERROR_CODE: (NTSTATUS) 0x4000001e - Exception status code used by Win32 x86 emulation subsystem.
EXCEPTION_CODE: (Win32) 0x4000001e (1073741854) - <Unable to get error code text>
NTGLOBALFLAG: 400
FAULTING_THREAD: 0000000000000002
LAST_CONTROL_TRANSFER: from 0000000000000000 to 00000000006661d8
STACK_TEXT:

00000000 00000000 00000000 00000000 00000000 ldoce5+0x2661d8
STACK_COMMAND: kb
FOLLOWUP_IP:

ldoce5+2661d8

00000000`006661d8 812f00500000    sub     dword ptr [edi],5000h
SYMBOL_STACK_INDEX: 0
SYMBOL_NAME: ldoce5+2661d8
FOLLOWUP_NAME: MachineOwner
MODULE_NAME: ldoce5
IMAGE_NAME: ldoce5.exe
DEBUG_FLR_IMAGE_TIMESTAMP: 48b86455
BUCKET_ID: X64_4000001e_ldoce5+2661d8
PRIMARY_PROBLEM_CLASS: APPLICATION_FAULT
FAILURE_BUCKET_ID: APPLICATION_FAULT_4000001e_ldoce5.exe!Unknown
Followup: MachineOwner

---------
Unfortunately, I wasn’t able to resume the system after the first chance exception:
32.1: kd:x86> g

The context is partially valid. Only x86 user-mode context is available.

WOW64 single step exception - code 4000001e (first chance)

First chance exceptions are reported before any exception handling.

This exception may be expected and handled.

ldoce5+0x2661d8:

00000000`006661d8 812f00500000    sub     dword ptr [edi],5000h
Even the usual trick of sxd or sxi commands didn’t help either (probably because of single-step mode). The 32-bit raw stack had this fragment of exception processing residue:
00000000`0136ae8c  0136af74

00000000`0136ae90  00000001

00000000`0136ae94  0136af0c

00000000`0136ae98  77b12062 ntdll_77ad0000!RtlDispatchException+0x1b2

00000000`0136ae9c  0136af24

00000000`0136aea0  0136af74

00000000`0136aea4  00000000

00000000`0136aea8  00000000

00000000`0136aeac  00000000

00000000`0136aeb0  00000000

00000000`0136aeb4  00000000

00000000`0136aeb8  00000000

00000000`0136aebc  00000000

00000000`0136aec0  00000000

00000000`0136aec4  00000000

00000000`0136aec8  00000000

00000000`0136aecc  00000000

00000000`0136aed0  00000000

00000000`0136aed4  00000000

00000000`0136aed8  00000000

00000000`0136aedc  00000000

00000000`0136aee0  00000000

00000000`0136aee4  00000000

00000000`0136aee8  00000000

00000000`0136aeec  00000000

00000000`0136aef0  00000000

00000000`0136aef4  00000000

00000000`0136aef8  00000000

00000000`0136aefc  00000000

00000000`0136af00  01380000

00000000`0136af04  01361000

00000000`0136af08  01000000

00000000`0136af0c  0136b254

00000000`0136af10  77aee49f ntdll_77ad0000!KiUserExceptionDispatcher+0xf

00000000`0136af14  77b197ba ntdll_77ad0000!ZwContinue+0×12

00000000`0136af18  77aee4ad ntdll_77ad0000!KiUserExceptionDispatcher+0×1d

00000000`0136af1c  0136af74

00000000`0136af20  00000000

00000000`0136af24  c000001d

00000000`0136af28  00000000

00000000`0136af2c  00000000

00000000`0136af30  006661af ldoce5+0×2661af

00000000`0136af34  00000000

00000000`0136af38  00000000

00000000`0136af3c  00000000
The exception code c000001d is about illegal instruction:
32.1: kd:x86> !error c000001d

Error code: (NTSTATUS) 0xc000001d (3221225501) - {EXCEPTION}  Illegal Instruction  An attempt was made to execute an illegal instruction.
The following stack trace corresponded to the exception record:
32.1: kd:x86> .cxr 0136af74

eax=007fc400 ebx=00e1c000 ecx=00b64230 edx=00000400 esi=00000000 edi=00bc2784

eip=006661b1 esp=0136b240 ebp=0136b254 iopl=0 nv up ei pl nz na po nc

cs=0023 ss=002b ds=002b es=002b fs=0053 gs=002b efl=00010202

ldoce5+0x2661b1:

00000000`006661b1 eb07       jmp     ldoce5+0x2661ba (006661ba)
32.1: kd:x86> kv

  *** Stack trace for last set context - .thread/.cxr resets it

ChildEBP          RetAddr           Args to Child

WARNING: Stack unwind information not available. Following frames may be wrong.

0136b254 00529002 00cf43b8 00000001 00e1c000 ldoce5+0x2661b1

0136b2a8 0055d184 00000000 00000000 00000000 ldoce5+0x129002

0137f930 77b02c91 76ac4de8 00000000 77b02ae8 ldoce5+0x15d184

0137fe3c 00dbf2d0 00b52dd0 7efde000 00bb9168 ntdll_77ad0000!LdrGetDllHandleEx+0x34c

0137feac 0096eeb5 00000001 036a1498 036a14e0 ldoce5+0x9bf2d0

0137ff94 77b4d24d 7efde000 76ac4ba4 00000000 ldoce5+0x56eeb5

0137ffd4 77b4d45f 00b56c80 7efde000 ffffffff ntdll_77ad0000!__RtlUserThreadStart+0x23

0137ffec 00000000 00b56c80 7efde000 00000000 ntdll_77ad0000!_RtlUserThreadStart+0x1b
Then suddenly a lightning bolt stroke my head! Complete system freeze… May be enabled kernel debugger on the target system was activated when I was launching the English dictionary? The system was then waiting for a debugger to connect… So I rebooted the target:
32.1: kd:x86> .reboot

Shutdown occurred at (Wed Jan  6 22:26:47.828 2010 (GMT+0))...unloading all symbol tables.

Waiting to reconnect...
and quickly disabled debug mode:
C:\Users\Administrator>BCDEdit /debug OFF

The operation completed successfully.
After that I was able to launch the English dictionary! My first hypothesis was that the process somehow generated an exception in WOW64 that triggered the kernel debugger. The belief was reinforced when I attached WinDbg to a running process instance and saw the continuous stream of exceptions:
(11c0.bc4): Unknown exception - code 0eedfade (first chance)

(11c0.bc4): Unknown exception - code 0eedfade (first chance)

(11c0.bc4): Unknown exception - code 0eedfade (first chance)

(11c0.bc4): Unknown exception - code 0eedfade (first chance)

(11c0.bc4): Unknown exception - code 0eedfade (first chance)

(11c0.bc4): Unknown exception - code 0eedfade (first chance)

(11c0.bc4): Unknown exception - code 0eedfade (first chance)

(11c0.bc4): Unknown exception - code 0eedfade (first chance)

(11c0.bc4): Unknown exception - code 0eedfade (first chance)

(11c0.bc4): Unknown exception - code 0eedfade (first chance)

(11c0.bc4): Unknown exception - code 0eedfade (first chance)

(11c0.bc4): Unknown exception - code 0eedfade (first chance)

(11c0.bc4): Unknown exception - code 0eedfade (first chance)

(11c0.bc4): Unknown exception - code 0eedfade (first chance)
However, to my surprise, when I restarted the process, the following DRM dialog appeared:
CommandLine: "C:\Program Files (x86)\Longman\LDOCE5\ldoce5.exe"

Executable search path is:

ModLoad: 00000000`00400000 00000000`00e7c000   image00000000`00400000

ModLoad: 00000000`77980000 00000000`77b06000   ntdll.dll

ModLoad: 00000000`77b40000 00000000`77ca0000   ntdll32.dll

ModLoad: 00000000`75ab0000 00000000`75af5000   C:\Windows\system32\wow64.dll

ModLoad: 00000000`75a60000 00000000`75aae000   C:\Windows\system32\wow64win.dll

ModLoad: 00000000`759b0000 00000000`759b9000   C:\Windows\system32\wow64cpu.dll

(1364.da8): Break instruction exception - code 80000003 (first chance)

ntdll!DbgBreakPoint:

00000000`779c6060 cc              int     3
0:000> g

ModLoad: 00000000`77850000 00000000`7797d000   WOW64_IMAGE_SECTION

ModLoad: 00000000`77670000 00000000`77780000   WOW64_IMAGE_SECTION

ModLoad: 00000000`77850000 00000000`7797d000   NOT_AN_IMAGE

ModLoad: 00000000`77780000 00000000`7784d000   NOT_AN_IMAGE

ModLoad: 00000000`77670000 00000000`77780000   C:\Windows\syswow64\kernel32.dll

ModLoad: 00000000`30000000 00000000`30027000   C:\Program Files (x86)\Longman\LDOCE5\nspr4.dll

ModLoad: 00000000`768a0000 00000000`76966000   C:\Windows\syswow64\ADVAPI32.dll

ModLoad: 00000000`75da0000 00000000`75e90000   C:\Windows\syswow64\RPCRT4.dll

ModLoad: 00000000`75b10000 00000000`75b70000   C:\Windows\syswow64\Secur32.dll

ModLoad: 00000000`72ee0000 00000000`72ee7000   C:\Windows\SysWOW64\WSOCK32.dll

ModLoad: 00000000`75c60000 00000000`75c8d000   C:\Windows\syswow64\WS2_32.dll

ModLoad: 00000000`76140000 00000000`761ea000   C:\Windows\syswow64\msvcrt.dll

ModLoad: 00000000`767c0000 00000000`767c6000   C:\Windows\syswow64\NSI.dll

ModLoad: 00000000`75180000 00000000`751b2000   C:\Windows\SysWOW64\WINMM.dll

ModLoad: 00000000`775a0000 00000000`77670000   C:\Windows\syswow64\USER32.dll

ModLoad: 00000000`76970000 00000000`76a00000   C:\Windows\syswow64\GDI32.dll

ModLoad: 00000000`76200000 00000000`76345000   C:\Windows\syswow64\ole32.dll

ModLoad: 00000000`75d10000 00000000`75d9d000   C:\Windows\syswow64\OLEAUT32.dll

ModLoad: 00000000`74eb0000 00000000`74ee9000   C:\Windows\SysWOW64\OLEACC.dll

ModLoad: 00000000`00020000 00000000`00027000   C:\Program Files (x86)\Longman\LDOCE5\plc4.dll

ModLoad: 00000000`76a00000 00000000`77510000   C:\Windows\syswow64\SHELL32.dll

ModLoad: 00000000`76360000 00000000`763b9000   C:\Windows\syswow64\SHLWAPI.dll

ModLoad: 00000000`759a0000 00000000`759a8000   C:\Windows\SysWOW64\VERSION.dll

(1364.da8): WOW64 breakpoint - code 4000001f (first chance)

First chance exceptions are reported before any exception handling.

This exception may be expected and handled.

ntdll32!DbgBreakPoint:

77b50004 cc              int     3
0:000:x86> g

ModLoad: 766e0000 76740000   C:\Windows\SysWOW64\IMM32.DLL

ModLoad: 767d0000 76898000   C:\Windows\syswow64\MSCTF.dll

ModLoad: 76350000 76359000   C:\Windows\syswow64\LPK.DLL

ModLoad: 75c90000 75d0d000   C:\Windows\syswow64\USP10.dll

ModLoad: 755f0000 7578e000   C:\Windows\WinSxS\x86_microsoft.windows.common-controls_[ ... ]_6.0.6002.18005_none_[ ... ]\ comctl32.dll

ModLoad: 73b20000 73b39000   C:\Windows\SysWOW64\IPHLPAPI.dll

ModLoad: 73ae0000 73b15000   C:\Windows\SysWOW64\dhcpcsvc.DLL

ModLoad: 73ab0000 73adc000   C:\Windows\SysWOW64\DNSAPI.dll

ModLoad: 73aa0000 73aa7000   C:\Windows\SysWOW64\WINNSI.DLL

ModLoad: 73a70000 73a92000   C:\Windows\SysWOW64\dhcpcsvc6.DLL

ModLoad: 761f0000 761f7000   C:\Windows\syswow64\psapi.dll

ModLoad: 00000000`70860000 00000000`708d4000   C:\Windows\SysWOW64\Riched20.dll

ModLoad: 00000000`10000000 00000000`10011000   C:\Users\ADMINI~1\AppData\Local\Temp\drm_dialogs.dll

ModLoad: 00000000`73810000 00000000`73890000   C:\Windows\SysWOW64\UxTheme.dll
So I had to quit my debugger in order not to interfere with the all mighty Mr. DRM and possible anti-debugging techniques. At least the problem was found and resolved. I was able to use the English dictionary I purchased from Amazon UK (*).
Note: additional purchasing info is recommended to add to discource when discussing DRM issues.
- Dmitry Vostokov @ DumpAnalysis.org -
Posted in Debugging, Live Debugging, Windows Server 2008 | 3 Comments »
Sunday, December 20th, 2009
“Memory dumps are facts.”
I’m very excited to announce that Volume 3 is available in paperback, hardcover and digital editions:
Memory Dump Analysis Anthology, Volume 3
Table of Contents
In two weeks paperback edition should also appear on Amazon and other bookstores. Amazon hardcover edition is planned to be available in January 2010.
The amount of information was so voluminous that I had to split the originally planned volume into two. Volume 4 should appear by the middle of February together with Color Supplement for Volumes 1-4.
- Dmitry Vostokov @ DumpAnalysis.org -
Posted in .NET Debugging, Aesthetics of Memory Dumps, Announcements, AntiPatterns, Art, Assembly Language, Books, Bugtations, C and C++, CDA Pattern Classification, CDF Analysis Tips and Tricks, Certification, Citrix, Code Reading, Common Mistakes, Computer Science, Crash Dump Analysis, Crash Dump Patterns, Crash Dumps for Dummies, DebugWare Patterns, Debugging, Debugging Slang, Deep Down C++, Education and Research, Escalation Engineering, Fun with Crash Dumps, Hardware, Horrors of Computation, Kernel Development, Mathematics of Debugging, Memiotics (Memory Semiotics), Memoidealism, Memoretics, Memory Analysis Culture, Memory Analysis Forensics and Intelligence, Memory Space Art, Memory Visualization, Minidump Analysis, Multithreading, Philosophy, Poetry, Publishing, Science of Memory Dump Analysis, Science of Software Tracing, Security, Software Architecture, Software Defect Construction, Software Engineering, Software Narratology, Software Technical Support, Software Trace Analysis, Software Trace Visualization, Software Tracing for Dummies, Software Victimology, Stack Trace Collection, Testing, Tools, Trace Analysis Patterns, Training and Seminars, Troubleshooting Methodology, Victimware, Virtualization, Vista, Visual Dump Analysis, WinDbg Scripts, WinDbg Tips and Tricks, WinDbg for GDB Users, Windows 7, Windows Server 2008, Windows System Administration | 1 Comment »
Saturday, September 26th, 2009
This is a revised, edited, cross-referenced and thematically organized volume of selected DumpAnalysis.org blog posts about crash dump analysis and debugging written in October 2008 - June 2009 for software engineers developing and maintaining products on Windows platforms, quality assurance engineers testing software on Windows platforms and technical support and escalation engineers dealing with complex software issues. The third volume features:
- 15 new crash dump analysis patterns
- 29 new pattern interaction case studies
- Trace analysis patterns
- Updated checklist
- Fully cross-referenced with Volume 1 and Volume 2
- New appendixes
Product information:
- Title: Memory Dump Analysis Anthology, Volume 3
- Author: Dmitry Vostokov
- Language: English
- Product Dimensions: 22.86 x 15.24
- Paperback: 404 pages
- Publisher: Opentask (20 December 2009)
- ISBN-13: 978-1-906717-43-8
- Hardcover: 404 pages
- Publisher: Opentask (30 January 2010)
- ISBN-13: 978-1-906717-44-5

Back cover features 3D computer memory visualization image.
- Dmitry Vostokov @ DumpAnalysis.org -
Posted in Announcements, AntiPatterns, Art, Assembly Language, Books, C and C++, CDF Analysis Tips and Tricks, Certification, Citrix, Code Reading, Common Mistakes, Computational Ghosts and Bug Hauntings, Computer Science, Countefactual Debugging, Crash Dump Analysis, Crash Dump Patterns, Crash Dumps for Dummies, DebugWare Patterns, Debugging, Debugging Slang, Deep Down C++, Education and Research, Escalation Engineering, Fun with Crash Dumps, Futuristic Memory Dump Analysis, Games for Debugging, Hardware, Horrors of Computation, Hyper-V, Intelligent Memory Movement, Kernel Development, Mathematics of Debugging, Memiotics (Memory Semiotics), Memoidealism, Memoretics, Memory Analysis Culture, Memory Analysis Forensics and Intelligence, Memory Dreams, Memory Dump Analysis Jobs, Memory Space Music, Memory Visualization, Memuonics, Minidump Analysis, Multithreading, Music for Debugging, New Acronyms, New Words, Occult Debugging, Philosophy, Poetry, Psi-computation, Publishing, Science of Memory Dump Analysis, Science of Software Tracing, Security, Software Architecture, Software Defect Construction, Software Engineering, Software Generalist, Software Narratology, Software Technical Support, Software Trace Analysis, Software Tracing for Dummies, Testing, Tools, Trace Analysis Patterns, Training and Seminars, Troubleshooting Methodology, Virtualization, Vista, Visual Dump Analysis, WinDbg Scripts, WinDbg Tips and Tricks, WinDbg for GDB Users, Windows 7, Windows Server 2008, Windows System Administration | No Comments »
Saturday, September 26th, 2009
DumpAnalysis.org accepts hardware such as laptops for reviewing in relation to their suitability for extreme debugging, virtualization, trace analysis, computer forensics, memory dump analysis, visualization and auralization. If you work for a H/W company like HP, Apple, Dell, Acer, Sony or any other respectable manufacturer please don’t hesitate to forward this post to your management: it could be your company brand or laptop model that debugging and software technical support community chooses next time of upgrade or for T&D / R&D! H/W reviews will be posted on the main portal page which currently has an audience of more than 200,000 unique visitors per year from more than 30,000 network locations (*).
If your company is interested please don’t hesitate to use this contact form:
http://www.dumpanalysis.org/contact
(*) From Google Analytics report.
- Dmitry Vostokov @ DumpAnalysis.org -
Posted in Announcements, Crash Dump Analysis, Debugging, Hardware, Memory Analysis Forensics and Intelligence, Memory Auralization, Memory Visualization, Security, Software Engineering, Software Technical Support, Software Trace Analysis, Testing, Tools, Virtualization, Vista, Visual Dump Analysis, Windows 7, Windows Server 2008, Windows System Administration | No Comments »
Saturday, August 8th, 2009
The digital version of the book is finally available:
x64 Windows Debugging: Practical Foundations
Paperback should be available in 1-2 weeks on Amazon and other stores. When working on the book I fixed errors in the previous x86 version. Errata file for it should be available tomorrow.
- Dmitry Vostokov @ DumpAnalysis.org -
Posted in Announcements, Assembly Language, Books, C and C++, Certification, Code Reading, Crash Dump Analysis, Debugging, Education and Research, Memory Dump Analysis Jobs, Publishing, Security, Software Engineering, Software Technical Support, Testing, Tools, Training and Seminars, Vista, Windows 7, Windows Server 2008 | No Comments »
Tuesday, July 28th, 2009
Here is another addition to identification of memory dumps coming from VMWare, VirtualPC and Xen Server virtualized Windows systems. Now I had a look at Windows Server 2008 Hyper-V host system running Windows Server 2008 as a guest and found that this information could serve as an identification if infrastructure components were installed:
kd> lm

[...]

fffffa60`00cc2000 fffffa60`00cd7000   winhv       (deferred)

fffff960`00810000 fffff960`0081b000   VMBusVideoD (deferred)

fffffa60`00c7e000 fffffa60`00cc2000   vmbus       (deferred)

fffffa60`00df6000 fffffa60`00dfbb00   VMBusHID    (deferred)

fffffa60`0201c000 fffffa60`02028000   VMBusVideoM (deferred)

[...]
winhv driver has lots of exported hypervisor related functions:
kd> x winhv!*

*** ERROR: Symbol file could not be found.  Defaulted to export symbols for winhv.sys -

fffffa60`00cc3100 winhv!WinHvGetCurrentVpIndex (<no parameter info>)

fffffa60`00cc3160 winhv!WinHvSetSintOnCurrentProcessor (<no parameter info>)

fffffa60`00cc3230 winhv!WinHvNtProcessorToVpIndex (<no parameter info>)

fffffa60`00cc3260 winhv!WinHvDisconnectPort (<no parameter info>)

fffffa60`00cc32e0 winhv!WinHvDeletePort (<no parameter info>)

fffffa60`00cc35c0 winhv!WinHvMapGpaPages (<no parameter info>)

fffffa60`00cc36e0 winhv!WinHvSetVpRegisters (<no parameter info>)

fffffa60`00cc3e20 winhv!WinHvGetVpRegisters (<no parameter info>)

fffffa60`00cc3ed0 winhv!WinHvLowMemoryPolicyAutoDeposit (<no parameter info>)

fffffa60`00cc4110 winhv!WinHvSetPartitionProperty (<no parameter info>)

fffffa60`00cc4250 winhv!WinHvGetPartitionProperty (<no parameter info>)

fffffa60`00cc4290 winhv!WinHvPostMessage (<no parameter info>)

fffffa60`00cc4320 winhv!WinHvCreatePort (<no parameter info>)

fffffa60`00cc4380 winhv!WinHvConnectPort (<no parameter info>)

fffffa60`00cc43e0 winhv!WinHvCreateVp (<no parameter info>)

fffffa60`00cc4430 winhv!WinHvMapEventLogBuffer (<no parameter info>)

fffffa60`00cc44d0 winhv!WinHvCreateEventLogBuffer (<no parameter info>)

fffffa60`00cc4580 winhv!WinHvGetPartitionId (<no parameter info>)

fffffa60`00cc45d0 winhv!WinHvWithdrawAllMemory (<no parameter info>)

fffffa60`00cc4600 winhv!WinHvReleaseEventLogBuffer (<no parameter info>)

fffffa60`00cc4630 winhv!WinHvCreatePartition (<no parameter info>)

fffffa60`00cc49d0 winhv!WinHvDeletePartition (<no parameter info>)

fffffa60`00cc4f50 winhv!WinHvUnmapGpaPages (<no parameter info>)

fffffa60`00cc5150 winhv!WinHvInstallIntercept (<no parameter info>)

fffffa60`00cc5240 winhv!WinHvInitializeEventLogBufferGroup (<no parameter info>)

fffffa60`00cc52c0 winhv!WinHvDeleteVp (<no parameter info>)

fffffa60`00cc5340 winhv!WinHvGetPortProperty (<no parameter info>)

fffffa60`00cc53a0 winhv!WinHvSetEventLogGroupSources (<no parameter info>)

fffffa60`00cc55a0 winhv!WinHvOnInterrupt (<no parameter info>)

fffffa60`00cc5870 winhv!WinHvCancelTimer (<no parameter info>)

fffffa60`00cc5a20 winhv!WinHvSetAbsoluteTimer (<no parameter info>)

fffffa60`00cc5b40 winhv!WinHvSetEventLogCompletedNotificationRoutine (<no parameter info>)

fffffa60`00cc5b50 winhv!WinHvQueryInterceptIrql (<no parameter info>)

fffffa60`00cc5b60 winhv!WinHvGetSintMessage (<no parameter info>)

fffffa60`00cc5b90 winhv!WinHvAllocatePartitionSintIndex (<no parameter info>)

fffffa60`00cc5d60 winhv!WinHvClearVirtualInterrupt (<no parameter info>)

fffffa60`00cc5db0 winhv!WinHvFlushEventLogBuffer (<no parameter info>)

fffffa60`00cc5e10 winhv!WinHvQueryReferenceCounter (<no parameter info>)

fffffa60`00cc5e50 winhv!WinHvSignalEvent (<no parameter info>)

fffffa60`00cc5ea0 winhv!WinHvWriteGpa (<no parameter info>)

fffffa60`00cc5fb0 winhv!WinHvReadGpa (<no parameter info>)

fffffa60`00cc60c0 winhv!WinHvTranslateVirtualAddress (<no parameter info>)

fffffa60`00cc61a0 winhv!WinHvAssertVirtualInterrupt (<no parameter info>)

fffffa60`00cc6240 winhv!WinHvGetSintEventFlags (<no parameter info>)

fffffa60`00cc6e90 winhv!WinHvIsCompatibleServicedHypervisorImplementation (<no parameter info>)

fffffa60`00cc6e90 winhv!WinHvIsCompatibleServicedDriverImplementation (<no parameter info>)

fffffa60`00cc6e90 winhv!WinHvIsCompatibleHypervisorImplementation (<no parameter info>)

fffffa60`00cc6e90 winhv!WinHvIsCompatibleDriverImplementation (<no parameter info>)

fffffa60`00cc6ea0 winhv!WinHvLookupPortId (<no parameter info>)

fffffa60`00cc6ee0 winhv!WinHvLowMemoryPolicyRaiseException (<no parameter info>)

fffffa60`00cc6f90 winhv!WinHvLowMemoryPolicyReturnStatus (<no parameter info>)

fffffa60`00cc7070 winhv!WinHvQueryFeaturesState (<no parameter info>)

fffffa60`00cc71f0 winhv!WinHvDeleteEventLogBuffer (<no parameter info>)

fffffa60`00cc7220 winhv!WinHvUnmapEventLogBuffer (<no parameter info>)

fffffa60`00cc7250 winhv!WinHvFinalizeEventLogBufferGroup (<no parameter info>)

fffffa60`00cc7310 winhv!WinHvSetEndOfMessage (<no parameter info>)

fffffa60`00cc7340 winhv!WinHvAllocateSingleSintIndex (<no parameter info>)

fffffa60`00cc7530 winhv!WinHvClearLogicalProcessorRunTimeGroup (<no parameter info>)

fffffa60`00cc7560 winhv!WinHvSetLogicalProcessorRunTimeGroup (<no parameter info>)

fffffa60`00cc7740 winhv!WinHvGetMemoryBalance (<no parameter info>)

fffffa60`00cc77a0 winhv!WinHvGetLogicalProcessorRunTime (<no parameter info>)

fffffa60`00cc7830 winhv!WinHvGetNextChildPartition (<no parameter info>)

fffffa60`00ccf0e0 winhv!WinHvReportPresentHypervisor (<no parameter info>)

fffffa60`00ccf400 winhv!WinHvSetSint (<no parameter info>)

fffffa60`00ccf5b0 winhv!WinHvMapStatsPage (<no parameter info>)

fffffa60`00ccfa90 winhv!WinHvWithdrawMemory (<no parameter info>)

fffffa60`00ccfc80 winhv!WinHvDepositMemory (<no parameter info>)

fffffa60`00ccfd80 winhv!WinHvAllocatePortId (<no parameter info>)

fffffa60`00ccfff0 winhv!WinHvUnmapStatsPage (<no parameter info>)

fffffa60`00cd02d0 winhv!WinHvDeleteTimer (<no parameter info>)

fffffa60`00cd02f0 winhv!WinHvCreateTimer (<no parameter info>)

fffffa60`00cd0360 winhv!WinHvFreePortId (<no parameter info>)

fffffa60`00cd03c0 winhv!WinHvSupplyInterruptVector (<no parameter info>)

fffffa60`00cd0a80 winhv!WinHvAdjustFeaturesState (<no parameter info>)

fffffa60`00cd0aa0 winhv!WinHvQueryFeatureInformation (<no parameter info>)

fffffa60`00cd0ab0 winhv!WinHvGetIdentifierString (<no parameter info>)

fffffa60`00cd0bd0 winhv!WinHvFreeSingleSintIndex (<no parameter info>)

fffffa60`00cd0c20 winhv!WinHvFreePartitionSintIndex (<no parameter info>)

fffffa60`00cd0dd0 winhv!DllUnload (<no parameter info>)

fffffa60`00cd0f30 winhv!WinHvReclaimInterruptVector (<no parameter info>)

fffffa60`00cd1030 winhv!WinHvRestorePartitionState (<no parameter info>)

fffffa60`00cd1170 winhv!WinHvSavePartitionState (<no parameter info>)

fffffa60`00cd3050 winhv!DllInitialize (<no parameter info>)

fffffa60`00cd3990 winhv!DriverEntry (<no parameter info>)
If we have a clean virtualized guest without any tools installed then we can rely on hardware information:
kd> !sysinfo machineid

Machine ID Information [From Smbios 2.3, DMIVersion 35, Size=3752]

BiosVendor = American Megatrends Inc.

BiosVersion = 080002

BiosReleaseDate = 05/05/2008

SystemManufacturer = Microsoft Corporation

SystemProductName = Virtual Machine

SystemVersion = 5.0

BaseBoardManufacturer = Microsoft Corporation

BaseBoardProduct = Virtual Machine

BaseBoardVersion = 5.0
- Dmitry Vostokov @ DumpAnalysis.org -
Posted in Crash Dump Analysis, Hyper-V, Virtualization, Windows Server 2008 | 1 Comment »
Friday, July 17th, 2009
I resumed this week my reading notebook on Software Generalist blog with a top priority book to read every working day: Windows Internals, 5th edition. In reading notes I put what I find interesting for me (at this time) or related to Windows memory dump analysis or debugging and troubleshooting in general. For the latter case, sometimes I put additional references or even WinDbg examples from user, kernel and complete memory dumps in full color. Hope you find these notes useful too.
- Dmitry Vostokov @ DumpAnalysis.org -
Posted in Announcements, Books, Crash Dump Analysis, Debugging, Kernel Development, Reading Notebook, Software Architecture, Software Technical Support, Tools, Vista, Windows Server 2008 | No Comments »
Friday, July 10th, 2009
Sometimes we get rare or hardware-related bugchecks and these might have been influenced by hardware virtualization (that is also a software and could have its own defects). Therefore it is beneficial to recognize when a system is running under a VM (Virtualized System pattern):
Memory Dumps from Xen-virtualized Windows
Memory dumps from VMware images (Virtual PC diagnostics in post comments)
Memory Dumps from Hyper-Virtualized Windows
For example, we get the following bugcheck and stack trace for the first processor:
0: kd> !analyze -v

[...]

CLOCK_WATCHDOG_TIMEOUT (101)

An expected clock interrupt was not received on a secondary processor in an

MP system within the allocated interval. This indicates that the specified

processor is hung and not processing interrupts.

Arguments:

Arg1: 00000060, Clock interrupt time out interval in nominal clock ticks.

Arg2: 00000000, 0.

Arg3: 805d8120, The PRCB address of the hung processor.

Arg4: 00000001, 0.
CURRENT_IRQL: 1c
STACK_TEXT:

8d283694 816df8a5 nt!KeBugCheckEx+0x1e

8d2836c8 816e163d nt!KeUpdateRunTime+0xd5

8d2836c8 84617008 nt!KeUpdateSystemTime+0xed

WARNING: Frame IP not in any known module. Following frames may be wrong.

8d283748 816f46a1 0×84617008

8d283758 816fa6aa nt!HvlpInitiateHypercall+0×21

8d283784 8166aca5 nt!HvlNotifyLongSpinWait+0×2b

8d2837a0 816cce7e nt!KeFlushSingleTb+0xc4

8d283808 81681db4 nt!MmAccessFault+0xc1d

8d283808 816dd033 nt!KiTrap0E+0xdc

8d28389c 8168ed58 nt!memcpy+0×33

8d283954 816712bf nt!MmCopyToCachedPage+0×1193

8d2839ec 81663053 nt!CcMapAndCopy+0×210

8d283a74 8c688218 nt!CcFastCopyWrite+0×283

8d283b98 8c40badc Ntfs!NtfsCopyWriteA+0×23e

8d283bcc 8c40bcab fltmgr!FltpPerformFastIoCall+0×22e

8d283bf8 8c41dc30 fltmgr!FltpPassThroughFastIo+0×7d

8d283c3c 818471cd fltmgr!FltpFastIoWrite+0×146

8d283d38 8167ec7a nt!NtWriteFile+0×34c

8d283d38 77115e74 nt!KiFastCallEntry+0×12a

01cfee80 00000000 0×77115e74
The thread was servicing a page fault. Notice the gap between KeUpdateSystemTime and HvlpInitiateHypercall. This is normal and consistent code if we look closer:
0: kd> .asm no_code_bytes

Assembly options: no_code_bytes
0: kd> uf HvlpInitiateHypercall

nt!HvlpInitiateHypercall:

816f4680 push    edi

816f4681 push    esi

816f4682 push    ebx

816f4683 mov     eax,dword ptr [esp+10h]

816f4687 mov     edx,dword ptr [esp+14h]

816f468b mov     ecx,dword ptr [esp+18h]

816f468f mov     ebx,dword ptr [esp+1Ch]

816f4693 mov     esi,dword ptr [esp+20h]

816f4697 mov     edi,dword ptr [esp+24h]

816f469b call    dword ptr [nt!HvlpHypercallCodeVa (8176bb8c)]

816f46a1 pop     ebx

816f46a2 pop     esi

816f46a3 pop     edi

816f46a4 ret     18h
0: kd> dp 8176bb8c l1

8176bb8c  84617000
0: kd> uf 84617000

84617000 or      eax,80000000h

84617005 vmcall

84617008ret
We have the address of RET instruction (84617008) on the stack trace:
0: kd> kv

ChildEBP RetAddr  Args to Child

8d283694 816df8a5 00000101 00000060 00000000 nt!KeBugCheckEx+0x1e

8d2836c8 816e163d 84e1521b 000000d1 8d283784 nt!KeUpdateRunTime+0xd5

8d2836c8 8461700884e1521b 000000d1 8d283784 nt!KeUpdateSystemTime+0xed (FPO: [0,2] TrapFrame @ 8d2836d8)

WARNING: Frame IP not in any known module. Following frames may be wrong.

8d283748 816f46a1 84e6c900 22728000 8172e28c 0×84617008

8d283758 816fa6aa 00010008 00000000 22728000 nt!HvlpInitiateHypercall+0×21 (FPO: [6,3,0])

8d283784 8166aca5 22728000 00000000 00000000 nt!HvlNotifyLongSpinWait+0×2b

[…]
The second processor is busy too:
0: kd> !running
System Processors 3 (affinity mask)

  Idle Processors 0
Prcbs  Current   Next

  0    8172c920  84e6c900            ................

  1    805d8120  85138030  85a50d78  …………….
0: kd> !thread 85138030

THREAD 85138030  Cid 0564.11c8  Teb: 7ff9f000 Win32Thread: 00000000 RUNNING on processor 1

IRP List:

    85ab5d00: (0006,01fc) Flags: 00000884  Mdl: 00000000

    85445ab8: (0006,0094) Flags: 00060000  Mdl: 00000000

Not impersonating

DeviceMap                 98a7d558

Owning Process            84f0d938       Image:         Application.exe

Attached Process          N/A            Image:         N/A

Wait Start TickCount      695643         Ticks: 224 (0:00:00:03.500)

Context Switch Count      20

UserTime                  00:00:00.000

KernelTime                00:00:00.000

Win32 Start Address 0x705e2679

Stack Init a1d13000 Current a1d10a70 Base a1d13000 Limit a1d10000 Call 0

Priority 9 BasePriority 8 PriorityDecrement 0 IoPriority 2 PagePriority 5

ChildEBP RetAddr  Args to Child

00000000 00000000 00000000 00000000 00000000 0×0
Because we have (Limit, Current, Base) triple for our thread we check its execution residue on kernel raw stack. We find traces of a hypercall too:
0: kd> dds a1d10000 a1d13000

[...]

a1d1215c  816fa6da nt!HvlEndSystemInterrupt+0x20

a1d12160  40000070

a1d12164  00000000

a1d12168  81608838 hal!HalEndSystemInterrupt+0x7a

a1d1216c  805d8000

a1d12170  a1d12180

a1d12174  81618cc9 hal!HalpIpiHandler+0x189

a1d12178  84f4841b

a1d1217c  000000e1

a1d12180  a1d1222c

a1d12184  84617008

a1d12188  badb0d00

a1d1218c  00000000

a1d12190  81665699 nt!RtlWalkFrameChain+0x58

a1d12194  816659c4 nt!RtlWalkFrameChain+0x377

a1d12198  11c4649e

a1d1219c  00000002

a1d121a0  00000003

a1d121a4  85478444

a1d121a8  0000001f

a1d121ac  00000000

a1d121b0  00000000

a1d121b4  816f46a1 nt!HvlpInitiateHypercall+0×21

a1d121b8  8172c800 nt!KiInitialPCR

a1d121bc  85138030

a1d121c0  85a72ac0

a1d121c4  8171b437 nt!HvlSwitchVirtualAddressSpace+0×28

a1d121c8  00010001

a1d121cc  00000000

a1d121d0  85a72ac0

a1d121d4  85138030

a1d121d8  8172c802 nt!KiInitialPCR+0×2

a1d121dc  00000000

a1d121e0  85138030

a1d121e4  816fa6da nt!HvlEndSystemInterrupt+0×20

a1d121e8  40000070

a1d121ec  00000000

a1d121f0  81608838 hal!HalEndSystemInterrupt+0×7a

a1d121f4  816f46a1 nt!HvlpInitiateHypercall+0×21

a1d121f8  805d8000

a1d121fc  85138030

a1d12200  805dc1e0

a1d12204  8171b437 nt!HvlSwitchVirtualAddressSpace+0×28

a1d12208  00010001

a1d1220c  00000000

a1d12210  00000000

a1d12214  81608468 hal!HalpDispatchSoftwareInterrupt+0×5e

a1d12218  00000000

a1d1221c  00000000

a1d12220  00000206

a1d12224  a1d12240

a1d12228  81608668 hal!HalpCheckForSoftwareInterrupt+0×64

a1d1222c  00000002

a1d12230  00000000

a1d12234  816086a8 hal!KfLowerIrql

a1d12238  00000000

a1d1223c  00000002

a1d12240  a1d12250

a1d12244  8160870c hal!KfLowerIrql+0×64

a1d12248  00000000

a1d1224c  00000000

a1d12250  a1d12294

a1d12254  816e035a nt!KiSwapThread+0×477

a1d12258  85138030

a1d1225c  851380b8

a1d12260  805d8120

a1d12264  0014d1f8

[…]
Looking at raw stack further we can even see that it was processing a page fault too and manually reconstruct its stack trace:
[...]

a1d1074c  85aef510

a1d10750  a1d10768

a1d10754  81678976 nt!IofCallDriver+0×63

a1d10758  84c87d50

a1d1075c  85aef510

a1d10760  00000000

a1d10764  84c87d50

a1d10768  a1d10784

a1d1076c  8166d74e nt!IoPageRead+0×172

a1d10770  85138030

a1d10774  84a1352c

a1d10778  84a134f8

a1d1077c  84a13538

a1d10780  84c87d50

a1d10784  a1d10840

a1d10788  816abf07 nt!MiDispatchFault+0xd14

a1d1078c  00000043

a1d10790  85138030

a1d10794  84a13538

a1d10798  84a1350c

a1d1079c  84a1352c

a1d107a0  8174c800 nt!MmSystemCacheWs

a1d107a4  00000000

a1d107a8  85138030

a1d107ac  a5397bf8

a1d107b0  85b01c48

a1d107b4  00000000

a1d107b8  00000000

a1d107bc  a5397bf8

a1d107c0  84a1358c

a1d107c4  a1d10864

a1d107c8  00000000

a1d107cc  8463a590

a1d107d0  84a134f8

a1d107d4  c0518000

a1d107d8  00000000

a1d107dc  00000000

a1d107e0  00000028

a1d107e4  a1d107f4

a1d107e8  00000000

a1d107ec  00000038

a1d107f0  859f5640

a1d107f4  a4bfa390

a1d107f8  00000000

a1d107fc  00000000

a1d10800  00000000

a1d10804  a1d10938

a1d10808  818652bd nt!MmCreateSection+0×98f

a1d1080c  00000000

a1d10810  846652e8

a1d10814  00000000

a1d10818  00000000

a1d1081c  00000000

a1d10820  00000028

a1d10824  00000000

a1d10828  00000080

a1d1082c  0000000a

a1d10830  85ae1c98

a1d10834  85ae1c20

a1d10838  00000000

a1d1083c  00000000

a1d10840  a1d108b8

a1d10844  816cd325 nt!MmAccessFault+0×10c6

a1d10848  a3000000

a1d1084c  a5397bf8

a1d10850  00000000

a1d10854  8174c800 nt!MmSystemCacheWs

a1d10858  00000000

a1d1085c  00000000

a1d10860  a5397bf8

a1d10864  00000000

[…]
0: kd> k L=a1d10750 a1d10750 a1d10750

ChildEBP RetAddr

WARNING: Frame IP not in any known module. Following frames may be wrong.

a1d10750 81678976 0xa1d10750

a1d10768 8166d74e nt!IofCallDriver+0x63

a1d10784 816abf07 nt!IoPageRead+0x172

a1d10840 816cd325 nt!MiDispatchFault+0xd14

a1d108b8 816f0957 nt!MmAccessFault+0x10c6

a1d10924 8181c952 nt!MmCheckCachedPageState+0x801

a1d109b0 8c60f850 nt!CcCopyRead+0x435

a1d109dc 8c613c52 Ntfs!NtfsCachedRead+0x13b

a1d10abc 8c612b6f Ntfs!NtfsCommonRead+0x105a

a1d10b2c 81678976 Ntfs!NtfsFsdRead+0x273

a1d10b44 8c40cba7 nt!IofCallDriver+0x63

a1d10b68 8c40d7c7 fltmgr!FltpLegacyProcessingAfterPreCallbacksCompleted+0x251

a1d10ba0 8c40dbe7 fltmgr!FltPerformSynchronousIo+0xb9

a1d10c10 9ca680e5 fltmgr!FltReadFile+0x2ed

[...]
A bit of reverse engineering offtopic here: I think that the absence of a trap means that cache processing NTFS code reuses page fault handling code.
- Dmitry Vostokov @ DumpAnalysis.org -
Posted in Assembly Language, Crash Dump Analysis, Crash Dump Patterns, Virtualization, Windows Server 2008 | 2 Comments »
Saturday, July 4th, 2009
Got it in the post yesterday shipped via courier from Amazon:
Windows® Internals: Including Windows Server 2008 and Windows Vista, Fifth Edition (PRO-Developer)

I originally expected it to be a paperback book but as a publisher myself I welcome the final MS Press decision to make it a hardcover. It is more solid. I plan to read it from cover to cover again, starting from tomorrow. I would like to thank authors for including the reference to www.dumpanalysis.org in the conclusion part of the last chapter 14 dedicated to crash dump analysis. This came as a nice surprise for me and I’m going to install a special plaque in the office and put its picture later on my blog.
- Dmitry Vostokov @ DumpAnalysis.org -
Posted in Announcements, Books, Certification, Crash Dump Analysis, Debugging, Software Architecture, Software Technical Support, Tools, Vista, Windows Server 2008, Windows System Administration | 4 Comments »
Thursday, May 7th, 2009
The community of Citrix and Microsoft Terminal Services / Virtualization meets again in Dublin, Ireland:
Event: PubForum 2009 Dublin - just one this year
Date: 5 to 7 June 2009
Where: Dublin, Ireland
Event Location: Camden Court Hotel, Dublin
Sessions: 20
Master Classes: 6
Visitors: 75 - 80
Attendee Fee: just 199 EUR
Agenda of the Event

- Dmitry Vostokov @ DumpAnalysis.org -
Posted in Announcements, Citrix, Virtualization, Windows Server 2008, Windows System Administration | No Comments »
Friday, April 24th, 2009
I looked at thread raw stack in a process dump from Windows Server 2008 and found ntdll!FinalExceptionHandler symbol:
Loading Dump File [App.dmp]

User Mini Dump File with Full Memory: Only application data is available

Windows Server 2008/Windows Vista Version 6001 (Service Pack 1) MP (4 procs) Free x86 compatible
0:000> !teb
TEB at 7ffde000
ExceptionList: 0022fdd8
StackBase: 00230000
StackLimit: 00225000
SubSystemTib: 00000000
FiberData: 00001e00
ArbitraryUserPointer: 00000000
Self: 7ffde000
EnvironmentPointer: 00000000
ClientId: 00002458 . 00002478
RpcHandle: 00000000
Tls Storage: 7ffde02c
PEB Address: 7ffdf000
LastErrorValue: 0
LastStatusValue: c0000035
Count Owned Locks: 0
HardErrorMode: 0
0:000> dds 00225000 00230000

[...]

0022ff7c  00000000

0022ff80  00000000

0022ff84  00000000

0022ff88  0022ff94

0022ff8c  76744911 kernel32!BaseThreadInitThunk+0xe

0022ff90  7ffdf000

0022ff94  0022ffd4

0022ff98  77b5e4b6 ntdll!__RtlUserThreadStart+0x23

0022ff9c  7ffdf000

0022ffa0  2497b80a

0022ffa4  00000000

0022ffa8  00000000

0022ffac  7ffdf000

0022ffb0  00000000

0022ffb4  00000000

0022ffb8  00000000

0022ffbc  0022ffa0

0022ffc0  00000000

0022ffc4  0022ffe4

0022ffc8  77b29834 ntdll!_except_handler4

0022ffcc  530d7826

0022ffd0  00000000

0022ffd4  0022ffec

0022ffd8  77b5e489 ntdll!_RtlUserThreadStart+0x1b

0022ffdc  00401110 App+0x1110

0022ffe0  7ffdf000

0022ffe4  ffffffff

0022ffe8  77bc75de ntdll!FinalExceptionHandler

0022ffec  00000000

0022fff0  00000000

0022fff4  00401110 App+0×1110

0022fff8  7ffdf000

0022fffc  00000000

00230000  78746341
Search on Internet led me to this very interesting review article about Windows memory protection mechanisms:
http://taossa.com/archive/bh08sotirovdowd.pdf
It also explains this new “Final” exception mechanism in W2K8.
I couldn’t find this in raw stack traces on Windows 7 so it might be the case that it is not enabled by default there like in Windows Vista.
- Dmitry Vostokov @ DumpAnalysis.org -
Posted in Crash Dump Analysis, Security, Vista, Windows 7, Windows Server 2008 | 3 Comments »
Friday, March 20th, 2009
In Windows Vista and Server 2008 LPC is implemented using undocumented Advanced Local Procedure Calls (ALPC) and the new formatting of the !process 0 ff output shows the owner of the port:
THREAD fffffa801afae6f0  Cid 033c.3c40  Teb: 000007fffffa0000 Win32Thread: 0000000000000000 WAIT: (WrLpcReply) UserMode Non-Alertable

    fffffa801afaea80  Semaphore Limit 0x1

Waiting for reply to ALPC Message fffff8800f4cc950 : queued at port fffffa8017dbb060 : owned by process fffffa801807b8f0
Instead of !lpc we should use !alpc extension command:
0: kd> !lpc message fffff8800f4cc950

LPC is now emulated over ALPC. Use !alpc

Arguments:
   /?                   - Print help

   /P [/V] PortAddress  - Dump the ALPC port information

   /M [/V] MsgAddress   - Searches the message and dumps the message information

   /R [/V] ResAddress   - Dumps the information regarding resources

   /G [/V]              - Dumps the global information
0: kd> !alpc /M fffff8800f4cc950
Message @ fffff8800f4cc950

  MessageID             : 0x0BFC (3068)

  CallbackID            : 0x1FEF27 (2092839)

  SequenceNumber        : 0x0004D4D4 (316628)

  Type                  : LPC_REQUEST

  DataLength            : 0x0068 (104)

  TotalLength           : 0x0090 (144)

  Canceled              : No

  Release               : No

  ReplyWaitReply        : No

  Continuation          : Yes

  OwnerPort             : fffffa8018a95e60 [ALPC_CLIENT_COMMUNICATION_PORT]

  WaitingThread         : fffffa801afae6f0

  QueueType             : ALPC_MSGQUEUE_PENDING

  QueuePort             : fffffa8017dbb060 [ALPC_CONNECTION_PORT]

  QueuePortOwnerProcess : fffffa801807b8f0 (svchost.exe)

  ServerThread          : fffffa801aeec060

  QuotaCharged          : No

  CancelQueuePort       : 0000000000000000

  CancelSequencePort    : 0000000000000000

  CancelSequenceNumber  : 0×00000000 (0)

  ClientContext         : 00000000025599e0

  ServerContext         : 0000000000000000

  PortContext           : 000000000030d640

  CancelPortContext     : 0000000000000000

  SecurityData          : 0000000000000000

  View                  : 0000000000000000
- Dmitry Vostokov @ DumpAnalysis.org -
Posted in Crash Dump Analysis, Crash Dump Patterns, Debugging, Vista, WinDbg Tips and Tricks, Windows Server 2008 | 1 Comment »
Thursday, March 19th, 2009
Looking at one kernel memory dump from x64 Windows Server 2008 I noticed this API call (shown in blue):
0: kd> kL 100

Child-SP          RetAddr           Call Site

fffffa60`138f4720 fffff800`01875f8a nt!KiSwapContext+0x7f

fffffa60`138f4860 fffff800`0187776a nt!KiSwapThread+0x2fa

fffffa60`138f48d0 fffff800`01ab16d6 nt!KeWaitForSingleObject+0x2da

fffffa60`138f4960 fffff800`01ab1667 nt!FsRtlCancellableWaitForMultipleObjects+0x62

fffffa60`138f49c0 fffffa60`06c515e0 nt!FsRtlCancellableWaitForSingleObject+0x27

fffffa60`138f4a00 fffffa60`06c611dc rdbss!RxWaitForStableCondition+0x11c

fffffa60`138f4a40 fffffa60`06c61c07 rdbss!RxFindOrCreateConnections+0x44c

fffffa60`138f4b20 fffffa60`06c56840 rdbss!RxConstructVirtualNetRoot+0xb7

fffffa60`138f4bc0 fffffa60`06c6381a rdbss!RxFindOrConstructVirtualNetRoot+0x594

fffffa60`138f4d30 fffffa60`06c54c42 rdbss!RxCreateTreeConnect+0x13e

fffffa60`138f4dc0 fffffa60`06c2fbf6 rdbss!RxCommonCreate+0x20a

fffffa60`138f4e80 fffffa60`06c5191a rdbss!RxFsdCommonDispatch+0x786

fffffa60`138f4f70 fffffa60`07e4f21f rdbss!RxFsdDispatch+0x21a

fffffa60`138f4fe0 fffffa60`011e05f5 mrxsmb!MRxSmbFsdDispatch+0xbf

fffffa60`138f5020 fffffa60`011e0130 mup!MupiCallUncProvider+0x159

fffffa60`138f5090 fffffa60`011e17af mup!MupStateMachine+0x120

fffffa60`138f50e0 fffffa60`00d200b4 mup!MupCreate+0x2c3

fffffa60`138f5160 fffffa60`06d332d6 fltmgr!FltpCreate+0xa4

[...]

3rd party filter drivers

[...]

fffffa60`138f55a0 fffff800`01aefa59 nt!IopParseDevice+0x5e3

fffffa60`138f5740 fffff800`01af3944 nt!ObpLookupObjectName+0x5eb

fffffa60`138f5850 fffff800`01affee0 nt!ObOpenObjectByName+0x2f4

fffffa60`138f5920 fffff800`01b00a0c nt!IopCreateFile+0x290

fffffa60`138f59c0 fffff800`0186fdf3 nt!NtCreateFile+0x78

fffffa60`138f5a50 fffff800`01870300 nt!KiSystemServiceCopyEnd+0x13

fffffa60`138f5c58 fffffa60`06c91a5e nt!KiServiceLinkage

fffffa60`138f5c60 fffff800`018913d1 dfsc!DfscConnOpenIpcConnectionCallout+0xbe

fffffa60`138f5d20 fffffa60`06c91d08 nt!KeExpandKernelStackAndCalloutEx+0×2e1

fffffa60`138f5db0 fffffa60`06c9bbcc dfsc!DfscGetIpcConnection+0×1f0

fffffa60`138f5e30 fffffa60`06c9bb21 dfsc!DfscRmGetReferral+0×78

fffffa60`138f5ea0 fffffa60`06c91470 dfsc!DfscGetDomainDCReferral+0×31

fffffa60`138f5ef0 fffffa60`06c917ec dfsc!DfscRmValidateDomainIterate+0×5c

fffffa60`138f5f40 fffffa60`06c915f5 dfsc!DfscValidateReferral+0xa0

fffffa60`138f5fb0 fffffa60`06c917ec dfsc!DfscRmValidateRootGetParent+0×75

fffffa60`138f5fe0 fffffa60`06c90825 dfsc!DfscValidateReferral+0xa0

fffffa60`138f6050 fffffa60`06c93905 dfsc!DfscCmValidateState+0×79

fffffa60`138f6090 fffffa60`06c9e759 dfsc!DfscSurrogateCreate+0×7d

fffffa60`138f6100 fffffa60`011e03ab dfsc!DfscSurrogatePreProcess+0xb9

fffffa60`138f6130 fffffa60`011e014f mup!MupCallSurrogatePrePost+0×10b

fffffa60`138f6190 fffffa60`011e17af mup!MupStateMachine+0×13f

fffffa60`138f61e0 fffffa60`00d200b4 mup!MupCreate+0×2c3

fffffa60`138f6260 fffffa60`06d332d6 fltmgr!FltpCreate+0xa4

[…]

3rd party filter drivers

[…]

fffffa60`138f6610 fffff800`01aefa59 nt!IopParseDevice+0×5e3

fffffa60`138f67b0 fffff800`01af3944 nt!ObpLookupObjectName+0×5eb

fffffa60`138f68c0 fffff800`01ac22f1 nt!ObOpenObjectByName+0×2f4

fffffa60`138f6990 fffff800`0186fdf3 nt!NtQueryAttributesFile+0×134

fffffa60`138f6c20 00000000`77285e4a nt!KiSystemServiceCopyEnd+0×13
This API is mentioned in the following presentation and document and can also be found in WDK:
PPT: Windows Memory Management Advances
DOC: Advances in Memory Management
KeExpandKernelStackAndCallout
Its 3rd parameter is the stack size and we can see it used in disassembly where r8d register is used for 3rd parameter according to x64 calling convention and rcx is used for the first parameter, a function procedure to be executed with a guaranteed kernel stack size:
0: kd> kv 100

Child-SP          RetAddr           : Args to Child                                                           : Call Site

[...]

fffffa60`138f5c60 fffff800`018913d1 : 00000000`00000000 fffff880`10d6d3f8 00000000`00000000 00000000`00000000 : dfsc!DfscConnOpenIpcConnectionCallout+0xbe

fffffa60`138f5d20 fffffa60`06c91d08 : fffffa60`06c919a0 fffffa60`138f5df0 fffff880`102128d0 fffffa60`138f5f10 : nt!KeExpandKernelStackAndCalloutEx+0×2e1

fffffa60`138f5db0 fffffa60`06c9bbcc : 00000000`00000000 fffff880`10d6d3f8 00000000`00000000 fffff880`10d6d460 : dfsc!DfscGetIpcConnection+0×1f0

[…]
0: kd> ub fffffa60`06c91d08

dfsc!DfscGetIpcConnection+0×1c6:

fffffa60`06c91cde xor     r9d,r9d

fffffa60`06c91ce1 mov     qword ptr [rsp+50h],rax

fffffa60`06c91ce6 mov     rax,qword ptr [dfsc!DfscGlobalData+0×138 (fffffa60`06c8d758)]

fffffa60`06c91ced mov     r8d,6000h

fffffa60`06c91cf3 mov     qword ptr [rsp+40h],rdi

fffffa60`06c91cf8 mov     byte ptr [rsp+58h],r11b

fffffa60`06c91cfd mov     qword ptr [rsp+20h],rax

fffffa60`06c91d02 call    qword ptr [dfsc!_imp_KeExpandKernelStackAndCalloutEx (fffffa60`06c8b0d0)]
0: kd> ub fffffa60`06c91cde

dfsc!DfscGetIpcConnection+0x199:

fffffa60`06c91cb1 488b88b8000000  mov     rcx,qword ptr [rax+0B8h]

fffffa60`06c91cb8 0fba61100a      bt      dword ptr [rcx+10h],0Ah

fffffa60`06c91cbd 450f42df        cmovb   r11d,r15d

fffffa60`06c91cc1 488b4338        mov     rax,qword ptr [rbx+38h]

fffffa60`06c91cc5 488d542440      lea     rdx,[rsp+40h]

fffffa60`06c91cca 488d0dcffcffff  lea     rcx,[dfsc!DfscConnOpenIpcConnectionCallout (fffffa60`06c919a0)]

fffffa60`06c91cd1 4889442448      mov     qword ptr [rsp+48h],rax

fffffa60`06c91cd6 488d842490000000 lea     rax,[rsp+90h]
It is good sign to see it used in file system stacks because in the past the fixed kernel stacks resulted in stack overflows and double faults:
Stack Overflow Pattern (kernel mode)
- Dmitry Vostokov @ DumpAnalysis.org -
Posted in Assembly Language, Crash Dump Analysis, Debugging, Kernel Development, Vista, Windows Server 2008 | No Comments »
Saturday, March 7th, 2009
I’m sorry to announce that the book has been delayed and the publication date has been changed to 30th of November, 2009. I promise this delay is the last one and kindly ask you to be patient. As a bonus or compensation for it, the book will also cover Windows 7.
- Dmitry Vostokov @ DumpAnalysis.org -
Posted in Announcements, Books, Crash Dump Analysis, Minidump Analysis, Publishing, Software Technical Support, Testing, Tools, Training and Seminars, Vista, Windows 7, Windows Server 2008, Windows System Administration | No Comments »