Debugged! MZ/PE September issue is out
Wednesday, December 16th, 2009Finally, after the long delay, the issue is available in print on Amazon and through other sellers:
Debugged! MZ/PE: Software Tracing

- Dmitry Vostokov @ DumpAnalysis.org -
Finally, after the long delay, the issue is available in print on Amazon and through other sellers:
Debugged! MZ/PE: Software Tracing
- Dmitry Vostokov @ DumpAnalysis.org -
One ETW trace pointed to a set of intermittent symptoms (messages were simplified for this post):
#        PID        TID        Message

[...]

31278    2300       7060       RequestXMLData entry

31281    2300       7060       RequestXMLData: XML error

[...]
Searching for issues having this error only pointed to a case with a mixed software product environment where some servers had the product version X and other servers the product version X+1. However, in the new case the customer claimed that he had only the product version X+1 on all production servers. We insisted and, after the closer inspection, servers with the product X were found…
- Dmitry Vostokov @ TraceAnalysis.org -
Although everything changes in the philosophy of Heraclitus, its Urstoff, fire, is eternal, indestructable. The same can be said about Memory and its memory fragments. Memoidealism has also some proximity with the notion of everlasting existence of thought of or spoken named objects in the philosophy of Parmenides. Once we think of or speak of something we immediately recall a memory fragment from and, at the same time, commit it to Memory again, perhaps as a different memory fragment, an assembled new memory trace.
- Dmitry Vostokov @ DumpAnalysis.org -
Memory Analysis and Debugging Institute (MA&DI), DA+TA Portal (DumpAnalysis.org + TraceAnalysis.org) and OpenTask establish
Software Maintenance Institute (SMI)
More details about R&D Institute of Software Maintenance will be announced soon.
- Dmitry Vostokov @ DumpAnalysis.org -
This is a revised, edited, cross-referenced and thematically organized volume of selected DumpAnalysis.org blog posts about crash dump analysis and debugging written in October 2008 - June 2009 for software engineers developing and maintaining products on Windows platforms, quality assurance engineers testing software on Windows platforms and technical support and escalation engineers dealing with complex software issues. The third volume features:
- 15 new crash dump analysis patterns
- 29 new pattern interaction case studies
- Trace analysis patterns
- Updated checklist
- Fully cross-referenced with Volume 1 and Volume 2
- New appendixes
Product information:

Back cover features 3D computer memory visualization image.
- Dmitry Vostokov @ DumpAnalysis.org -
Consider this example mapping (taken metaphorically from the mathematical notion of an injection) of one domain of knowledge to another:
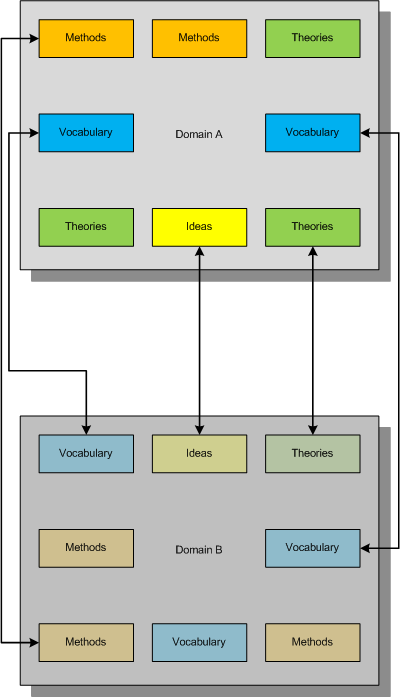
This mapping between concepts and ideas was once called “bijectivism” but was trivially described either as one to one mapping between two domains (like physical vs. mathematical) or fusing different concepts together to get another emerging concept. I myself proposed the similar mapping and called it a metaphorical bijection.
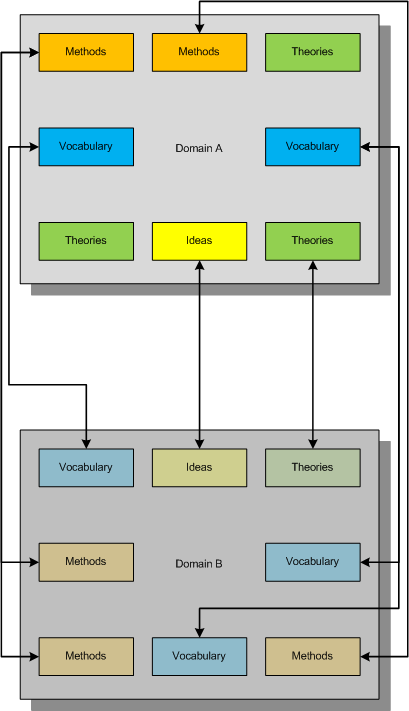
Now consider another mapping metaphorically equivalent to a mathematical notion of a surjection where all constituents of the second domain are covered metaphorically by the first domain:
What we strive for is to establish the complete bijective mapping and reorganize our knowledge of both domains to achieve that:
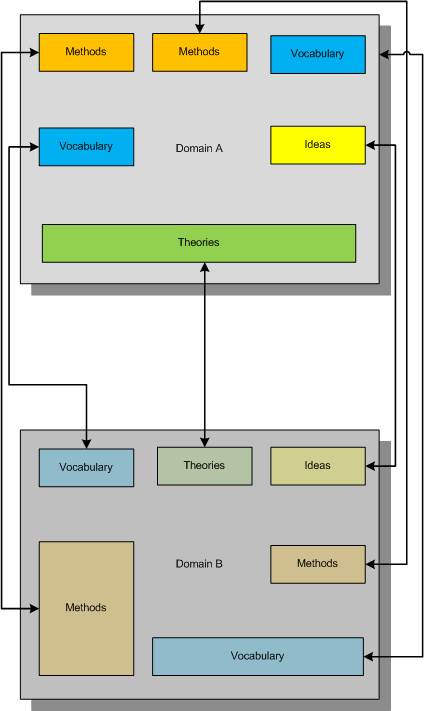
In diagrams above small boxes can represent sets of ideas, methods, etc. or individual ideas, methods, etc. The established metaphorical bijection can divide sets or combine them if needed. There can be several such bijections, of course, and we can use other methods of inquiry (for example, the scientific method) to choose between competing metaphorical bijections.
Useful mnemonic:
BEIS (B=I+S or to BE IS …)
Bijectionism Equals Injection + Surjection
Another mnemonic:
BET (B=T or to BE Transformation…)
Bijectionism Equals Transformation
Note also the second letter of Alef-Beis or Alef-Bet, the letter of Light that has interpretation of Creation in Biblical Hebrew.
More on this later as I need to come back to DebugWare patterns.
- Dmitry Vostokov @ DumpAnalysis.org -
Last week I was comparing the existing collection of memory dump analysis patterns to the collection of trace analysis patterns (in formation) in the search of isomorphism (or more correctly, general morphism) similar to Missing Component pattern. It is not a coincidence that such pattern pairs can be formed. For example, it is possible to discern deadlocks from both crash dumps and software traces (if appropriate information is available there). Fundamentally, it is implied by the definition of a software trace as some sort of a memory dump. And we can see traces in memory dumps too, for example, Execution Residue pattern. Because raw stack data resides in stack pages and in contemporary operating systems they are created from zero pages (metaphorically, out of the void) we can say that stack regions of threads are sorted by their creation time, for example, in this process user memory dump:
0:017> !runaway 4

 Elapsed Time

  Thread       Time

   0:49c       0 days 5:16:31.076

   4:4d8       0 days 5:16:30.967

   3:4d0       0 days 5:16:30.967

   2:4cc       0 days 5:16:30.967

   1:4c8       0 days 5:16:30.967

   5:4e8       0 days 5:16:30.936

   6:b6c       0 days 5:16:15.695

   7:b70       0 days 5:16:15.679

   9:b88       0 days 5:16:15.586

   8:b84       0 days 5:16:15.586

  11:348       0 days 5:16:12.934

  10:bfc       0 days 5:16:12.934

  12:1200      0 days 5:15:16.528

  15:1298      0 days 5:15:15.220

  14:1290      0 days 5:15:15.220

  13:128c      0 days 5:15:15.220

  17:12e4      0 days 5:15:13.257

  16:12dc      0 days 5:15:13.257

  18:12ec      0 days 5:15:13.117

  20:12f4      0 days 5:15:13.085

  19:12f0      0 days 5:15:13.085

  21:17a0      0 days 5:13:16.321

  22:1628      0 days 5:13:15.729

  24:1778      0 days 1:35:50.773

  23:17ec      0 days 1:35:50.773

  25:1570      0 days 1:27:54.190

  26:1724      0 days 1:27:10.151

  27:1490      0 days 0:05:46.732

  28:1950      0 days 0:02:28.153

  29:19b4      0 days 0:00:58.108

  30:177c      0 days 0:00:38.358

  31:1798      0 days 0:00:23.351

  32:1a7c      0 days 0:00:08.343
If we have complete memory dumps we can also account for other processes and their elapsed time. Within stack pages we have partial stack traces but do not have exact timing information between them except for stack frames from the current frozen thread stack trace or, if we are lucky, from a partial stack trace from the past execution. However, the timing between frames from different stacks is undefined and we can only guess it from higher level considerations like semantics of procedure calls and other information.
These considerations and the notion of a poset (partially ordered set) let me thinking about memory dumps as posets. I even created my interpretation of POSET abbreviation for this occasion:
POSET
Partially Ordered Software Execution Trace
- Dmitry Vostokov @ DumpAnalysis.org -
“Life is too short not to believe in Memory.”
Founding Farther of Memorianity
Imagine someone wrote an AI program and fit it into 4Gb. Imagine that it becomes intelligent indeed after some execution time (learning?). At some point when we admit its true intelligence we save a complete memory dump. Conclusion: we successfully reduced AI to a memory dump (out of memorillion of them). If AI requires a distributed network we still have the more complex dump (but still the dump). If AI program requires storage for its learning database we just concatenate it to the complete memory dump and we have the dump file again. Would advocates of AI or even Artificial General Intelligence agree with me?
- Dmitry Vostokov @ DumpAnalysis.org -
Let’s define a software or computer narratology as an application of the theory and methods of literary narratology to the domain of software execution where software traces and logs are considered as a narrative, the story of a computation (*). As an example, we have the following correspondence between 4-tiers of literary and software narrative models:
Events            Instructions, statements, functions

History           Concrete execution path

Narrative         Software trace

Presentation      View (from a trace viewer)
(*) Please do not confuse software narratology with computational narratology.
- Dmitry Vostokov @ TraceAnalysis.org -
DumpAnalysis.org acquires TraceAnalysis.org to complete computer DATA artifact analysis. The domain currently points to Dump Analysis Portal page but this might change in the future.
- Dmitry Vostokov @ DumpAnalysis.org -
What is a software trace from a mathematical standpoint? Before any software writes its trace data, it assembles it in memory. Therefore, generally, a software trace is a linear ordered sequence of specifically prepared memory fragments (trace statements):
(ts1, ts2, …, tsn)
where every tsi is a sequence of bits, bytes or other discrete units (see the definition of a memory dump):
(s11, s12, …, s1k, s21, s22, …, s2l, …, …, …, sn1, sn2, …, snm)
These trace statements can also be minidumps, selected regions of memory space. In the limit, if every tsi is a full memory snapshot saved at an instant of time (ti) we have a sequence of memory dumps:
(mt1, mt2, …, mtn)
Like with memory dump analysis we need symbol files to interpret saved memory fragments unless they were already interpreted during their construction. For example, traces written according ETW specification (Event Tracing for Windows), need TMF files (Trace Message Format) for their interpretation and viewing. Usually these files are generated from PDB files and therefore we have this correspondence:
memory dump file -> software trace file
PDB file -> TMF file
- Dmitry Vostokov @ TraceAnalysis.org -
This is a forthcoming book to be released next year after we finally publish DebugWare book by the end of this summer:
Software Tracing and Logging: Architecture, Design, Implementation and Analysis Patterns (ISBN: 978-1906717728)
I have already begun working on it in the background. The scope of DebugWare book is too wide to cover tracing and logging in great detail not to mention the very important subject of software trace analysis.
- Dmitry Vostokov @ TraceAnalysis.org -