Archive for the ‘Science of Memory Dump Analysis’ Category

The Science of Dr. Watson

Tuesday, June 3rd, 2008

Motivated by The Science of Sherlock Holmes I plan to write a book about the history of debugging with the following preliminary product details and tentative release date (which may come earlier if I have enough time):

  • Title: The Science of Dr. Watson: An Illustrated History of Debugging
  • Author: Dmitry Vostokov
  • Publisher: Opentask (01 September 2010)
  • Language: English
  • Product Dimensions: 22.86 x 15.24
  • ISBN-13: 978-1-906717-07-0
  • Paperback: 256 pages

- Dmitry Vostokov @ DumpAnalysis.org -

Integral Memory Analysis

Friday, May 30th, 2008

Following the introductory division of memory analysis into two broad categories I decided to plan yet another book with the following title and preliminary product details:

  • Title: Memory Analysis Forensics and Intelligence: An Integral Approach
  • Author: Dmitry Vostokov
  • Publisher: Opentask (01 September 2009)
  • Language: English
  • Product Dimensions: 22.86 x 15.24
  • ISBN-13: 978-1-906717-05-6
  • Paperback: 256 pages

As you might have noticed, I prefer to put 128, 256 or 512 pages in my book announcements. What that would say about the author’s background? :-) I would like to set 1024 pages for my memory dump analysis anthology series but 740 or 800 pages is the limit for POD technology I use.

- Dmitry Vostokov @ DumpAnalysis.org -

Memory Analysis (Part 1)

Friday, May 23rd, 2008

Recently being interested in forensic science and intelligence I decided to elaborate on memory analysis classification and came up with the following division:

- Memory Analysis Forensics

Answering questions related to a committed computer crime. The suspect may be a human or a software / hardware component. Incident response, troubleshooting and debugging belong to this category. Postmortem memory analysis is usually analysis of dump files saved and detached from the original system or operating conditions.

- Memory Analysis Intelligence

Monitoring memory state for behavioural and structural patterns to prevent certain events from occurring. Usually done in situ. However digital dumpster divers and spies may also collect and analyze memory data that was detached from the original computer system.

Each category can be further subdivided into:

– Functional Memory Analysis

Tracing of events.

Memoretics 

Analysis of memory states and their evolution.

The latter can be subdivided into: 

Static Memory Analysis

Traditional memory dump analysis.

Dynamic Memory Analysis

Live debugging.

- Dmitry Vostokov @ DumpAnalysis.org -

Win32 Exception Frequencies

Tuesday, May 20th, 2008

After Bug Check Frequencies post I was curious enough to do the same Google counting procedure for exceptions. Here are my results for exceptions listed in Visual C++ Debug \ Exceptions dialog:

Control-C

40010005

43

Control-Break

40010008

7

Datatype misalignment

80000002

27300

Breakpoint

80000003

36400

Access violation

C0000005

164000

In page error

C0000006

1210

Invalid handle

C0000008

1670

Not enough quota

C0000017

176

Illigal instruction

C000001D

3400

Cannot continue

C0000025

804

Invalid exception disposition

C0000026

121

Array bounds exceeded

C000008C

100

Floating-point denormal operand

C000008D

84

Floating-point division by zero

C000008E

523

Floating-point inexact result

C000008F

401

Floating-point invalid operation

C0000090

509

Floating-point overflow

C0000091

121

Floating-point stack check

C0000092

102

Floating-point underflow

C0000093

138

Integer division by zero

C0000094

1610

Integer overflow

C0000095

99

Stack overflow

C00000FD

3110

Unable to locate component

C0000135

3970

Ordinal not found

C0000138

43

Entry point not found

C0000139

724

DLL initialization failed

C0000142

918

Module not found

C06D007E

171

Procedure not found

C06D007F

248

The corresponding graph:

- Dmitry Vostokov @ DumpAnalysis.org -

MDAA Volume One Goes Digital

Friday, April 25th, 2008

Due to demand from people that prefer ebooks I published Memory Dump Analysis Anthology, Volume 1 in a digital format that can be purchased in Crash Dump Analysis Store. This format has color pictures inside.

- Dmitry Vostokov @ DumpAnalysis.org -

Colorimetric Computer Memory Dating (Part 1)

Wednesday, April 16th, 2008

Similar to radiometric dating using isotopes we can use memory visualization techniques to see distribution of allocated buffers and their retention over time. The key is to allocate colored memory. For example, to append a red buffer that contains RGBA values 0xFF000000 to specific allocations. I call these colored memory marks isomemotopes

We can either inject a different isomemotope for a different data or change the isomemotope over time to mark specific allocation times. I created a test program that allocates buffers marked by a different amount of different isomemotopes every time: 

#include "stdafx.h"
#include <stdlib.h>
#include <memory.h>
#include <windows.h>

typedef unsigned int ISOMEMOTOPE;

void *alloc_and_mark_with_isomemotope(size_t size,
                                     ISOMEMOTOPE color,
                                     size_t amount)
{
  char *p = (char *)malloc(size+amount);

  for (char *isop = p+size;
       p && isop  < p+size+amount;
       isop+=sizeof(ISOMEMOTOPE))
  {
    *(ISOMEMOTOPE *)isop=color;
  }

  return p;
}

int _tmain(int argc, _TCHAR* argv[])
{
  alloc_and_mark_with_isomemotope(0x1000,
                                 0xFF000000, // red 
                                 0x10000);
  alloc_and_mark_with_isomemotope(0x1000,
                                 0x00FF0000, // green
                                 0x20000);
  alloc_and_mark_with_isomemotope(0x1000,
                                 0x0000FF00, // blue
                                 0x30000);
  alloc_and_mark_with_isomemotope(0x1000,
                                 0xFFFFFF00, // white
                                 0x40000);
  alloc_and_mark_with_isomemotope(0x1000,
                                 0xFFFF0000, // yellow
                                 0x50000);

  DebugBreak();

  return 0;
}

Corresponding Dump2Picture image is this (0×00000000 address is at the bottom):


:-)

- Dmitry Vostokov @ DumpAnalysis.org -

The First Windows® Memory Dump Analysis Book!

Tuesday, April 15th, 2008

I’m very proud to announce that it is finally available in both paperback and hardback. Why have I made available both editions? Because I personally prefer hardcover books. You can order the book today and it will be printed in 3-5 days (paperback) or 5-10 days (hardcover) and sent to you:

Memory Dump Analysis Anthology, Volume 1

Note: although listed on Amazon and other online bookstores it is not immediately available at these stores at the moment due to the late submission. I apologize for this. However, I expect that in a few weeks pre-orders taken there will be eventually fulfilled. In the mean time, if you want the book now, you can use the link above.

- Dmitry Vostokov @ DumpAnalysis.org -

Memory Dump Analysis Anthology, Volume 2

Tuesday, March 25th, 2008

Although the first volume has not been published yet (scheduled for 15th of April, 2008) the planning for the second volume has already begun. Preliminary information is:

  • Title: Memory Dump Analysis Anthology, Volume 2
  • Paperback: 512 pages (*)
  • ISBN-13: 978-0-9558328-7-1
  • Author: Dmitry Vostokov
  • Publisher: Opentask (01 Oct 2008)
  • Language: English
  • Product Dimensions: 22.86 x 15.24

Hardcover version is also planned. PDF version will be available for download too.

(*) subject to change

- Dmitry Vostokov @ DumpAnalysis.org -

Bug Check Frequencies

Wednesday, March 12th, 2008

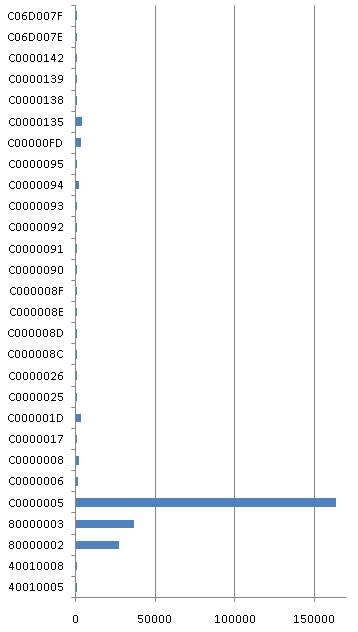
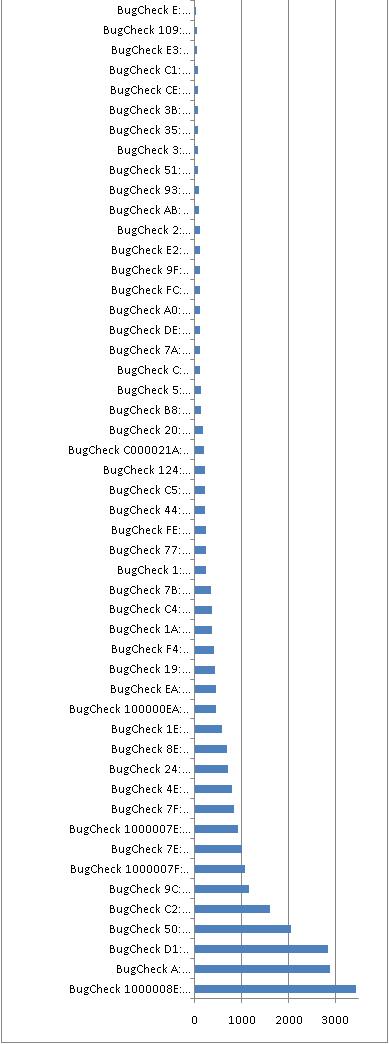
259 bugchecks are documented in WinDbg help. I did Google search for every one and here is their search results distribution graph cut off for data with less than 10 matches:

Of course there is some noise and matches do not always correspond to WinDbg bugcheck analysis output but we can get rough idea about bugcheck frequency. For example, unhandled exceptions in kernel mode, IRQL contract violation, pool corruption and hardware failures are the most frequent. Here is the full table:

BugCheck 1000008E: KERNEL_MODE_EXCEPTION_NOT_HANDLED_M

3440

BugCheck A: IRQL_NOT_LESS_OR_EQUAL

2890

BugCheck D1: DRIVER_IRQL_NOT_LESS_OR_EQUAL

2840

BugCheck 50: PAGE_FAULT_IN_NONPAGED_AREA

2040

BugCheck C2: BAD_POOL_CALLER

1600

BugCheck 9C: MACHINE_CHECK_EXCEPTION

1150

BugCheck 1000007F: UNEXPECTED_KERNEL_MODE_TRAP_M

1070

BugCheck 7E: SYSTEM_THREAD_EXCEPTION_NOT_HANDLED

998

BugCheck 1000007E: SYSTEM_THREAD_EXCEPTION_NOT_HANDLED_M

917

BugCheck 7F: UNEXPECTED_KERNEL_MODE_TRAP

834

BugCheck 4E: PFN_LIST_CORRUPT

799

BugCheck 24: NTFS_FILE_SYSTEM

697

BugCheck 8E: KERNEL_MODE_EXCEPTION_NOT_HANDLED

686

BugCheck 1E: KMODE_EXCEPTION_NOT_HANDLED

571

BugCheck 100000EA: THREAD_STUCK_IN_DEVICE_DRIVER_M

450

BugCheck EA: THREAD_STUCK_IN_DEVICE_DRIVER

446

BugCheck 19: BAD_POOL_HEADER

434

BugCheck F4: CRITICAL_OBJECT_TERMINATION

397

BugCheck 1A: MEMORY_MANAGEMENT

373

BugCheck C4: DRIVER_VERIFIER_DETECTED_VIOLATION

360

BugCheck 7B: INACCESSIBLE_BOOT_DEVICE

347

BugCheck 1: APC_INDEX_MISMATCH

242

BugCheck 77: KERNEL_STACK_INPAGE_ERROR

240

BugCheck FE: BUGCODE_USB_DRIVER

239

BugCheck 44: MULTIPLE_IRP_COMPLETE_REQUESTS

216

BugCheck C5: DRIVER_CORRUPTED_EXPOOL

207

BugCheck 124: WHEA_UNCORRECTABLE_ERROR

204

BugCheck C000021A: STATUS_SYSTEM_PROCESS_TERMINATED

187

BugCheck 20: KERNEL_APC_PENDING_DURING_EXIT

168

BugCheck B8: ATTEMPTED_SWITCH_FROM_DPC

124

BugCheck 5: INVALID_PROCESS_ATTACH_ATTEMPT

123

BugCheck C: MAXIMUM_WAIT_OBJECTS_EXCEEDED

110

BugCheck 7A: KERNEL_DATA_INPAGE_ERROR

110

BugCheck DE: POOL_CORRUPTION_IN_FILE_AREA

106

BugCheck A0: INTERNAL_POWER_ERROR

104

BugCheck FC: ATTEMPTED_EXECUTE_OF_NOEXECUTE_MEMORY

101

BugCheck 9F: DRIVER_POWER_STATE_FAILURE

98

BugCheck E2: MANUALLY_INITIATED_CRASH

98

BugCheck 2: DEVICE_QUEUE_NOT_BUSY

97

BugCheck AB: SESSION_HAS_VALID_POOL_ON_EXIT

86

BugCheck 93: INVALID_KERNEL_HANDLE

83

BugCheck 51: REGISTRY_ERROR

73

BugCheck 3: INVALID_AFFINITY_SET

71

BugCheck 35: NO_MORE_IRP_STACK_LOCATIONS

71

BugCheck 3B: SYSTEM_SERVICE_EXCEPTION

70

BugCheck CE: DRIVER_UNLOADED_WITHOUT_CANCELLING_PENDING_OPERATIONS

65

BugCheck C1: SPECIAL_POOL_DETECTED_MEMORY_CORRUPTION

59

BugCheck E3: RESOURCE_NOT_OWNED

43

BugCheck 109: CRITICAL_STRUCTURE_CORRUPTION

33

BugCheck E: NO_USER_MODE_CONTEXT

32

BugCheck D: MUTEX_LEVEL_NUMBER_VIOLATION

23

BugCheck 12: TRAP_CAUSE_UNKNOWN

14

BugCheck 23: FAT_FILE_SYSTEM

10

BugCheck 116: VIDEO_TDR_ERROR

10

BugCheck 9: IRQL_NOT_GREATER_OR_EQUAL

9

BugCheck 10D: WDF_VIOLATION

9

BugCheck 4: INVALID_DATA_ACCESS_TRAP

8

BugCheck 6: INVALID_PROCESS_DETACH_ATTEMPT

8

BugCheck 3F: NO_MORE_SYSTEM_PTES

8

BugCheck C9: DRIVER_VERIFIER_IOMANAGER_VIOLATION

8

BugCheck D0: DRIVER_CORRUPTED_MMPOOL

8

BugCheck 117: VIDEO_TDR_TIMEOUT_DETECTED

8

BugCheck F: SPIN_LOCK_ALREADY_OWNED

7

BugCheck 11: THREAD_NOT_MUTEX_OWNER

6

BugCheck 6B: PROCESS1_INITIALIZATION_FAILED

6

BugCheck BE: ATTEMPTED_WRITE_TO_READONLY_MEMORY

6

BugCheck B: NO_EXCEPTION_HANDLING_SUPPORT

5

BugCheck 27: RDR_FILE_SYSTEM

5

BugCheck 41: MUST_SUCCEED_POOL_EMPTY

5

BugCheck 96: INVALID_WORK_QUEUE_ITEM

5

BugCheck D5: DRIVER_PAGE_FAULT_IN_FREED_SPECIAL_POOL

5

BugCheck DA: SYSTEM_PTE_MISUSE

5

BugCheck E1: WORKER_THREAD_RETURNED_AT_BAD_IRQL

5

BugCheck E6: DRIVER_VERIFIER_DMA_VIOLATION

5

BugCheck 10E: VIDEO_MEMORY_MANAGEMENT_INTERNAL

5

BugCheck 8: IRQL_NOT_DISPATCH_LEVEL

4

BugCheck 18: REFERENCE_BY_POINTER

4

BugCheck 34: CACHE_MANAGER

4

BugCheck 76: PROCESS_HAS_LOCKED_PAGES

4

BugCheck CA: PNP_DETECTED_FATAL_ERROR

4

BugCheck CB: DRIVER_LEFT_LOCKED_PAGES_IN_PROCESS

4

BugCheck D2: BUGCODE_ID_DRIVER

4

BugCheck D4: SYSTEM_SCAN_AT_RAISED_IRQL_CAUGHT_IMPROPER_DRIVER_UNLOAD

4

BugCheck D9: LOCKED_PAGES_TRACKER_CORRUPTION

4

BugCheck F7: DRIVER_OVERRAN_STACK_BUFFER

4

BugCheck 101: CLOCK_WATCHDOG_TIMEOUT

4

BugCheck C0000218: STATUS_CANNOT_LOAD_REGISTRY_FILE

4

BugCheck 7: INVALID_SOFTWARE_INTERRUPT

3

BugCheck 13: EMPTY_THREAD_REAPER_LIST

3

BugCheck 14: CREATE_DELETE_LOCK_NOT_LOCKED

3

BugCheck 22: FILE_SYSTEM

3

BugCheck 29: SECURITY_SYSTEM

3

BugCheck 39: SYSTEM_EXIT_OWNED_MUTEX

3

BugCheck 46: DEREF_UNKNOWN_LOGON_SESSION

3

BugCheck 4D: NO_PAGES_AVAILABLE

3

BugCheck 9E: USER_MODE_HEALTH_MONITOR

3

BugCheck BA: SESSION_HAS_VALID_VIEWS_ON_EXIT

3

BugCheck D3: DRIVER_PORTION_MUST_BE_NONPAGED

3

BugCheck D6: DRIVER_PAGE_FAULT_BEYOND_END_OF_ALLOCATION

3

BugCheck E7: INVALID_FLOATING_POINT_STATE

3

BugCheck 100: LOADER_BLOCK_MISMATCH

3

BugCheck 106: AGP_ILLEGALLY_REPROGRAMMED

3

BugCheck DEADDEAD: MANUALLY_INITIATED_CRASH1

3

BugCheck 10: SPIN_LOCK_NOT_OWNED

2

BugCheck 21: QUOTA_UNDERFLOW

2

BugCheck 26: CDFS_FILE_SYSTEM

2

BugCheck 30: SET_OF_INVALID_CONTEXT

2

BugCheck 33: UNEXPECTED_INITIALIZATION_CALL

2

BugCheck 36: DEVICE_REFERENCE_COUNT_NOT_ZERO

2

BugCheck 37: FLOPPY_INTERNAL_ERROR

2

BugCheck 40: TARGET_MDL_TOO_SMALL

2

BugCheck 42: ATDISK_DRIVER_INTERNAL

2

BugCheck 4A: IRQL_GT_ZERO_AT_SYSTEM_SERVICE

2

BugCheck 72: ASSIGN_DRIVE_LETTERS_FAILED

2

BugCheck 73: CONFIG_LIST_FAILED

2

BugCheck CD: PAGE_FAULT_BEYOND_END_OF_ALLOCATION

2

BugCheck CF: TERMINAL_SERVER_DRIVER_MADE_INCORRECT_MEMORY_REFERENCE

2

BugCheck E4: WORKER_INVALID

2

BugCheck 104: AGP_INVALID_ACCESS

2

BugCheck 15: LAST_CHANCE_CALLED_FROM_KMODE

1

BugCheck 16: CID_HANDLE_CREATION

1

BugCheck 17: CID_HANDLE_DELETION

1

BugCheck 28: CORRUPT_ACCESS_TOKEN

1

BugCheck 38: SERIAL_DRIVER_INTERNAL

1

BugCheck 43: NO_SUCH_PARTITION

1

BugCheck 45: INSUFFICIENT_SYSTEM_MAP_REGS

1

BugCheck 48: CANCEL_STATE_IN_COMPLETED_IRP

1

BugCheck 49: PAGE_FAULT_WITH_INTERRUPTS_OFF

1

BugCheck 57: XNS_INTERNAL_ERROR

1

BugCheck 58: FTDISK_INTERNAL_ERROR

1

BugCheck 5C: HAL_INITIALIZATION_FAILED

1

BugCheck 60: PROCESS_INITIALIZATION_FAILED

1

BugCheck 62: OBJECT1_INITIALIZATION_FAILED

1

BugCheck 63: SECURITY1_INITIALIZATION_FAILED

1

BugCheck 64: SYMBOLIC_INITIALIZATION_FAILED

1

BugCheck 67: CONFIG_INITIALIZATION_FAILED

1

BugCheck 68: FILE_INITIALIZATION_FAILED

1

BugCheck 70: SESSION4_INITIALIZATION_FAILED

1

BugCheck 74: BAD_SYSTEM_CONFIG_INFO

1

BugCheck 75: CANNOT_WRITE_CONFIGURATION

1

BugCheck 79: MISMATCHED_HAL

1

BugCheck 7D: INSTALL_MORE_MEMORY

1

BugCheck 80: NMI_HARDWARE_FAILURE

1

BugCheck 82: DFS_FILE_SYSTEM

1

BugCheck 85: SETUP_FAILURE

1

BugCheck 99: INVALID_REGION_OR_SEGMENT

1

BugCheck A1: PCI_BUS_DRIVER_INTERNAL

1

BugCheck BF: MUTEX_ALREADY_OWNED

1

BugCheck CC: PAGE_FAULT_IN_FREED_SPECIAL_POOL

1

BugCheck DB: DRIVER_CORRUPTED_SYSPTES

1

BugCheck E8: INVALID_CANCEL_OF_FILE_OPEN

1

BugCheck ED: UNMOUNTABLE_BOOT_VOLUME

1

BugCheck FD: DIRTY_NOWRITE_PAGES_CONGESTION

1

BugCheck 108: THIRD_PARTY_FILE_SYSTEM_FAILURE

1

BugCheck 111: RECURSIVE_NMI

1

BugCheck 121: DRIVER_VIOLATION

1

BugCheck 122: WHEA_INTERNAL_ERROR

1

BugCheck 1B: PFN_SHARE_COUNT

0

BugCheck 1C: PFN_REFERENCE_COUNT

0

BugCheck 1D: NO_SPIN_LOCK_AVAILABLE

0

BugCheck 1F: SHARED_RESOURCE_CONV_ERROR

0

BugCheck 25: NPFS_FILE_SYSTEM

0

BugCheck 2A: INCONSISTENT_IRP

0

BugCheck 2B: PANIC_STACK_SWITCH

0

BugCheck 2C: PORT_DRIVER_INTERNAL

0

BugCheck 2D: SCSI_DISK_DRIVER_INTERNAL

0

BugCheck 2E: DATA_BUS_ERROR

0

BugCheck 2F: INSTRUCTION_BUS_ERROR

0

BugCheck 31: PHASE0_INITIALIZATION_FAILED

0

BugCheck 32: PHASE1_INITIALIZATION_FAILED

0

BugCheck 3A: SYSTEM_UNWIND_PREVIOUS_USER

0

BugCheck 3C: INTERRUPT_UNWIND_ATTEMPTED

0

BugCheck 3D: INTERRUPT_EXCEPTION_NOT_HANDLED

0

BugCheck 3E: MULTIPROCESSOR_CONFIGURATION_NOT_SUPPORTED

0

BugCheck 47: REF_UNKNOWN_LOGON_SESSION

0

BugCheck 4B: STREAMS_INTERNAL_ERROR

0

BugCheck 4C: FATAL_UNHANDLED_HARD_ERROR

0

BugCheck 4F: NDIS_INTERNAL_ERROR

0

BugCheck 52: MAILSLOT_FILE_SYSTEM

0

BugCheck 53: NO_BOOT_DEVICE

0

BugCheck 54: LM_SERVER_INTERNAL_ERROR

0

BugCheck 55: DATA_COHERENCY_EXCEPTION

0

BugCheck 56: INSTRUCTION_COHERENCY_EXCEPTION

0

BugCheck 59: PINBALL_FILE_SYSTEM

0

BugCheck 5A: CRITICAL_SERVICE_FAILED

0

BugCheck 5B: SET_ENV_VAR_FAILED

0

BugCheck 5D: UNSUPPORTED_PROCESSOR

0

BugCheck 5E: OBJECT_INITIALIZATION_FAILED

0

BugCheck 5F: SECURITY_INITIALIZATION_FAILED

0

BugCheck 61: HAL1_INITIALIZATION_FAILED

0

BugCheck 65: MEMORY1_INITIALIZATION_FAILED

0

BugCheck 66: CACHE_INITIALIZATION_FAILED

0

BugCheck 69: IO1_INITIALIZATION_FAILED

0

BugCheck 6A: LPC_INITIALIZATION_FAILED

0

BugCheck 6C: REFMON_INITIALIZATION_FAILED

0

BugCheck 6D: SESSION1_INITIALIZATION_FAILED

0

BugCheck 6E: SESSION2_INITIALIZATION_FAILED

0

BugCheck 6F: SESSION3_INITIALIZATION_FAILED

0

BugCheck 71: SESSION5_INITIALIZATION_FAILED

0

BugCheck 78: PHASE0_EXCEPTION

0

BugCheck 7C: BUGCODE_NDIS_DRIVER

0

BugCheck 81: SPIN_LOCK_INIT_FAILURE

0

BugCheck 8B: MBR_CHECKSUM_MISMATCH

0

BugCheck 8F: PP0_INITIALIZATION_FAILED

0

BugCheck 90: PP1_INITIALIZATION_FAILED

0

BugCheck 92: UP_DRIVER_ON_MP_SYSTEM

0

BugCheck 94: KERNEL_STACK_LOCKED_AT_EXIT

0

BugCheck 97: BOUND_IMAGE_UNSUPPORTED

0

BugCheck 98: END_OF_NT_EVALUATION_PERIOD

0

BugCheck 9A: SYSTEM_LICENSE_VIOLATION

0

BugCheck 9B: UDFS_FILE_SYSTEM

0

BugCheck A2: MEMORY_IMAGE_CORRUPT

0

BugCheck A3: ACPI_DRIVER_INTERNAL

0

BugCheck A4: CNSS_FILE_SYSTEM_FILTER

0

BugCheck A5: ACPI_BIOS_ERROR

0

BugCheck A7: BAD_EXHANDLE

0

BugCheck AC: HAL_MEMORY_ALLOCATION

0

BugCheck AD: VIDEO_DRIVER_DEBUG_REPORT_REQUEST

0

BugCheck B4: VIDEO_DRIVER_INIT_FAILURE

0

BugCheck B9: CHIPSET_DETECTED_ERROR

0

BugCheck BB: NETWORK_BOOT_INITIALIZATION_FAILED

0

BugCheck BC: NETWORK_BOOT_DUPLICATE_ADDRESS

0

BugCheck C6: DRIVER_CAUGHT_MODIFYING_FREED_POOL

0

BugCheck C7: TIMER_OR_DPC_INVALID

0

BugCheck C8: IRQL_UNEXPECTED_VALUE

0

BugCheck D7: DRIVER_UNMAPPING_INVALID_VIEW

0

BugCheck D8: DRIVER_USED_EXCESSIVE_PTES

0

BugCheck DC: DRIVER_INVALID_STACK_ACCESS

0

BugCheck DF: IMPERSONATING_WORKER_THREAD

0

BugCheck E0: ACPI_BIOS_FATAL_ERROR

0

BugCheck E9: ACTIVE_EX_WORKER_THREAD_TERMINATION

0

BugCheck EB: DIRTY_MAPPED_PAGES_CONGESTION

0

BugCheck EC: SESSION_HAS_VALID_SPECIAL_POOL_ON_EXIT

0

BugCheck EF: CRITICAL_PROCESS_DIED

0

BugCheck F1: SCSI_VERIFIER_DETECTED_VIOLATION

0

BugCheck F3: DISORDERLY_SHUTDOWN

0

BugCheck F5: FLTMGR_FILE_SYSTEM

0

BugCheck F6: PCI_VERIFIER_DETECTED_VIOLATION

0

BugCheck F8: RAMDISK_BOOT_INITIALIZATION_FAILED

0

BugCheck F9: DRIVER_RETURNED_STATUS_REPARSE_FOR_VOLUME_OPEN

0

BugCheck FA: HTTP_DRIVER_CORRUPTED

0

BugCheck FF: RESERVE_QUEUE_OVERFLOW

0

BugCheck 105: AGP_GART_CORRUPTION

0

BugCheck 10A: APP_TAGGING_INITIALIZATION_FAILED

0

BugCheck 10C: FSRTL_EXTRA_CREATE_PARAMETER_VIOLATION

0

BugCheck 10F: RESOURCE_MANAGER_EXCEPTION_NOT_HANDLED

0

BugCheck 112: MSRPC_STATE_VIOLATION

0

BugCheck 113: VIDEO_DXGKRNL_FATAL_ERROR

0

BugCheck 114: VIDEO_SHADOW_DRIVER_FATAL_ERROR

0

BugCheck 115: AGP_INTERNAL

0

BugCheck 119: VIDEO_SCHEDULER_INTERNAL_ERROR

0

BugCheck 11A: EM_INITIALIZATION_FAILURE

0

BugCheck 11B: DRIVER_RETURNED_HOLDING_CANCEL_LOCK

0

BugCheck 11C: ATTEMPTED_WRITE_TO_CM_PROTECTED_STORAGE

0

BugCheck 11D: EVENT_TRACING_FATAL_ERROR

0

BugCheck 127: PAGE_NOT_ZERO

0

BugCheck 12B: FAULTY_HARDWARE_CORRUPTED_PAGE

0

BugCheck 12C: EXFAT_FILE_SYSTEM

0

BugCheck C0000221: STATUS_IMAGE_CHECKSUM_MISMATCH

0

- Dmitry Vostokov @ DumpAnalysis.org -

Memory Dump Analysis Anthology, Volume 1

Thursday, February 7th, 2008

It is very easy to become a publisher nowadays. Much easier than I thought. I registered myself as a publisher under the name of OpenTask which is my registered business name in Ireland. I also got the list of ISBN numbers and therefore can announce product details for the first volume of Memory Dump Analysis Anthology series:

Memory Dump Analysis Anthology, Volume 1

  • Paperback: 720 pages (*)
  • ISBN-13: 978-0-9558328-0-2
  • Hardcover: 720 pages (*)
  • ISBN-13: 978-0-9558328-1-9
  • Author: Dmitry Vostokov
  • Publisher: Opentask (15 Apr 2008)
  • Language: English
  • Product Dimensions: 22.86 x 15.24

(*) subject to change 

PDF file will be available for download too.

- Dmitry Vostokov @ DumpAnalysis.org -

Memoretics

Monday, February 4th, 2008

I’ve been trying to put memory dump analysis on relevant scientific grounds for some time and now this branch of science needs its own name. After considering different alternative names I finally chose the word Memoretics. Here is the brief definition:

Computer Memoretics studies computer memory snapshots and their evolution in time.

Obviously this domain of research has many links with application and system debugging. However its scope is wider than debugging because it doesn’t necessarily study memory snapshots from systems and applications experiencing faulty behaviour.

Initially I was thinking about Memogenics word but its suffix is heavily associated with genes metaphor which I’m currently trying to avoid although I personally re-discovered software genes approach to software disorders when thinking about Memoretics vs. Memogenics. Later I found some research efforts going on but seems they are based on constructing software genes artificially. On the contrary I would try to discover genes in computer memories first.

genic

Also Memoretics has longer prefix almost resembling Memory word. This had the final influence on my decision.

PS. I was also thinking about Memorology word but it has negative connotations with Astrology or Numerology and was coined already by someone like Memology and Memorics

- Dmitry Vostokov @ DumpAnalysis.org -

Software troubleshooting and causal models

Tuesday, January 15th, 2008

Recently became interested in causality, causal models and how they can be applied to software troubleshooting especially when we have various traces and logs. Looking at traces, system and application event logs and logs from other tools, technical support engineers see correlations between various events and build causal models that are used to trace symptoms back to their causes. They use prior knowledge, assumptions, informed guessing and event order to discern causal structure. Clearly event order in logs influences that so it is important to understand how we think in causal terms in order to learn about our biases.

Another important question from software engineering perspective is how to design tracing components to help technical support and software maintenance engineers build correct causal models of software issues. Just finished reading a book about causal modeling:

Review of Causal Models

- Dmitry Vostokov @ DumpAnalysis.org -

What is a Software Defect?

Tuesday, January 8th, 2008

Software can be considered as models of real or imagined systems which may be models themselves. Any modeling act involves a mapping between a system and a model that preserves causal, ordering and inclusion relationships and a mapping from the model to the system that translates emerging relationships and causal structures back to that system. The latter I call modeling expectations and any observed deviations in structure and behavior between the model and the system I call software defects which can be functional failures, error messages, crashes or hangs (red line on diagrams below):

Consider ATM software as a venerable example. It models imagined world of ATM transactions which we call ATM software requirements. The latter specifies ACID (atomic, consistent, isolated and durable) transaction rules. If they are broken by the written software we have the defect:

What are software requirements? They are models of real or imagined systems or can be models of past causal and relationship experiences. If requirements are wrong they do not translate back and we still consider software as having a defect:

Translating this to ATM example we have:

Another example where the perceived absence of failures can be considered as a defect is the program designed to model memory leaks that might not be leaking due to a defect in its source code.

Now we can answer the question ”What is a memory corruption?” which is the topic of the next post.

- Dmitry Vostokov @ DumpAnalysis.org -

Complexity and Memory Dumps (Part 1)

Wednesday, December 5th, 2007

Asking right questions at the appropriate hierarchical organization level is a known solution to complexity. In case of memory dumps it is sometimes useful to forget about bits, bytes, words, dwords and qwords, memory addresses, pointers, runtime structures, API and ask educated questions at component level, the simplest of it is the question about component timestamp, in WinDbg parlance, using variants of lm command, for example:

0:008> lmt m ModuleA
start    end        module name
76290000 762ad000   ModuleA  Sat Feb 17 13:59:59 2007 (45D70A5F)

0:008> lmt m ModuleB
start    end        module name
66c50000 66c65000   ModuleB  Fri Feb 02 22:30:03 2007 (45C3BB6B)

The next step is obvious: test with the newer version. Another good question is about consistency to exclude cases caused by α-particle hits. This latter possibility was mentioned in Andreas Zeller’s book I read some time ago and can be considered as the efficient cause of some crash dumps according to Aristotelian causation categories.   

- Dmitry Vostokov @ DumpAnalysis.org -

Four causes of crash dumps

Friday, November 23rd, 2007

Obviously the appearance of crash dumps on your computer was caused by something. A bug, fault, defect or something else?

Aristotle suggested 4 types of causation 2 millennia ago and they are:

Material cause - presence of some substance, usually material one (hardware) but can be machine code (software). The distinction between hardware and software is often blurred today because of virtualization.

Formal cause - some form or arrangement (an algorithm)

Efficient cause - an agent (data flow or event caused an algorithm to be executed)

Final cause - the desire of someone (or something, operating system, for example).

We skip material causes because hardware and software are always involved. Obviously final causality should be among of crash dump causes because they were either anticipated or made deliberately. Let’s look at 3 examples with possible causes:

Buffer Overflow

  • Formal cause - a defect in code which might have arisen from incomplete or wrong model

  • Efficient cause - data is too big to fit in a buffer

  • Final cause - operating system and runtime library support decided to save a crash dump

Bugcheck (NMI)

  • Formal cause - NMI handler

  • Efficient cause - a button on a hardware panel or KeBugCheckEx

  • Final cause - “I need a memory dump” desire. Also crash dump saving functions were written before by kernel developers in anticipation of future crash dumps.

Bugcheck (A)

  • Formal cause - a defect in code again or particular disposition of threads

  • Efficient cause - Driver Verifier triggered paging out data

  • Final cause - deliberate OS bugcheck (here we can also say that it was anticipated by OS designers)

Concrete causes depend on the organizational level you use: software/hardware systems/components, modeling act by humans, etc.

- Dmitry Vostokov @ DumpAnalysis.org -

Modeling side of DLL Injection

Monday, November 19th, 2007

Component injection can be used to model various process and system software behavior by writing customized DLL/SYS and injecting them into process/kernel space. Although often depicted either as security threat or value-added hooking mechanism very little has been written about its use to model various software defects. Here I don’t mean testing but studying faulty behavior and artifacts after injecting specific DLLs with design and implementation defects. For example, forgetting to release database connections or not closing file handles. NotMyLeak is an attempt to do it for different kind of leaks on x86 and x64 Windows platforms. It uses automatic DLL injection via standard Windows hooking mechanism. Stay tuned.

- Dmitry Vostokov @ DumpAnalysis.org -  

Memorillion and Quadrimemorillion

Thursday, November 15th, 2007

What are these? These are names of the number of possible unique complete memory dumps when address space is 32 bit and 64-bit correspondingly:

256232 and 256264

The first of them can be approximated by 101010

This idea came to me after I learnt about the so called “immense number” proposed by Walter Elsasser. This number is so big that its digits cannot be listed because there is not enough particles in observable Universe to write them.

Certainly one memorillion is more than one googol 10100 but it requires only approx. 1010 particles in ideal case to list its digits and therefore not an immense number. It is however far less than one googolplex 1010100.

Consider a complete memory dump with bytes written in hexadecimal notation:

0x50414745554d500f000000ce0e00000090...

This number has more than 8 billion digits… And it is one possible number out of memorillion of them. So one memorillion in hexadecimal notation is just

0xFFFFFFFFFFFFFFFFFFFFF... + 1

where we have 2*232 ‘F’ symbols written sequentially. One quadrimemorillion has 2*264 ‘F’ symbols.

Also the question about the number of possible crash dumps can be considered as Microsoft interview style question when you have possible candidates and you want to assess their ability to think out of the box and handle large numbers. 

- Dmitry Vostokov @ DumpAnalysis.org -

What is Memory Dump Analysis?

Wednesday, November 7th, 2007

From a computer system we get a memory dump composed from fixed size observable values called bit or byte values. Then we impose some structure on it in order to extract various derived objects like threads, processes, etc., build some organization and understand what had happened. This activity is called modeling and memory, crash or core dump analysis is all about modeling a dynamical computer system based on its memory slice. Then we can make predictions and test them via controlled experiments called troubleshooting advices. Tools like WinDbg or GDB can be considered as abstract computers whose job is to model another computer when we feed memory dumps to them.

Modeling computers on computers is inherently reductionist approach and most of mainstream science is just plain reductionism. Just compare the notion of point-like particles as building blocks in physics and bits, recursiveness of physical states and computer algorithms.   

If you want to understand reductionist modeling in physics I would recommend the following book The Comprehensible Cosmos: Where Do the Laws of Physics Come From? written by Victor J. Stenger which I have just finished reading.

Buy from Amazon

The nice feature of this book is its clear separation between textual description and mathematics. The first 190 pages don’t have any mathematical formulas and the next 130 pages repeat the same discussion using undergraduate level of mathematics. 

- Dmitry Vostokov @ DumpAnalysis.org -

Threads as braided strings in abstract space (1)

Thursday, October 25th, 2007

In the past I was trying to find a way to depict running and blocked threads graphically perhaps as strings in some abstract n-dimensional space (manifold), preferably 3-dimensional manifold. If you have never encountered manifolds here is their informal definition:

3-dimensional manifold is a 3-dimensional space that looks like a 3-dimensional Euclidean space locally (in small regions) so we can explore the manifold space like we do in our 3-dimensional spatial world

Example: the surface of a sphere where small regions look like 2-dimensional rectangles (compare Earth surface and a football field on it)

My infrequent attempts were not satisfactory and only recently after reading the book Towards a Philosophy of Real Mathematics written by David Corfield I’ve found that it might be good to represent threads as n-string braids.

 Buy from Amazon

Braids are strings that raise monotonically without reversing their direction. It sounds like an arrow of time during computation. Braid theory is related to knot theory and might be at a good metaphor to explore. To picture thread strings we need to find abstract coordinates for our space. One of axes is obviously time axis and the other is a program counter axis (for example, the value of EIP register). 

Here is a thread running through code sequentially without jumps or loops, acquiring and releasing a spinlock on its way:


Here is another thread looping while trying to acquire a spinlock and finally taking ownership of it and then running through the same code sequentially:

Suppose that both threads contend for the same spinlock and there is a 3rd thread doing the same. Let’s overlay them on one single diagram:

To have a perspective we can add a 3rd dimension - thread number or ID (TID):

Instead of TID axis we can use data address axis (the data address accessed by the current instruction) or have it as a 4th dimension. If we want to differentiate between read and write addresses we can add 5th axis. We will try to do it in the next part.

- Dmitry Vostokov @ DumpAnalysis.org -

Memory Dump - A Mathematical Definition

Wednesday, October 24th, 2007

This is the first post in Science of Memory Dump Analysis category where I apply philosophy, systems theory, mathematics, physics and computer science ideas. It was inspired after reading Life Itself book written by Robert Rosen where computers are depicted as direct sums of states. As shown in that book, in the case of machines, their synthetic models (direct sums) are equivalent to analytic models (direct product of observables). Taking every single bit as an observable having its values in Z2 set {0, 1} we can make a definition of an ideal memory dump as a direct product or a direct sum of bits saved instantaneously at the given time:

i si = i si

Of course, we can also consider bytes having 8 bits as observables having their values from Z256 set, etc.

In our case we can simply rewrite direct sum or product as the list of bits, bytes, words or double words, etc:

(…, si-1, si, si+1, …, sj-1, sj, sj+1, …)

According to Rosen we include hardware states (registers, for example) and partition memory into input, output states for particular computation and other states.

Saving a memory dump takes certain amount of time. Suppose that it takes 3 discrete time events (ticks). During the first tick we save memory up to (…, si-1, si) and that memory has some relationship to sj state. During the second tick sj state changes its value and during the 3rd tick we copy the rest of the memory (si+1, …, sj-1, sj, sj+1, …). Now we see that the final memory dump is inconsistent:

(…, si-1, si, si+1, …, sj-1, sj, sj+1, …)

I explained this earlier in plain words in Inconsistent Dump pattern. Therefore we might consider a real memory dump as a direct sum of disjoint memory areas Mt taken during some time interval (t0, …, tn)

M = t Mt where Mt = k stk or simply

M = t k stk

- Dmitry Vostokov @ DumpAnalysis.org -