Archive for the ‘Crash Dump Analysis’ Category

New SystemDump tool

Tuesday, September 12th, 2006

Not really new as it was previously called CtxBSOD v2.1 but was renamed to better show its purpose. In addition to renaming I added a command line option to dump a system remotely or from a command line locally without using its GUI interface. The main motivation for me to write this tool was the absence of similar tools for 64-bit Windows. SystemDump can dump a 64-bit server too! 

You can download it form Citrix support web site (requires free registration):

http://support.citrix.com/article/CTX111072

Main features:

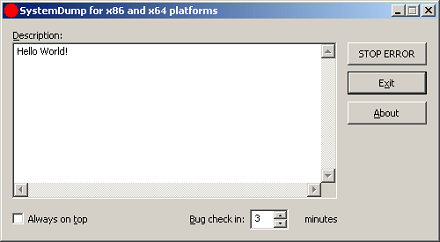
  • The tool has both GUI and command line interfaces.
  • You can type a message/text (or copy it from clipboard) before forcing a memory dump. This message is saved in a dump and a support engineer can read it after loading the dump in WinDbg.exe. This is implemented to encourage writing the symptoms and conditions explaining why the dump has to be forced.
  • The tool can stay on top of any window (if you need this to quickly dump the server after a reproduction or during the process of an activity).
  • It is supplied with Program Database (PDB) symbols for the driver (32-bit and 64-bit) which is useful when you want to have all symbols present on the bugcheck thread.
  • The bugcheck clearly shows that the dump is manually generated.
  • The tool can force a memory dump on both 32-bit and 64-bit platforms.
  • Before forcing a fatal error on a server, the tool warns about potential damaging consequences: Users are disconnected and all the data which is not saved will be lost. It asks for a confirmation.
  • You can specify a period of time (in minutes) when to force a memory dump.

The latter feature is implemented entirely in kernel. Additional command that not covered in the article is

>SystemDump.exe abort

allows you to abort the action if you ran the tool using command line options.

I attached the UML component diagram showing the architecture of this tool. I recently developed a presentation about device drivers architecture and Citrix kernel drivers where I used this tool as one of examples.

systemdumparchitecture.jpg

- Dmitry Vostokov -

Deadlocks and critical sections

Sunday, September 10th, 2006

Still playing with WinDbg scripting and applying them to dump analysis. The following script will uncover deadlocks and critical section contention in user mode processes (including services) if you run it against complete memory dump:

$$
$$ List owned critical sections in user processes
$$
r $t0 = nt!PsActiveProcessHead
.for (r $t1 = poi(@$t0); (@$t1 != 0) & (@$t1 != @$t0); r $t1 = poi(@$t1))
{
    r? $t2 = #CONTAINING_RECORD(@$t1, nt!_EPROCESS, ActiveProcessLinks);
    .process @$t2
    .reload
    !ntsdexts.locks
}

To run it save in a file and use the following command in WinDbg: $$><script.txt 

- Dmitry Vostokov -

Getting most of my Pocket PC for Dump Analysis

Saturday, September 9th, 2006

I have two devices with Windows Mobile 5.0:

Acer n300

http://global.acer.com/products/pda/n300.htm

and mobile phone Mio A701

http://www.mio-tech.be/en/gps-navigation-products-a701-overview.htm

I bought them for debugging and testing my forthcoming product OpenTask Mobile 5.0 but found yet another use for Dump Analysis.

I frequently consult WinDbg help for ideas. I printed it to an HTML file and split it into 9 parts less then 1Mb each so Pocket IE on my devices can load them. And now I can read the help file while commuting to work, shopping around, walking or simply when my notebook is not accessible. 

- Dmitry Vostokov -

Need a dump? Common use cases

Saturday, September 9th, 2006

The most common scenarios technical support people encounter when facing the need to create a dump are:

  • Heap corruption

http://support.citrix.com/article/CTX104633

the article is applicable to any process, not only to Citrix IMA service

  • CPU spikes

http://support.citrix.com/article/CTX106110

  • No user dumps saved by Dr. Watson

http://support.citrix.com/article/CTX105888

  • Memory leak

http://support.citrix.com/article/CTX106970

the article is applicable to any process, not only to Citrix IMA service

  • Need a system dump from remote session? Use SystemDump (to get this tool you need to register on Citrix support web site - this is free) 

http://support.citrix.com/article/CTX111072

  • Got correct dump? Use Citrix DumpCheck (to get these utilities you need to register on Citrix support web site - this is free) 

http://support.citrix.com/article/CTX108825 (Explorer extension)

http://support.citrix.com/article/CTX108890 (Command line version)

- Dmitry Vostokov -

Dump Analysis forum

Saturday, September 9th, 2006

I couldn’t find any forum on Internet dedicated solely for dump analysis topics so I created it some time ago.  It is sponsored by me and free for everyone.

Recently I did some file tossing and it is now accessible directrly from www.dumpanalysis.org

- Dmitry Vostokov -

Exploring Kernel Memory Space Analyzer

Thursday, September 7th, 2006

It takes approximately 10 - 30 minutes to process an average 2Gb complete memory dump. After loading couple of dumps I found the following useful features so far:

  • You can save analysis tree in a file and open it later for further analysis (but you need to keep dump file too)
  • Wait chains might be useful. However the tool reports too many of them (608 in my dump). They are sorted by length so it might be useful in detecting lengthy chains
  • It also detects anomalous (corrupt) critical sections in user processes
  • It detects deadlocks (you don’t need to enable driver verifier and reboot the system to get a new dump)

I’m currently using this tool with every memory dump I get and will post interesting cases.

- Dmitry Vostokov -

Yet another WinDbg script

Thursday, September 7th, 2006

I got a dump with 30 IE processes running and I want to find the only one waiting for a specific function. I know there is one. The following script lists all processes and their stacks (of course, I already opened a log in WinDbg to save that huge amount of output):

$$
$$ List user processes and stacks
$$
r $t0 = nt!PsActiveProcessHead
.for (r $t1 = poi(@$t0); (@$t1 != 0) & (@$t1 != @$t0); r $t1 = poi(@$t1))
{
    r? $t2 = #CONTAINING_RECORD(@$t1, nt!_EPROCESS, ActiveProcessLinks);
    .process @$t2
    .reload
    !process @$t2
}

- Dmitry Vostokov -

Kernel Memory Space Analyzer

Wednesday, September 6th, 2006

Microsoft has released this tool to help analyze memory dumps. I’m currently evaluating it and post my opinion later. Seems to be pretty cool tool according to its description and PPT presentation which you can download here:

Kernel Memory Space Analyzer

You need to manually copy x86 folder from kktools to your Debugging Tools for Windows folder and run kanalyze.exe from there. Refer to PPT presentation for details.

- Dmitry Vostokov -

WinDbg scripts (first encounters)

Friday, August 25th, 2006

Faced with a dilemma: to write or not to write debugging extensions I looked at the possibility to try scripts.

After spending some hours I wrote the final version of my first script which can enumerate processes in a complete memory dump and output their command line.

You need to save the script below in a text file and use the following command to run it from WinDbg command prompt:  $$><script.txt

$$ WinDbg script to get process command line for all processes in complete memory dump
r $t0 = nt!PsActiveProcessHead
.for (r $t1 = poi(@$t0); (@$t1 != 0) & (@$t1 != @$t0);
       r $t1 = poi(@$t1))
{
   r? $t2 = #CONTAINING_RECORD(@$t1,
      nt!_EPROCESS, ActiveProcessLinks);
   .process @$t2
   .if (@$peb != 0)
   {
      .catch
      {
         r $t3 = @@c++(@$peb->ProcessParameters)
         r? $t4 =
              @@c++(&((_RTL_USER_PROCESS_PARAMETERS *)
              @$t3)->CommandLine)
         .printf "_EPROCESS: %N Command Line: %msu\n",
          @$t2, @$t4
      }
   }
}

- Dmitry Vostokov -

Crash Dump Analysis forum

Tuesday, August 22nd, 2006

Everything about crash dump analysis and debugging on Windows platforms

http://www.dumpanalysis.org/forum

My favourite question is about 8-byte atomic write on 32-bit platform

- Dmitry Vostokov -

Sending SMS messages via dumps

Thursday, August 17th, 2006

CtxBSOD v2.1 has just been published which allows you to crash your computer and embed a message in a dump. Dumps are becoming a universal medium of discourse between customers and support personnel. New plans are for developing DumpChat which will utilize Live debugging techniques :-)

http://support.citrix.com/article/CTX111072

  Sending SMS through BSOD channel

- Dmitry Vostokov -

Dump Analysis and Voice Recognition

Monday, August 14th, 2006

Being so tired of typing endless ‘!analyze -v’ one day an idea came to me about using Voice Recognition.

Taking advantage of spending 7 years in that field starting from 1992 and being the architect and designer/developer of the first pioneer speech recognition systems on Windows platforms (if you remember Covox and Voice Blaster - I was an employee there) VoiceMouse, JustVoice, SpeakingMouse, and recently my own project OpenTask I seriosly consider using this for Dump Analysis.  :-)

More later…

- Dmitry Vostokov -