.NET Managed Code Analysis in Complete Memory Dumps
Wednesday, May 28th, 2008While working on WDN book I noticed that it is possible to analyze managed code in complete memory dumps. We just need to switch to the process in question and load SOS DLL (if memory dumps are from 64-bit Windows we need to run 64-bit WinDbg because it needs to load 64-bit SOS from Microsoft.NET \ Framework64 \ vX.X.XXXXX folder).
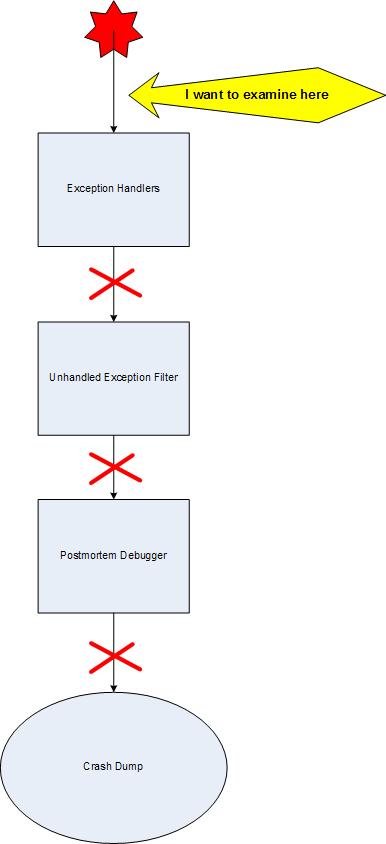
Here is some command output from a complete memory dump generated from SystemDump when running TestDefaultDebugger.NET application where we try to find and disassemble IL code for this function:
namespace WindowsApplication1

{

  public partial class Form1 : Form

  {

[...]

  private void button1_Click(object sender, EventArgs e)

  {

  System.Collections.Stack stack = new System.Collections.Stack();
stack.Pop();
}
}
}
Loading Dump File [C:\W2K3\MEMORY_NET.DMP]

Kernel Complete Dump File: Full address space is available
Symbol search path is: srv*c:\mss*http://msdl.microsoft.com/download/symbols

Executable search path is:

Windows Server 2003 Kernel Version 3790 (Service Pack 2) UP Free x64

Product: Server, suite: Enterprise TerminalServer

Built by: 3790.srv03_sp2_gdr.070321-2337

Kernel base = 0xfffff800`01000000 PsLoadedModuleList = 0xfffff800`01198b00
kd> !process 0 0

**** NT ACTIVE PROCESS DUMP ****

[...]

PROCESS fffffadfe7287610

    SessionId: 0  Cid: 0ad8    Peb: 7fffffdf000  ParentCid: 0acc

    DirBase: 12cd9000  ObjectTable: fffffa800163c260  HandleCount: 114.

    Image: TestDefaultDebugger.NET.exe
PROCESS fffffadfe67905a0

    SessionId: 0  Cid: 085c    Peb: 7fffffd4000  ParentCid: 0acc

    DirBase: 232e2000  ObjectTable: fffffa8000917e10  HandleCount:  55.

    Image: SystemDump.exe
kd> .process /r /p fffffadfe7287610

Implicit process is now fffffadf`e7287610

Loading User Symbols
kd> .loadby sos mscorwks
kd> !threads
ThreadCount: 2

UnstartedThread: 0

BackgroundThread: 1

PendingThread: 0

DeadThread: 0

Hosted Runtime: no

                                              PreEmptive                                                Lock

       ID OSID        ThreadOBJ     State   GC     GC Alloc Context                  Domain           Count APT Exception

       1  a94 0000000000161150      6020 Enabled  0000000000000000:0000000000000000 000000000014ccb0     0 STA

       2  604 00000000001688b0      b220 Enabled  0000000000000000:0000000000000000 000000000014ccb0     0 MTA (Finalizer)
kd> !process fffffadfe7287610 4

PROCESS fffffadfe7287610

    SessionId: 0  Cid: 0ad8    Peb: 7fffffdf000  ParentCid: 0acc

    DirBase: 12cd9000  ObjectTable: fffffa800163c260  HandleCount: 114.

    Image: TestDefaultDebugger.NET.exe
        THREAD fffffadfe668cbf0  Cid 0ad8.0a94  Teb: 000007fffffdd000 Win32Thread: fffff97ff4df2830 WAIT

        THREAD fffffadfe727e6d0  Cid 0ad8.0f54  Teb: 000007fffffdb000 Win32Thread: 0000000000000000 WAIT

        THREAD fffffadfe72d5bf0  Cid 0ad8.0604  Teb: 000007fffffd9000 Win32Thread: 0000000000000000 WAIT

        THREAD fffffadfe679cbf0  Cid 0ad8.06b0  Teb: 000007fffffd7000 Win32Thread: 0000000000000000 WAIT

        THREAD fffffadfe67d23d0  Cid 0ad8.0b74  Teb: 000007fffffd5000 Win32Thread: fffff97ff4b99010 WAIT
kd> !EEHeap -gc

Number of GC Heaps: 1

generation 0 starts at 0x0000000002a41030

generation 1 starts at 0x0000000002a41018

generation 2 starts at 0x0000000002a41000

ephemeral segment allocation context: (0x0000000002a8d528, 0x0000000002a8dfe8)

         segment            begin         allocated             size

00000000001a1260 0000064274e28f60  0000064274e5f610 0x00000000000366b0(222896)

00000000001a1070 000006427692ffe8  000006427695af20 0x000000000002af38(175928)

0000000000164f60 00000642787c7380  0000064278809150 0x0000000000041dd0(269776)

0000000002a40000 0000000002a41000  0000000002a8dfe8 0x000000000004cfe8(315368)

Large object heap starts at 0x0000000012a41000

         segment            begin         allocated             size

0000000012a40000 0000000012a41000  0000000012a4e738 0x000000000000d738(55096)

Total Size           0xfdad8(1039064)

------------------------------

GC Heap Size           0xfdad8(1039064)
kd> !gchandles

Bad MethodTable for Obj at 0000000002a7a7b8

Bad MethodTable for Obj at 0000000002a7a750

Bad MethodTable for Obj at 0000000002a445b0

GC Handle Statistics:

Strong Handles: 25

Pinned Handles: 7

Async Pinned Handles: 0

Ref Count Handles: 1

Weak Long Handles: 30

Weak Short Handles: 63

Other Handles: 0

Statistics:

              MT    Count    TotalSize Class Name

[...]

0000064280016580        1          464 WindowsApplication1.Form1

[…]
kd> !dumpmt -md 0000064280016580

EEClass: 0000064280143578

Module: 0000064280012e00

Name: WindowsApplication1.Form1

mdToken: 02000002  (C:\TestDefaultDebugger.NET.exe)

BaseSize: 0×1d0

ComponentSize: 0×0

Number of IFaces in IFaceMap: 15

Slots in VTable: 375

————————————–

MethodDesc Table

           Entry       MethodDesc      JIT Name

[…]

0000064280150208 00000642800164d0      JIT WindowsApplication1.Form1.InitializeComponent()

0000064280150210 00000642800164e0      JIT WindowsApplication1.Form1..ctor()

0000064280150218 00000642800164f0     NONE WindowsApplication1.Form1.button1_Click(System.Object, System.EventArgs)
kd> !dumpil 00000642800164f0

ilAddr = 00000000004021bc

IL_0000: newobj System.Collections.Stack::.ctor

IL_0005: stloc.0

IL_0006: ldloc.0

IL_0007: callvirt System.Collections.Stack::Pop

IL_000c: pop

IL_000d: ret
- Dmitry Vostokov @ DumpAnalysis.org -