Archive for the ‘Crash Dump Analysis’ Category

Crash Dump Analysis Patterns (Part 109)

Friday, October 8th, 2010

This pattern is called Invalid Exception Information and shows how to recognize it and get a stack trace right when a debugger is not able to locate a crash point. For example, WinDbg default analysis command is not able to locate the exception context for a crash and provides a heuristic stack trace:

0:000> !analyze -v

[...]

EXCEPTION_RECORD:  001150fc -- (.exr 0x1150fc)
ExceptionAddress: 7c7e2afb (kernel32!RaiseException+0x00000053)
   ExceptionCode: 0eedfade
  ExceptionFlags: 00000001
NumberParameters: 7
   Parameter[0]: 0098fa49
   Parameter[1]: 0374c200
   Parameter[2]: 00000000
   Parameter[3]: 005919b4
   Parameter[4]: 01d80010
   Parameter[5]: 00115704
   Parameter[6]: 001154a4

[...]

CONTEXT:  0012ffb4 — (.cxr 0×12ffb4)
eax=00000000 ebx=00000000 ecx=0000019c edx=00000214 esi=00000000 edi=00000000
eip=000003b0 esp=000002d8 ebp=2d59495b iopl=0 nv up ei ng zr na pe nc
cs=0032 ss=0010 ds=0002 es=0000 fs=0000 gs=0000 efl=000003e4
0032:000003b0 ??              ???

[...]

STACK_TEXT: 
7c910328 ntdll!`string'+0x4
7c7db7d0 kernel32!ConsoleApp+0xe
7c7db7a4 kernel32!ConDllInitialize+0x20f
7c7db7b9 kernel32!ConDllInitialize+0x224
7c915239 ntdll!bsearch+0x42
7c91542b ntdll!RtlpLocateActivationContextSection+0x15a
7c915474 ntdll!RtlpCompareActivationContextDataTOCEntryById+0x0
7c916104 ntdll!RtlpFindUnicodeStringInSection+0x23d
7c91534a ntdll!RtlpFindNextActivationContextSection+0x61
7c915742 ntdll!RtlFindNextActivationContextSection+0x46
7c9155ed ntdll!RtlFindActivationContextSectionString+0xde
7c915ce9 ntdll!RtlDecodeSystemPointer+0x9e7
7c915d47 ntdll!RtlDecodeSystemPointer+0xb0b
7c9158ff ntdll!RtlDecodeSystemPointer+0x45b
7c915bf8 ntdll!RtlDosApplyFileIsolationRedirection_Ustr+0x346
7c915c5d ntdll!RtlDosApplyFileIsolationRedirection_Ustr+0x3de
7c97e214 ntdll!DllExtension+0xc
00800000 ApplicationA+0x400000
7c910000 ntdll!RtlFreeHeap+0x1a4
7c914a53 ntdll!LdrLockLoaderLock+0x146
7c912d04 ntdll!LdrLockLoaderLock+0x1d2
7c912d71 ntdll!LdrUnlockLoaderLock+0x88
7c916768 ntdll!LdrGetDllHandleEx+0xc9
7c912d80 ntdll!`string'+0x84
7c91690e ntdll!LdrGetDllHandleEx+0x2f1
7c912d78 ntdll!LdrUnlockLoaderLock+0xb1
7c97ecc0 ntdll!LdrpHotpatchCount+0x8
7c9167e8 ntdll!`string'+0xc4
7c9168d6 ntdll!LdrGetDllHandleEx+0x2de
7c9166b8 ntdll!LdrGetDllHandle+0x18
7c7de534 kernel32!GetModuleHandleForUnicodeString+0x1d
7c7de544 kernel32!GetModuleHandleForUnicodeString+0xa0
7c7de64b kernel32!BasepGetModuleHandleExW+0x18e
7c7de6cb kernel32!BasepGetModuleHandleExW+0x250
79000000 mscoree!_imp__EnterCriticalSection <PERF> +0x0
7c809ad8 kernel32!_except_handler3+0x0
7c7de548 kernel32!`string'+0x28
79002280 mscoree!`string'+0x0
02080000 xpsp2res+0xc0000
7c7db6d4 kernel32!_BaseDllInitialize+0x7a
7c7db6e9 kernel32!_BaseDllInitialize+0x488
7c917ef3 ntdll!LdrpSnapThunk+0xbd
7c9048b8 ntdll!$$VProc_ImageExportDirectory+0x14b8
7c9000d0 ntdll!RtlDosPathSeperatorsString <PERF> +0x0
7c905d48 ntdll!$$VProc_ImageExportDirectory+0x2948
7c910228 ntdll!RtlpRunTable+0x448
7c910222 ntdll!RtlpAllocateFromHeapLookaside+0x42
7c911086 ntdll!RtlAllocateHeap+0x43d
7c903400 ntdll!$$VProc_ImageExportDirectory+0x0
7c7d9036 kernel32!$$VProc_ImageExportDirectory+0x6a0a
791c6f2d mscorwks!DllMain+0x117
7c917e10 ntdll!`string'+0xc
7c918047 ntdll!LdrpSnapThunk+0x317
7c7d00f0 kernel32!_imp___wcsnicmp <PERF> +0x0
7c7d903c kernel32!$$VProc_ImageExportDirectory+0x6a10
7c917dba ntdll!LdrpGetProcedureAddress+0x186
7c900000 ntdll!RtlDosPathSeperatorsString <PERF> +0x0
7c917e5f ntdll!LdrpGetProcedureAddress+0x29b
7c7d262c kernel32!$$VProc_ImageExportDirectory+0x0
7c7d0000 kernel32!_imp___wcsnicmp <PERF> +0x0
79513870 mscorsn!DllMain+0x119
7c913425 ntdll!RtlDecodePointer+0x0
00726574 ApplicationA+0x326574
7c917e09 ntdll!LdrpGetProcedureAddress+0xa6
7c917ec0 ntdll!LdrGetProcedureAddress+0x18
7c9101e0 ntdll!CheckHeapFillPattern+0x54
7c9101db ntdll!RtlAllocateHeap+0xeac
40ae17ea msxml6!calloc+0xa9
40ae181f msxml6!calloc+0xde
40a30000 msxml6!_imp__OpenThreadToken <PERF> +0x0
7c910323 ntdll!RtlpImageNtHeader+0x56
7c910385 ntdll!RtlImageDirectoryEntryToData+0x57
00400100 ApplicationA+0x100
7c928595 ntdll!LdrpCallTlsInitializers+0x1d
00400000 ApplicationA+0x0
7c9285c7 ntdll!LdrpCallTlsInitializers+0xd8
7c90118a ntdll!LdrpCallInitRoutine+0x14
00a23010 ApplicationA+0x623010
7c9285d0 ntdll!`string'+0x18
7c935e24 ntdll!LdrpInitializeThread+0x147
7c91b1b7 ntdll!LdrpInitializeThread+0x13b
778e159a SETUPAPI!_DllMainCRTStartup+0x0
7c91b100 ntdll!`string'+0x88
7c91b0a4 ntdll!_LdrpInitialize+0x25b
7c90de9a ntdll!NtTestAlert+0xc
7c91b030 ntdll!`string'+0xc8
7c91b02a ntdll!_LdrpInitialize+0x246
7c90d06a ntdll!NtContinue+0xc
7c90e45f ntdll!KiUserApcDispatcher+0xf
00780010 ApplicationA+0x380010
7c951e13 ntdll!DbgUiRemoteBreakin+0x0
7c97e178 ntdll!LdrpLoaderLock+0x0
00d10000 ApplicationA+0x910000
7c951e40 ntdll!DbgUiRemoteBreakin+0x2d
7c90e920 ntdll!_except_handler3+0x0
7c951e60 ntdll!`string'+0x7c

Compare our invalid context data with the normal one having good efl and segment register values:

cs=0023 ss=002b ds=002b es=002b fs=0053 gs=002b efl=00010206

We look at our stack trace after resetting context and using kv command. We see that KiUserExceptionDispatcher has the valid exception context but exception pointers for UnhandledExceptionFilter are not valid:

0:000> .ecxr

0:000> kv
ChildEBP RetAddr  Args to Child             
001132d0 7c90df4a 7c7d9590 00000002 001132fc ntdll!KiFastSystemCallRet
001132d4 7c7d9590 00000002 001132fc 00000001 ntdll!ZwWaitForMultipleObjects+0xc
00113370 7c7da115 00000002 001134a0 00000000 kernel32!WaitForMultipleObjectsEx+0x12c
0011338c 6993763c 00000002 001134a0 00000000 kernel32!WaitForMultipleObjects+0x18
00113d20 699382b1 00115018 00000001 00198312 faultrep!StartDWException+0x5df
00114d94 7c834526 00115018 00000001 00000000 faultrep!ReportFault+0x533
00115008 0040550c 00115018 7c9032a8 001150fc kernel32!UnhandledExceptionFilter+0×55b
WARNING: Stack unwind information not available. Following frames may be wrong.
00115034 7c90327a 001150fc 0012ffb4 0011512c ApplicationA+0×550c
001150e4 7c90e48a 00000000 0011512c 001150fc ntdll!ExecuteHandler+0×24
001150e4 7c7e2afb 00000000 0011512c 001150fc ntdll!KiUserExceptionDispatcher+0xe (CONTEXT @ 0011512c)
0011544c 0057ac37 0eedfade 00000001 00000007 kernel32!RaiseException+0×53
00115470 0098fa49 0eedfade 00000001 00000007 ApplicationA+0×17ac37
[…]
0012268c 7e398816 017d0f87 000607e8 0000001a USER32!InternalCallWinProc+0×28
001226f4 7e3a8ea0 00000000 017d0f87 000607e8 USER32!UserCallWinProcCheckWow+0×150

0:000> dd 00115018 L4
00115018  001150fc 0012ffb4 0011512c 001150d0

So we use the valid context pointer now:

0:000> .cxr 0011512c
eax=001153fc ebx=0eedfade ecx=00000000 edx=001537a8 esi=001154a4 edi=00000007
eip=7c7e2afb esp=001153f8 ebp=0011544c iopl=0         nv up ei pl nz na po nc
cs=001b  ss=0023  ds=0023  es=0023  fs=003b  gs=0000             efl=00200202
kernel32!RaiseException+0×53:
7c7e2afb 5e              pop     esi

0:000> kv
  *** Stack trace for last set context - .thread/.cxr resets it
ChildEBP RetAddr  Args to Child             
0011544c 0057ac37 0eedfade 00000001 00000007 kernel32!RaiseException+0x53
WARNING: Stack unwind information not available. Following frames may be wrong.
00115470 0098fa49 0eedfade 00000001 00000007 ApplicationA+0x17ac37
[...]
0012268c 7e398816 017d0f87 000607e8 0000001a USER32!InternalCallWinProc+0x28
001226f4 7e3a8ea0 00000000 017d0f87 000607e8 USER32!UserCallWinProcCheckWow+0x150
00122748 7e3aacd1 00fd2ad0 0000001a 00000000 USER32!DispatchClientMessage+0xa3
00122778 7c90e473 00122788 00000030 00000030 USER32!__fnINSTRING+0x37
001227b4 7e3993e9 7e3993a8 00122840 00000000 ntdll!KiUserCallbackDispatcher+0x13
001227e0 7e3aa43b 00122840 00000000 00000000 USER32!NtUserPeekMessage+0xc
0012280c 004794d9 00122840 00000000 00000000 USER32!PeekMessageA+0xeb
001228bc 00461667 0012ff7c 00461680 001228e0 ApplicationA+0x794d9
[...]

- Dmitry Vostokov @ DumpAnalysis.org + TraceAnalysis.org -

Notation for Memory and Trace Analysis (Part 1)

Thursday, October 7th, 2010

It is time now to introduce a syntactical notation for memory (dump) and software trace analysis pattern languages (in addition to graphical notation proposed earlier). It should be simple and concise: allow easy grammar with plain syntax and obvious reading semantics. We propose to use capitalized letters for major pattern categories, for example, W for wait chains and D for deadlocks. Then use subscripts (or small letters) for pattern subcategories, for example, Wcs and Dlpc. Several categories and subcategories can be combined by using slash (/), for example, Wcs/Dcs/lpc. Slash notation is better viewed using subscripts:

Wcs/Dcs/lpc

Next part will introduce more categories and propose notational adornments for pattern succession, space differentiation and the inclusion of details in notational sentences.

- Dmitry Vostokov @ DumpAnalysis.org + TraceAnalysis.org -

Icons for Memory Dump Analysis Patterns (Part 78)

Wednesday, October 6th, 2010

Today we introduce an icon for No System Dumps pattern:

B/W

Color

- Dmitry Vostokov @ DumpAnalysis.org + TraceAnalysis.org -

Forthcoming Webinars in Q4, 2010

Tuesday, October 5th, 2010

The choice of webinars below mostly reflects my personal preferences and long time desire to speak on topics like systems thinking, troubleshooting tool design and development. The other topic about BSOD minidump analysis was requested by participants in an ongoing survey. There will be more topics in 2011. All forthcoming webinars will be hosted by Memory Dump Analysis Services. The planning list includes:

Systems Thinking in Memory Dump and Software Trace Analysis

Software Troubleshooting and Debugging Tools: Objects, Components, Patterns and Frameworks with UML

  • UML basics
  • DebugWare patterns
  • Unified Troubleshooting Framework
  • RADII software development process
  • Hands-on exercise: designing and building a tool

Blue Screen Of Death Analysis Done Right: Minidump Investigation for System Administrators

  • Making sense of !analyze –v output
  • Get extra troubleshooting information with additional WinDbg commands
  • Guessing culprits with raw stack analysis
  • Who’s responsible: hardware or software?
  • Checklist and patterns
  • Including hands-on exercises: send your own minidumps

More detailed information will be available soon. 

- Dmitry Vostokov @ DumpAnalysis.org + TraceAnalysis.org -

Check the name of your driver in reverse

Monday, October 4th, 2010

Don’t name your driver a “Missile” blog post dealt with funny names seen in crash dumps. However, even innocuous driver names may occasionally provoke a laughter from people in the know. For example, SGUB32.SYS can be read 23BUGS in reverse. My recent encounter is a print driver SGNUD64.dll where we read 46DUNGS in reverse. Don’t rush to Google the name to find ISV, it was modified to avoid an engineering embarrassment, although a dung was really there :-)

- Dmitry Vostokov @ DumpAnalysis.org + TraceAnalysis.org -

Chance Exceptions in A Turing Machine

Monday, October 4th, 2010

This is an image fragment from the front cover of the forthcoming Debugged! MZ/PE December issue:

- Dmitry Vostokov @ DumpAnalysis.org + TraceAnalysis.org -

Crash Dump Analysis Patterns (Part 108)

Monday, October 4th, 2010

It is a common technique in driver development to copy/paste an entire driver sample from WDK and modify it for a specific device or a filter value-adding functionality in a specific driver stack or framework. The problem here is that developers sometimes forget to change module resources and certain amount of detective work is required to find out the module vendor. I call this pattern Template Module. Here is an example. In a spooler service there were many threads blocked in displaying a dialog box:

0:000> ~34kL 100
Child-SP          RetAddr           Call Site
00000000`08a49368 00000000`774c5118 user32!NtUserWaitMessage+0xa
00000000`08a49370 00000000`774c5770 user32!DialogBox2+0x261
00000000`08a493f0 00000000`774c57e6 user32!InternalDialogBox+0x134
00000000`08a49450 00000000`774c3e36 user32!DialogBoxIndirectParamAorW+0x58
00000000`08a49490 000007fe`fa27cc97 user32!DialogBoxParamW+0x66
00000000`08a494d0 000007fe`fa28832b unidrvui!ICheckConstraintsDlg+0xbf
00000000`08a49950 000007fe`fa29423d unidrvui!BUpdateUISettingForOEM+0x2f
00000000`08a49980 00000000`50036d2c unidrvui!CPrintOemDriverUI::DrvUpdateUISetting+0x1d
00000000`08a499b0 00000000`50038a1d ModuleZ!DllGetClassObject+0×1fe74
[…]
00000000`08a4b250 000007fe`f759546b unidrvui!OEMDevicePropertySheets+0×56
00000000`08a4b280 000007fe`f759653e compstui!CallpfnPSUI+0×137
00000000`08a4b330 000007fe`f7596b84 compstui!InsertPSUIPage+0×24a
00000000`08a4b5f0 000007fe`fa2880e9 compstui!CPSUICallBack+0×3ec
00000000`08a4b6a0 000007fe`fa2836c4 unidrvui!BAddOemPluginPages+0×12d
00000000`08a4b6d0 000007fe`f759546b unidrvui!DrvDevicePropertySheets+0×2c8
00000000`08a4bb60 000007fe`f759653e compstui!CallpfnPSUI+0×137
00000000`08a4bc10 000007fe`f7596b84 compstui!InsertPSUIPage+0×24a
00000000`08a4bed0 000007fe`fb452838 compstui!CPSUICallBack+0×3ec
00000000`08a4bf80 000007fe`f759546b winspool!DevicePropertySheets+0×108
00000000`08a4bfb0 000007fe`f759653e compstui!CallpfnPSUI+0×137
00000000`08a4c060 000007fe`f7596b84 compstui!InsertPSUIPage+0×24a
00000000`08a4c320 000007fe`f759758e compstui!CPSUICallBack+0×3ec
00000000`08a4c3d0 000007fe`f75976b2 compstui!DoCommonPropertySheetUI+0xbe
00000000`08a4c430 000007fe`fb446339 compstui!CommonPropertySheetUIW+0xe
00000000`08a4c470 000007fe`fb44b425 winspool!CallCommonPropertySheetUI+0×65
00000000`08a4c4c0 00000000`5003623c winspool!PrinterPropertiesNative+0×121
00000000`08a4c950 00000000`50035d16 ModuleZ!DllGetClassObject+0×1f384
[…]
00000000`08a4dd70 000007fe`fb4472d8 unidrvui!DrvPrinterEvent+0×419
00000000`08a4de00 000007fe`fb44737f winspool!SpoolerPrinterEventNative+0×84
00000000`08a4de60 000007fe`faedc957 winspool!SpoolerPrinterEvent+0×13
00000000`08a4dea0 000007fe`faedc8c7 localspl!SplDriverEvent+0×4f
00000000`08a4def0 000007fe`faec3d74 localspl!PrinterDriverEvent+0xcf
00000000`08a4df30 000007fe`fa771f20 localspl!SplAddPrinter+0xae0
00000000`08a4e4e0 000007fe`fa7491d8 win32spl!NCSRCommon::TLocalPrinter::AddPrinterW+0xb4
00000000`08a4e5b0 000007fe`fa747511 win32spl!TPrintOpen::AddLocalPrinter+0xb8
00000000`08a4e6b0 000007fe`fa746dfb win32spl!TPrintOpen::AddAndInstallLocalPrinter+0×34d
00000000`08a4e830 000007fe`fa746bb0 win32spl!TPrintOpen::ReEstablishCacheConnectionNoGuidPrinter+0×157
00000000`08a4e900 000007fe`fa7467d1 win32spl!TPrintOpen::ReEstablishCacheConnection+0×178
00000000`08a4e980 000007fe`fa7465c1 win32spl!TPrintOpen::ReEstablishPrinterConnection+0×16d
00000000`08a4ea30 000007fe`fa73e5ad win32spl!TPrintOpen::ReEstablishConnectionFromKey+0×1fd
00000000`08a4eb30 000007fe`fa733492 win32spl!TPrintOpen::RediscoverPrinterConnections+0xd7
00000000`08a4ebe0 000007fe`fb3f2332 win32spl!TPrintProviderTable::forwardEnumPrinters+0×47
00000000`08a4ec70 00000000`ff3414c8 spoolss!EnumPrintersW+0×176
00000000`08a4ed20 00000000`ff3413cc spoolsv!YEnumPrinters+0×112
00000000`08a4eda0 000007fe`fe225ec5 spoolsv!RpcEnumPrinters+0×30
00000000`08a4edf0 000007fe`fe2bebed rpcrt4!Invoke+0×65
00000000`08a4ee70 000007fe`fe1f5df0 rpcrt4!Ndr64StubWorker+0×5a9
00000000`08a4f440 000007fe`fe2268d4 rpcrt4!NdrServerCallAll+0×40
00000000`08a4f490 000007fe`fe2269f0 rpcrt4!DispatchToStubInCNoAvrf+0×14
00000000`08a4f4c0 000007fe`fe227402 rpcrt4!RPC_INTERFACE::DispatchToStubWorker+0×100
00000000`08a4f5b0 000007fe`fe227080 rpcrt4!LRPC_SCALL::DispatchRequest+0×1c2
00000000`08a4f620 000007fe`fe2262bb rpcrt4!LRPC_SCALL::HandleRequest+0×200
00000000`08a4f740 000007fe`fe225e1a rpcrt4!LRPC_ADDRESS::ProcessIO+0×44a
00000000`08a4f860 000007fe`fe207769 rpcrt4!LOADABLE_TRANSPORT::ProcessIOEvents+0×24a
00000000`08a4f910 000007fe`fe207714 rpcrt4!ProcessIOEventsWrapper+0×9
00000000`08a4f940 000007fe`fe2077a4 rpcrt4!BaseCachedThreadRoutine+0×94
00000000`08a4f980 00000000`7758be3d rpcrt4!ThreadStartRoutine+0×24
00000000`08a4f9b0 00000000`776c6a51 kernel32!BaseThreadInitThunk+0xd
00000000`08a4f9e0 00000000`00000000 ntdll!RtlUserThreadStart+0×1d

We suspect ModuleZ but its module information points to Microsoft: 

0:000> lmv m ModuleZ
start             end                 module name
00000000`50000000 00000000`500a4000   ModuleZ   (export symbols)       ModuleZ.DLL
    Loaded symbol image file: ModuleZ.DLL
    Image path: C:\Windows\System32\spool\drivers\x64\3\ModuleZ.DLL
    Image name: ModuleZ.DLL
    Timestamp:        Feb […] 2010
    […]
    File version:     2.5.0.0
    Product version:  2.5.0.0
    File flags:       0 (Mask 3F)
    File OS:          40004 NT Win32
    File type:        2.0 Dll
    File date:        00000000.00000000
    Translations:     0407.04b0
    CompanyName:      Microsoft Corp.
    ProductName:      Microsoft PS UI Replacement Sample

    InternalName:     PSUIREP
    OriginalFilename: PSUIREP.dll
    ProductVersion:   2.5
    FileVersion:      2.5.0.0
    FileDescription:  PS UI Replacement Sample
    LegalCopyright:   Copyright © 1998 - 2009 Microsoft Corp.
    LegalTrademarks:  Microsoft® is a registered trademark of Microsoft Corporation. Windows(TM) is a trademark of Microsoft Corporation

    Comments:         Written by Windows Printing & Imaging Team

Having never seen ModuleZ in Microsoft module lists and suspecting the word “Sample” in a file and product description we did Internet search and found the module name on various “DLL fixing” websites but still pointing to Microsoft in module description. However, in a full module list (lmt WinDbg command) we found more modules having Module* name structure:

0:000> lmv m ModuleC
start             end                 module name
00000000`10000000 00000000`100b7000   ModuleC   (deferred)            
    Image path: C:\Windows\System32\spool\drivers\x64\3\ModuleC.DLL
    Image name: ModuleC.DLL
    Timestamp:        Feb […] 2010
    […]
    File version:     20.1.0.0
    Product version:  20.1.0.0
    File flags:       0 (Mask 17)
    File OS:          4 Unknown Win32
    File type:        2.0 Dll
    File date:        00000000.00000000
    Translations:     0409.04b0
    CompanyName:      
    ProductName:      Printer Driver
    InternalName:     MC.dll
    OriginalFilename: MC.dll
    ProductVersion:   20.1.0.0
    FileVersion:      20.1.0.0
    FileDescription:  Printer Driver
    LegalCopyright:
   

0:000> lmv m ModuleO
start             end                 module name
00000000`6f280000 00000000`6f2e2000   ModuleO   (deferred)            
    Image path: C:\Windows\System32\spool\drivers\x64\3\ModuleO.DLL
    Image name: ModuleO.DLL
    Timestamp:        Feb […] 2010
    […]
    File version:     2.4.0.0
    Product version:  2.4.0.0
    File flags:       8 (Mask 3F) Private
    File OS:          40004 NT Win32
    File type:        3.1 Driver
    File date:        00000000.00000000
    Translations:     0409.04b0
    CompanyName:      CompanyA
    ProductName:      CompanyA Printer driver

    InternalName:     ModuleO.dll
    OriginalFilename: ModuleO.dll
    ProductVersion:   2.4
    FileVersion:      2.4.0.0
    FileDescription:  CompanyA Printer driver
    LegalCopyright:   Copyright © CompanyA

    Comments:
        

We see that both module names and time stamps follow the same pattern so our “Microsoft” ModuleZ is definitely from CompanyA instead. We also check more detailed information:

0:000> !lmi 00000000`50000000
Loaded Module Info: [00000000`50000000]
         Module: ModuleZ
[...]
               Pdb: N:\ServerQ\[…]
[…]

0:000> !lmi 00000000`10000000
Loaded Module Info: [00000000`10000000]
         Module: ModuleC
[...]
               Pdb: N:\ServerQ\[…]
[…]

0:000> !lmi 00000000`6f280000
Loaded Module Info: [00000000`6f280000]
         Module: ModuleO
[...]
               Pdb: N:\ServerQ\[…]
[…]

All three modules have the same build server in their PDB file name path. We advised to contact CompanyA for updates.

- Dmitry Vostokov @ DumpAnalysis.org + TraceAnalysis.org -

Bugtation No.128

Monday, October 4th, 2010

A Momentary Lapse of Computation.

Pink Floyd, A Momentary Lapse of Reason

- Dmitry Vostokov @ DumpAnalysis.org + TraceAnalysis.org -

Bugtation No.127

Monday, October 4th, 2010

The first bugtation where the source book title and the chapter number and name were bugtated too:

The engineer who has no tincture for memory dump analysis goes through life cycle imprisoned in the prejudices derived from coding… (The Problems of Computation. Chapter 0x5: The Value of Memory Dump Analysis)

Bertrand Russell, The Problems of Philosophy, Chapter XV: The Value of Philosophy

- Dmitry Vostokov @ DumpAnalysis.org + TraceAnalysis.org -

Structural Memory Patterns (Part 5)

Friday, October 1st, 2010

The next pattern is called Region Boundary. It is an inaccessible range of memory that surrounds Closed Memory Region. For example, the closed region of a kernel stack for the following thread has a one page boundary region next to its Base:

1: kd> !thread
THREAD fffffa8004544b60  Cid 0a6c.0acc  Teb: 000007fffffde000 Win32Thread: fffff900c1eb4010 RUNNING on processor 1
IRP List:
    fffffa8004d7e010: (0006,0118) Flags: 00060000  Mdl: 00000000
Not impersonating
DeviceMap                 fffff8a001e84c00
Owning Process            fffffa8004f68370       Image:         NotMyfault.exe
Attached Process          N/A            Image:         N/A
Wait Start TickCount      40290          Ticks: 0
Context Switch Count      408                 LargeStack
UserTime                  00:00:00.015
KernelTime                00:00:00.015
Win32 Start Address NotMyfault (0x0000000140002708)
Stack Init fffff8800587cdb0 Current fffff8800587c6f0
Base fffff8800587d000 Limit fffff88005874000 Call 0
[…]

1: kd> !pte fffff880`0587d000
                                           VA fffff8800587d000
PXE at FFFFF6FB7DBEDF88    PPE at FFFFF6FB7DBF1000    PDE at FFFFF6FB7E200160    PTE at FFFFF6FC4002C3E8
contains 0000000133D84863  contains 0000000133D83863  contains 00000000AA9AE863  contains 0000000000000000
pfn 133d84    ---DA--KWEV  pfn 133d83    ---DA--KWEV  pfn aa9ae     ---DA--KWEV  not valid

1: kd> !pte fffff880`0587d000+0n4096-1
  VA fffff8800587dfff
PXE at FFFFF6FB7DBEDF88 PPE at FFFFF6FB7DBF1000 PDE at FFFFF6FB7E200160 PTE at FFFFF6FC4002C3E8
contains 0000000133D84863 contains 0000000133D83863 contains 00000000AA9AE863 contains 0000000000000000
pfn 133d84 —DA–KWEV pfn 133d83 —DA–KWEV pfn aa9ae —DA–KWEV not valid

1: kd> !pte fffff880`0587d000+0n4096
                                           VA fffff8800587e000
PXE at FFFFF6FB7DBEDF88    PPE at FFFFF6FB7DBF1000    PDE at FFFFF6FB7E200160    PTE at FFFFF6FC4002C3F0
contains 0000000133D84863  contains 0000000133D83863  contains 00000000AA9AE863  contains 8000000028230963
pfn 133d84    —DA–KWEV  pfn 133d83    —DA–KWEV  pfn aa9ae     —DA–KWEV  pfn 28230     -G-DA–KW-V

The region after boundary belongs to another process thread kernel stack (I use CodeMachine WinDbg extension here):

1: kd> !cmkd.kvas  fffff8800587e000
kvas : Show region containing fffff8800587e000
### Start            End                                  Length Type   
006 fffff88000000000 fffff89fffffffff       2000000000 ( 128 GB) SystemPTEs
Thread FFFFFA80053D0B60 [0798.0a5c] Stack fffff88005884000 - fffff8800587e000

1: kd> !thread FFFFFA80053D0B60
THREAD fffffa80053d0b60  Cid 0798.0a5c  Teb: 000007fffffdd000 Win32Thread: 0000000000000000 WAIT: (DelayExecution) UserMode Non-Alertable
    fffffa80053d0f20  Semaphore Limit 0x1
Not impersonating
DeviceMap                 fffff8a001e84c00
Owning Process            fffffa80053ce630       Image:         ApplicationB.exe
Attached Process          N/A            Image:         N/A
Wait Start TickCount      34911          Ticks: 5379 (0:00:01:23.912)
Context Switch Count      22            
UserTime                  00:00:00.000
KernelTime                00:00:00.000
Win32 Start Address 0x000000013fe01538
Stack Init fffff88005883db0 Current fffff88005883970
Base fffff88005884000 Limit fffff8800587e000 Call 0
[…]

- Dmitry Vostokov @ DumpAnalysis.org + TraceAnalysis.org -

Structural Memory Patterns (Part 4)

Friday, October 1st, 2010

Now we propose the next group of general patterns related to memory regions (the terminology was partially influenced from topology). The first one we call Memory Region, for example:

1: kd> dp fffff88005875000 fffff88005875010
fffff880`05875000  039b5000`6e696268 00000000`00002000
fffff880`05875010  00000000`00000000

There are Open and Closed memory regions. We can extend the former ones in one or both directions:

1: kd> dp fffff88005875000-10 fffff88005875010+10
fffff880`05874ff0  6ab90c4f`039ba1b8 039b8050`fffffff8
fffff880`05875000  039b5000`6e696268 00000000`00002000
fffff880`05875010  00000000`00000000 00000000`00000000
fffff880`05875020  00000294`ffffffd0

The closed regions cannot be read past its boundary, like this kernel stack region [fffff880`05874000 fffff8800587d000):

1: kd> dp fffff88005874000-30
fffff880`05873fd0  ????????`???????? ????????`????????
fffff880`05873fe0  ????????`???????? ????????`????????
fffff880`05873ff0  ????????`???????? ????????`????????

fffff880`05874000  039ba000`6e696268 00000000`00001000
fffff880`05874010  00000000`00000000 00000000`00000000
fffff880`05874020  00206b6e`ffffffa8 01cae7bd`b8aca323
fffff880`05874030  039b6698`00000000 00000000`00000001
fffff880`05874040  ffffffff`039bafe8 039b6710`00000004

1: kd> dp fffff8800587d000-30
fffff880`0587cfd0  00000000`00000000 00000000`00000000
fffff880`0587cfe0  00000000`00000000 00000000`00000000
fffff880`0587cff0  00000000`00000000 00000000`00000000
fffff880`0587d000  ????????`???????? ????????`????????
fffff880`0587d010  ????????`???????? ????????`????????
fffff880`0587d020  ????????`???????? ????????`????????
fffff880`0587d030  ????????`???????? ????????`????????
fffff880`0587d040  ????????`???????? ????????`????????

- Dmitry Vostokov @ DumpAnalysis.org + TraceAnalysis.org -

An Exposé of the Debugging Industry (Part 0)

Thursday, September 30th, 2010

The title of these blog post series was motivated by a book I enjoyed reading this summer:

The Altenberg 16: An Exposé of the Evolution Industry

Finally, after thinking and keeping silence (this blog post was in draft folder for several months) I plan an interview next month for a start.

- Dmitry Vostokov @ DumpAnalysis.org + TraceAnalysis.org -

Inherit a fortune (Debugging Slang, Part 16)

Thursday, September 30th, 2010

Inherit a fortune - To get a postmortem artifact like a crash dump.

Examples:

- My program died!
- Did you inherit a fortune?
- Oh, yeah!

- Dmitry Vostokov @ DumpAnalysis.org + TraceAnalysis.org -

Microsoft Silently Introduces Micro Dumps

Thursday, September 30th, 2010

My April fool’s joke about the 5th dump type partially came true. I’ve just noticed the new tab “Silent Process Exit” in gflags.exe on my W2K8 R2 server:

The registry keys corresponding to settings are:

HKEY_LOCAL_MACHINE \ SOFTWARE \ Microsoft \ Windows NT \CurrentVersion \ SilentProcessExit
HKEY_LOCAL_MACHINE \ SOFTWARE \ Microsoft \ Windows NT \ CurrentVersion \ SilentProcessExit \ TestDefaultDebugger64
DumpType (DWORD) 0x88

I continue my investigation and report more later.

- Dmitry Vostokov @ DumpAnalysis.org + TraceAnalysis.org -

Icons for Memory Dump Analysis Patterns (Part 77)

Wednesday, September 29th, 2010

Today we introduce an icon for No Process Dumps pattern:

B/W

Color

- Dmitry Vostokov @ DumpAnalysis.org + TraceAnalysis.org -

Icons for Memory Dump Analysis Patterns (Part 76)

Tuesday, September 28th, 2010

Today we introduce an icon for Dispatch Level Spin pattern:

B/W

Color

- Dmitry Vostokov @ DumpAnalysis.org + TraceAnalysis.org -

Crash Dump Analysis Patterns (Part 107)

Monday, September 27th, 2010

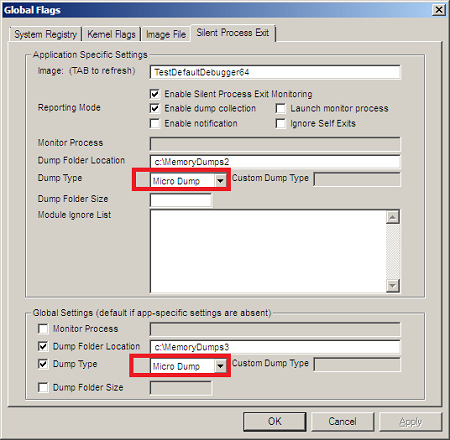
You are probably aware of Application and Driver Verifiers (including gflags.exe tool from Debugging Tools for Windows). These tools set flags that modify the behaviour of the system that is reflected in additional information being collected such as memory allocation history and in WinDbg output changes such as stack traces. These tools belong to a broad class of instrumentation tools and I call the analysis pattern Instrumentation Information. To check in a minidump, kernel and complete memory dumps whether Driver Verifier was enabled we use !verifier WinDbg command:

1: kd> !verifier

Verify Level 0 ... enabled options are:

Summary of All Verifier Statistics

RaiseIrqls                             0x0
AcquireSpinLocks                       0x0
Synch Executions                       0x0
Trims                                  0x0

Pool Allocations Attempted             0x0
Pool Allocations Succeeded             0x0
Pool Allocations Succeeded SpecialPool 0x0
Pool Allocations With NO TAG           0x0
Pool Allocations Failed                0x0
Resource Allocations Failed Deliberately   0x0

Current paged pool allocations         0x0 for 00000000 bytes
Peak paged pool allocations            0x0 for 00000000 bytes
Current nonpaged pool allocations      0x0 for 00000000 bytes
Peak nonpaged pool allocations         0x0 for 00000000 bytes

0: kd> !verifier

Verify Level 3 ... enabled options are:
       Special pool
       Special irql

Summary of All Verifier Statistics

RaiseIrqls                             0xdea5
AcquireSpinLocks                       0x87b5c
Synch Executions                       0x17b5
Trims                                  0xab36

Pool Allocations Attempted             0x8990e
Pool Allocations Succeeded             0x8990e
Pool Allocations Succeeded SpecialPool 0x29c0
Pool Allocations With NO TAG           0x1
Pool Allocations Failed                0x0
Resource Allocations Failed Deliberately   0x0

Current paged pool allocations         0x0 for 00000000 bytes
Peak paged pool allocations            0x0 for 00000000 bytes
Current nonpaged pool allocations      0x0 for 00000000 bytes
Peak nonpaged pool allocations         0x0 for 00000000 bytes
 

To check in a process user dump that Application Verifier (and gflags) was enabled use !avrf and !gflags WinDbg extension commands:

0:001> !avrf
Application verifier is not enabled for this process.
Page heap has been enabled separately.

0:001> !gflag
Current NtGlobalFlag contents: 0x02000000
    hpa - Place heap allocations at ends of pages

Here is an example of an instrumented stack trace:

68546e88 verifier!AVrfpDphFindBusyMemoryNoCheck+0xb8
68546f95 verifier!AVrfpDphFindBusyMemory+0×15
68547240 verifier!AVrfpDphFindBusyMemoryAndRemoveFromBusyList+0×20
68549080 verifier!AVrfDebugPageHeapFree+0×90

77190aac ntdll!RtlDebugFreeHeap+0×2f
7714a8ff ntdll!RtlpFreeHeap+0×5d
770f2a32 ntdll!RtlFreeHeap+0×142
75fb14d1 kernel32!HeapFree+0×14
748d4c39 msvcr80!free+0xcd
[…]
00a02bb2 ServiceA!ServiceMain+0×302
767175a8 sechost!ScSvcctrlThreadA+0×21
75fb3677 kernel32!BaseThreadInitThunk+0xe
770f9d42 ntdll!__RtlUserThreadStart+0×70
770f9d15 ntdll!_RtlUserThreadStart+0×1b

Another example that shows instrumentation difference. We run double free fault modeling application and see its stack trace from a crash dump:

0:000> !gflag
Current NtGlobalFlag contents: 0x00000000

0:000> kL 100
Child-SP          RetAddr           Call Site
00000000`002dec38 00000000`77735ce2 ntdll!NtWaitForSingleObject+0xa
00000000`002dec40 00000000`77735e85 ntdll!RtlReportExceptionEx+0x1d2
00000000`002ded30 00000000`77735eea ntdll!RtlReportException+0xb5
00000000`002dedb0 00000000`77736d25 ntdll!RtlpTerminateFailureFilter+0x1a
00000000`002dede0 00000000`77685148 ntdll!RtlReportCriticalFailure+0x96
00000000`002dee10 00000000`776a554d ntdll!_C_specific_handler+0x8c
00000000`002dee80 00000000`77685d1c ntdll!RtlpExecuteHandlerForException+0xd
00000000`002deeb0 00000000`776862ee ntdll!RtlDispatchException+0x3cb
00000000`002df590 00000000`77736cd2 ntdll!RtlRaiseException+0x221
00000000`002dfbd0 00000000`77737396 ntdll!RtlReportCriticalFailure+0x62
00000000`002dfca0 00000000`777386c2 ntdll!RtlpReportHeapFailure+0x26
00000000`002dfcd0 00000000`7773a0c4 ntdll!RtlpHeapHandleError+0x12
00000000`002dfd00 00000000`776dd1cd ntdll!RtlpLogHeapFailure+0xa4
00000000`002dfd30 00000000`77472c7a ntdll! ?? ::FNODOBFM::`string'+0x123b4
00000000`002dfdb0 00000000`6243c7bc kernel32!HeapFree+0xa
00000000`002dfde0 00000001`3f8f1033 msvcr90!free+0x1c
00000000`002dfe10 00000001`3f8f11f2 InstrumentedApp!wmain+0x33
00000000`002dfe50 00000000`7746f56d InstrumentedApp!__tmainCRTStartup+0x11a
00000000`002dfe80 00000000`776a3281 kernel32!BaseThreadInitThunk+0xd
00000000`002dfeb0 00000000`00000000 ntdll!RtlUserThreadStart+0x1d

Then we enable Application Verifier and full page heap in gflags.exe GUI. Actually 2 crash dumps are saved at the same time (we’d set up LocalDumps registry key on x64 W2K8 R2) with slightly different stack traces:

0:000> !gflag
Current NtGlobalFlag contents: 0x02000100
    vrf - Enable application verifier
    hpa - Place heap allocations at ends of pages

0:000> kL 100
Child-SP          RetAddr           Call Site
00000000`0022e438 00000000`77735ce2 ntdll!NtWaitForSingleObject+0xa
00000000`0022e440 00000000`77735e85 ntdll!RtlReportExceptionEx+0x1d2
00000000`0022e530 000007fe`f3ed26fb ntdll!RtlReportException+0xb5
00000000`0022e5b0 00000000`77688a8f verifier!AVrfpVectoredExceptionHandler+0×26b
00000000`0022e640 00000000`776859b2 ntdll!RtlpCallVectoredHandlers+0xa8
00000000`0022e6b0 00000000`776bfe48 ntdll!RtlDispatchException+0×22
00000000`0022ed90 000007fe`f3eca668 ntdll!KiUserExceptionDispatcher+0×2e
00000000`0022f350 000007fe`f3ec931d verifier!VerifierStopMessage+0×1f0
00000000`0022f400 000007fe`f3ec9736 verifier!AVrfpDphReportCorruptedBlock+0×155
00000000`0022f4c0 000007fe`f3ec99cd verifier!AVrfpDphCheckNormalHeapBlock+0xce
00000000`0022f530 000007fe`f3ec873a verifier!AVrfpDphNormalHeapFree+0×29
00000000`0022f560 00000000`7773c415 verifier!AVrfDebugPageHeapFree+0xb6

00000000`0022f5c0 00000000`776dd0fe ntdll!RtlDebugFreeHeap+0×35
00000000`0022f620 00000000`776c2075 ntdll! ?? ::FNODOBFM::`string’+0×122e2
00000000`0022f960 000007fe`f3edf4e1 ntdll!RtlFreeHeap+0×1a2
00000000`0022f9e0 00000000`77472c7a verifier!AVrfpRtlFreeHeap+0xa5
00000000`0022fa80 000007fe`f3ee09ae kernel32!HeapFree+0xa
00000000`0022fab0 00000000`642bc7bc verifier!AVrfpHeapFree+0xc6
00000000`0022fb40 00000001`3fac1033 msvcr90!free+0×1c
00000000`0022fb70 00000001`3fac11f2 InstrumentedApp!wmain+0×33
00000000`0022fbb0 00000000`7746f56d InstrumentedApp!__tmainCRTStartup+0×11a
00000000`0022fbe0 00000000`776a3281 kernel32!BaseThreadInitThunk+0xd
00000000`0022fc10 00000000`00000000 ntdll!RtlUserThreadStart+0×1d

0:000> kL 100
Child-SP          RetAddr           Call Site
00000000`0022e198 000007fe`f3ee0f82 ntdll!NtWaitForMultipleObjects+0xa
00000000`0022e1a0 000007fe`fd8513a6 verifier!AVrfpNtWaitForMultipleObjects+0×4e
00000000`0022e1e0 000007fe`f3ee0e2d KERNELBASE!WaitForMultipleObjectsEx+0xe8
00000000`0022e2e0 000007fe`f3ee0edd verifier!AVrfpWaitForMultipleObjectsExCommon+0xad
00000000`0022e320 00000000`77473143 verifier!AVrfpKernelbaseWaitForMultipleObjectsEx+0×2d

00000000`0022e370 00000000`774e9025 kernel32!WaitForMultipleObjectsExImplementation+0xb3
00000000`0022e400 00000000`774e91a7 kernel32!WerpReportFaultInternal+0×215
00000000`0022e4a0 00000000`774e91ff kernel32!WerpReportFault+0×77
00000000`0022e4d0 00000000`774e941c kernel32!BasepReportFault+0×1f
00000000`0022e500 00000000`7770573c kernel32!UnhandledExceptionFilter+0×1fc
00000000`0022e5e0 00000000`77685148 ntdll! ?? ::FNODOBFM::`string’+0×2365
00000000`0022e610 00000000`776a554d ntdll!_C_specific_handler+0×8c
00000000`0022e680 00000000`77685d1c ntdll!RtlpExecuteHandlerForException+0xd
00000000`0022e6b0 00000000`776bfe48 ntdll!RtlDispatchException+0×3cb
00000000`0022ed90 000007fe`f3eca668 ntdll!KiUserExceptionDispatcher+0×2e
00000000`0022f350 000007fe`f3ec931d verifier!VerifierStopMessage+0×1f0
00000000`0022f400 000007fe`f3ec9736 verifier!AVrfpDphReportCorruptedBlock+0×155
00000000`0022f4c0 000007fe`f3ec99cd verifier!AVrfpDphCheckNormalHeapBlock+0xce
00000000`0022f530 000007fe`f3ec873a verifier!AVrfpDphNormalHeapFree+0×29
00000000`0022f560 00000000`7773c415 verifier!AVrfDebugPageHeapFree+0xb6

00000000`0022f5c0 00000000`776dd0fe ntdll!RtlDebugFreeHeap+0×35
00000000`0022f620 00000000`776c2075 ntdll! ?? ::FNODOBFM::`string’+0×122e2
00000000`0022f960 000007fe`f3edf4e1 ntdll!RtlFreeHeap+0×1a2
00000000`0022f9e0 00000000`77472c7a verifier!AVrfpRtlFreeHeap+0xa5
00000000`0022fa80 000007fe`f3ee09ae kernel32!HeapFree+0xa
00000000`0022fab0 00000000`642bc7bc verifier!AVrfpHeapFree+0xc6
00000000`0022fb40 00000001`3fac1033 msvcr90!free+0×1c
00000000`0022fb70 00000001`3fac11f2 InstrumentedApp!wmain+0×33
00000000`0022fbb0 00000000`7746f56d InstrumentedApp!__tmainCRTStartup+0×11a
00000000`0022fbe0 00000000`776a3281 kernel32!BaseThreadInitThunk+0xd
00000000`0022fc10 00000000`00000000 ntdll!RtlUserThreadStart+0×1d

We also see above that enabling instrumentation triggers debug functions of runtime heap (RtlDebugFreeHeap).

- Dmitry Vostokov @ DumpAnalysis.org + TraceAnalysis.org -

General Memory Analysis

Monday, September 27th, 2010

General Memory Analysis is another name for Memoretics, a discipline that studies memory snapshots including their similarities and differences on different system platforms such as Windows, Linus, Mac OS X, embedded and mobile systems, historical architectures, etc. The analysis of memory helps solve problems in various domains such as software troubleshooting and debugging, computer forensic analysis, etc.

The current focus of interdisciplinary research is to build a unified memory pattern language that covers both behavioral and structural patterns and also to study the possibility of building memory systems from below, not from requirements -> architecture -> design -> implementation -> compilation -> linking -> loading -> execution but from directly modeling and assembling memory systems using memory patterns.

- Dmitry Vostokov @ DumpAnalysis.org + TraceAnalysis.org -

Structural Memory Patterns (Part 3)

Sunday, September 26th, 2010

The next pattern is called Snapshot Collection. This is a collection of files combined from either linear memory snapshots or aggregate snapshots saved as separate files at different times. Typical examples include:

  • Several process memory dump files saved sequentially from a growing heap leaking process
  • Several software traces from working and non-working scenarios for comparative analysis

- Dmitry Vostokov @ DumpAnalysis.org + TraceAnalysis.org -

Structural Memory Patterns (Part 2)

Sunday, September 26th, 2010

The next pattern is called Aggregate Snapshot. It is any memory dump or software trace file that is combined from Memory Snapshots. Typical examples include:

  • A minidump file where only specific memory ranges are included
  • A software trace file combined from structured memory snapshots

Note. I’ve also created a dedicated page to list all structural patterns: 

Structural Memory Analysis Patterns

- Dmitry Vostokov @ DumpAnalysis.org + TraceAnalysis.org -