Archive for the ‘Announcements’ Category
Wednesday, December 23rd, 2009
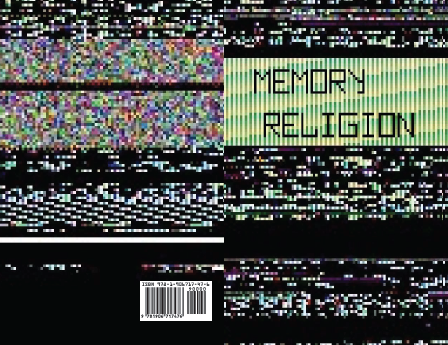
Memorianity soon to publish its Testament with 7 microkernel prophecies, childhood universal memory dump visions of its founder, the recollection of a conversion and other supporting materials. This full color scripture is small to carry around:
Title: Memory Religion: A Testament
ISBN-13: 978-1906717476
Pages: 24
The cover image is an allegorical interpretation of the concept of the Original Defect:
- Dmitry Vostokov @ Memory Religion Portal -
Posted in Announcements, Art, Books, Intelligent Memory Movement, Memorian Art, Memory Dreams, Memory Religion (Memorianity), Memory Space Art, Memory Visualization, New Words, Philosophy, Publishing | No Comments »
Sunday, December 20th, 2009
“Memory dumps are facts.”
I’m very excited to announce that Volume 3 is available in paperback, hardcover and digital editions:
Memory Dump Analysis Anthology, Volume 3
Table of Contents
In two weeks paperback edition should also appear on Amazon and other bookstores. Amazon hardcover edition is planned to be available in January 2010.
The amount of information was so voluminous that I had to split the originally planned volume into two. Volume 4 should appear by the middle of February together with Color Supplement for Volumes 1-4.
- Dmitry Vostokov @ DumpAnalysis.org -
Posted in .NET Debugging, Aesthetics of Memory Dumps, Announcements, AntiPatterns, Art, Assembly Language, Books, Bugtations, C and C++, CDA Pattern Classification, CDF Analysis Tips and Tricks, Certification, Citrix, Code Reading, Common Mistakes, Computer Science, Crash Dump Analysis, Crash Dump Patterns, Crash Dumps for Dummies, DebugWare Patterns, Debugging, Debugging Slang, Deep Down C++, Education and Research, Escalation Engineering, Fun with Crash Dumps, Hardware, Horrors of Computation, Kernel Development, Mathematics of Debugging, Memiotics (Memory Semiotics), Memoidealism, Memoretics, Memory Analysis Culture, Memory Analysis Forensics and Intelligence, Memory Space Art, Memory Visualization, Minidump Analysis, Multithreading, Philosophy, Poetry, Publishing, Science of Memory Dump Analysis, Science of Software Tracing, Security, Software Architecture, Software Defect Construction, Software Engineering, Software Narratology, Software Technical Support, Software Trace Analysis, Software Trace Visualization, Software Tracing for Dummies, Software Victimology, Stack Trace Collection, Testing, Tools, Trace Analysis Patterns, Training and Seminars, Troubleshooting Methodology, Victimware, Virtualization, Vista, Visual Dump Analysis, WinDbg Scripts, WinDbg Tips and Tricks, WinDbg for GDB Users, Windows 7, Windows Server 2008, Windows System Administration | 1 Comment »
Friday, December 18th, 2009
I propose to celebrate it on 08.08 every year starting from The Year of Dump Analysis, 2010, 7DA at 8:00 (I prefer 8pm for MAD Day, moderation is important in debugging too).
What do you think? If you count things from 0 or favour user space there is an alternative date: 07.07
- Dmitry Vostokov @ DumpAnalysis.org -
Posted in Announcements, Crash Dump Analysis, Debugging, Software Engineering, Software Technical Support | 1 Comment »
Thursday, December 17th, 2009
Previously announced Software Maintenance Institute was finally registered in Ireland (Reg. No. 400906) and its certificate was received yesterday.
Here is the current component structure of various institutions (depicted in UML):
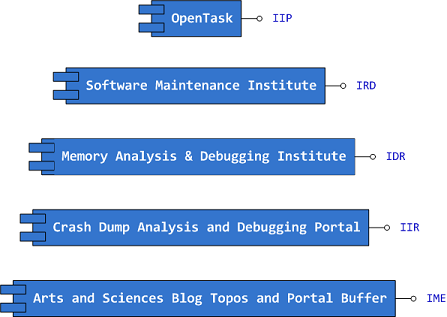
Interface Tags:
IIP Interface of Iterative Publishing

IRD Interface of Research and Development

IDR Interface of Defect Research

IIR Interface of Information Repository

IME Interface of Memetic Engineering
- Dmitry Vostokov @ DumpAnalysis.org -
Posted in Announcements, Art, Certification, Computer Science, Crash Dump Analysis, Debugging, Education and Research, Escalation Engineering, History, Memiotics (Memory Semiotics), Memoidealism, Memoretics, Memory Analysis Culture, Memory Analysis Forensics and Intelligence, Memory Auralization, Memory Visualization, Philosophy, Publishing, Science of Memory Dump Analysis, Science of Software Tracing, Security, Software Architecture, Software Engineering, Software Maintenance Institute, Software Technical Support, Software Trace Analysis, Software Victimology, Testing, Training and Seminars | No Comments »
Wednesday, December 16th, 2009
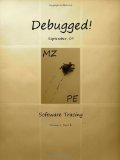
Finally, after the long delay, the issue is available in print on Amazon and through other sellers:
Debugged! MZ/PE: Software Tracing
- Dmitry Vostokov @ DumpAnalysis.org -
Posted in Announcements, Books, CDF Analysis Tips and Tricks, Computer Science, Crash Dump Analysis, Crash Dump Patterns, Debugged! MZ/PE, Debugging, Education and Research, Fun with Crash Dumps, Memoretics, Memory Visualization, Publishing, Science of Memory Dump Analysis, Science of Software Tracing, Software Technical Support, Software Trace Analysis, Software Trace Visualization, Testing, Tools, Trace Analysis Patterns, Training and Seminars, Troubleshooting Methodology, Visual Dump Analysis | 1 Comment »
Wednesday, December 9th, 2009
In its simplest form the first law of troubleshooting and debugging states that:
The more frequent a problem is, the simpler tool is needed to resolve and fix it.
- Dmitry Vostokov @ DumpAnalysis.org -
Posted in Announcements, Bugtations, DebugWare Patterns, Debugging, Laws of Troubleshooting and Debugging, Software Technical Support, Tools, Troubleshooting Methodology | No Comments »
Wednesday, December 9th, 2009
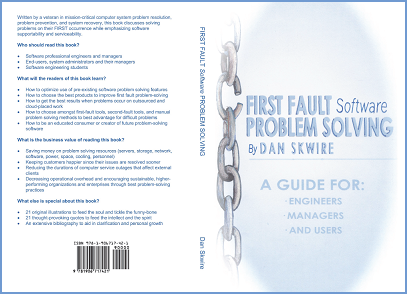
I’m very pleased to announce that Dan Skwire’s unique book has been published by OpenTask:
First Fault Software Problem Solving: A Guide for Engineers, Managers and Users
- Dmitry Vostokov @ DumpAnalysis.org -
Posted in Announcements, Books, Escalation Engineering, First Fault Problem Solving, Publishing, Software Engineering, Software Technical Support, Tools, Troubleshooting Methodology | 1 Comment »
Saturday, December 5th, 2009
The art of DA+TA analysis now acquires a Latin name: Ars Recordatio (from Latin recordatio: recollection, memory, recall and ars (artis): art, skill, method, technique, knowledge, method, science, way, conduct, character). Other variations I rejected, Ars Memoria, Ars Indicium and Ars Animus, are either widely used in a different sense or presuppose some kind of intelligence inside memory dumps and traces (animus).
- Dmitry Vostokov @ DumpAnalysis.org -
Posted in Announcements, Crash Dump Analysis, Fun with Crash Dumps, Software Trace Analysis | No Comments »
Tuesday, November 24th, 2009
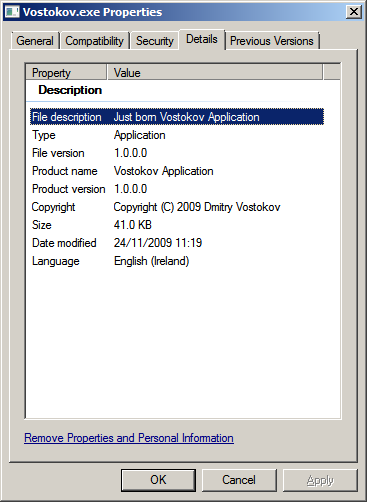
Finally you can run my moniker process (just born version doesn’t consume CPU time) and if I come across the dump of your system I would be very pleased to see Vostokov.exe in the list of running processes (!vm or !process 0 0 WinDbg commands).
lkd> !vm

[...]

0780 svchost.exe        354 (      1416 Kb)

0720 svchost.exe        330 (      1320 Kb)

0768 svchost.exe        322 (      1288 Kb)

07d4 svchost.exe        296 (      1184 Kb)

0dc8 Vostokov.exe       134 (       536 Kb)

019c smss.exe           128 (       512 Kb)

0ec4 wmplayer.exe         0 (         0 Kb)

0288 wmplayer.exe         0 (         0 Kb)

01ac wmplayer.exe         0 (         0 Kb)
lkd> !process 0 0

**** NT ACTIVE PROCESS DUMP ****

PROCESS fffffa8003bf1040

    SessionId: none  Cid: 0004    Peb: 00000000  ParentCid: 0000

    DirBase: 00124000  ObjectTable: fffff88000000080  HandleCount: 570.

    Image: System
[...]
PROCESS fffffa8005eeac10

    SessionId: 2  Cid: 0888    Peb: 7fffffd5000  ParentCid: 0458

    DirBase: 1c64e000  ObjectTable: fffff8800cab5b50  HandleCount: 312.

    Image: windbg.exe
PROCESS fffffa8005e87620

    SessionId: 2  Cid: 09d4    Peb: 7efdf000  ParentCid: 0f64

    DirBase: 112938000  ObjectTable: fffff8800c8b2980  HandleCount:  28.

    Image: cmd.exe
PROCESS fffffa800579cb50

    SessionId: 2  Cid: 0dc8    Peb: 7efdf000  ParentCid: 09d4

    DirBase: 092aa000  ObjectTable: fffff880105df610  HandleCount:   9.

    Image: Vostokov.exe
PROCESS fffffa8005e3e7a0

    SessionId: 2  Cid: 09c8    Peb: 7efdf000  ParentCid: 0b24

    DirBase: 78baf000  ObjectTable: fffff8800cfe0a30  HandleCount: 433.

    Image: iexplore.exe
PROCESS fffffa8005f53040

    SessionId: 2  Cid: 0db8    Peb: 7fffffd9000  ParentCid: 0458

    DirBase: 11856e000  ObjectTable: fffff8800c460710  HandleCount:  45.

    Image: notepad.exe
lkd> .process /r /p fffffa800579cb50

Implicit process is now fffffa80`0579cb50
lkd> lmv m Vostokov

start             end                 module name

00000000`001f0000 00000000`001fe000   Vostokov   (deferred)

    Image path: c:\Users\[...]\Vostokov.exe

    Image name: Vostokov.exe

    Timestamp:        Tue Nov 24 11:19:31 2009 (4B0BC143)

    CheckSum:         000156E1

    ImageSize:        0000E000

    File version:     1.0.0.0

    Product version:  1.0.0.0

    File flags:       0 (Mask 17)

    File OS:          4 Unknown Win32

    File type:        1.0 App

    File date:        00000000.00000000

    Translations:     1809.04b0

    CompanyName:      DumpAnalysis.org

    ProductName:      Vostokov Application

    InternalName:     Vostokov

    OriginalFilename: Vostokov.exe

    ProductVersion:   Just born

    FileVersion:      Just born

    FileDescription:  Just born Vostokov Application

    LegalCopyright:   Copyright (C) 2009 Dmitry Vostokov

    Comments:         Written by Dmitry Vostokov
You can inspect its memory if you attach WinDbg to a running instance or from a complete memory or a user process dump (symbols are supplied):
0:001> da /c 90 Vostokov!szCopyright

00000000`001fac40 "Vostokov.exe, Just born version 1.0.0.0, Copyright (c) 2009 by Dmitry Vostokov, DumpAnalysis.org"
You can download my moniker together with .cpp and .pdb files from here (named in a classic 8.3 format):
Download Vostokov.zip
Now I’m going to teach it something useful and release the next aged version soon.
- Dmitry Vostokov @ DumpAnalysis.org -
Posted in Announcements, Computational Ghosts and Bug Hauntings, Fun with Crash Dumps, Memory Religion (Memorianity) | No Comments »
Friday, November 20th, 2009
By analogy with a security researcher profession I propose the new title of a software defect researcher as a unified profession combining relevant fields of security research, testing, debugging, memory dump analysis, software reverse engineering, construction and maintenance. At least I consider myself a software defect researcher. If you think you consider yourself too please write a comment to this post. Thank you in advance.
- Dmitry Vostokov @ DumpAnalysis.org -
Posted in Announcements, Crash Dump Analysis, Debugging, Memory Dump Analysis Jobs, Security, Software Engineering, Testing | 1 Comment »
Tuesday, November 17th, 2009
Here is the reading system I devised to read all books that I review on this blog:
Mod N Reading System
- Dmitry Vostokov @ LiterateScientist.com -
Posted in Announcements, Reading (General, Metareading) | No Comments »
Monday, November 16th, 2009
This weekend noticed that it is in stock and this means that I soon get it in the post:
Advanced .NET Debugging (Addison-Wesley Microsoft Technology Series)
I plan to start reading it as soon as it arrives and put notes on my Software Generalist blog.
- Dmitry Vostokov @ DumpAnalysis.org -
Posted in .NET Debugging, Announcements, Books, Crash Dump Analysis, Debugging, Software Engineering, WinDbg Tips and Tricks | 1 Comment »
Saturday, November 14th, 2009
I have created Book Errata page at this address:
http://www.dumpanalysis.org/MDAA-Volume2-Errata
The link to it has also been added to the main book ad page:
Memory Dump Analysis Anthology, Volume 2
- Dmitry Vostokov @ DumpAnalysis.org -
Posted in Announcements, Books, Publishing | No Comments »
Thursday, October 29th, 2009
As a dual to my previous Resume and CV: As a Book (it actually has a “bug” on the cover, try to spot it) I plan to publish the long time memories in the following book next year:
My Failed Job Interviews: Reflections on 50 Percent (ISBN: 978-1906717889)
The recollections of my pre-memory dump analysis era span East and West, small and giant software companies, full time and part time, office and remote job positions, direct and recruitment company hiring, phone and on-site, technical and business interviews.
- Dmitry Vostokov @ DumpAnalysis.org -
Posted in Announcements, Books, History, Publishing, Software Engineering | No Comments »
Friday, October 23rd, 2009
First, I introduce the notion of a ruptured computation that is a relaunched, restarted or resumed process from a checkpoint after a rupture in its fabric, for example, crash, hang, spike and leak forcing termination. DNA can be an abbreviation of a Dump of Nasty Application or Double-ruptures of Nasty Application but I got an enlightenment spike in my head recently after recognizing that C, H, S and L are 4 DNA bases: Crash, Hang, Spike and Leak. Do you see a parallel with the real DNA and its 4 bases: A, T, G, C? Now a sample of a ruptured computation DNA strand (imagine, we launch an application and it crashes, …, crashes, …, crashes, …, spikes, …, crashes, …, hangs, …) can be represented as: …CCCSCH… . What about its second strand? I’m in search of it now but in the mean time I introduce the second notion of RNA (Really Nasty Application or Ruptures of Nasty Application) that is just one strand of …CCCSCH… as needed (real RNA is mostly single-stranded).
- Dmitry Vostokov @ DumpAnalysis.org -
Posted in Announcements, Crash Dump Analysis, Debugging, Fun with Crash Dumps | 3 Comments »
Friday, October 16th, 2009
Memory Analysis and Debugging Institute (MA&DI), DA+TA Portal (DumpAnalysis.org + TraceAnalysis.org) and OpenTask establish
Software Maintenance Institute (SMI)
More details about R&D Institute of Software Maintenance will be announced soon.
- Dmitry Vostokov @ DumpAnalysis.org -
Posted in Announcements, Crash Dump Analysis, Debugging, Education and Research, Science of Memory Dump Analysis, Science of Software Tracing, Software Engineering, Software Maintenance Institute, Software Technical Support, Software Trace Analysis | 1 Comment »
Tuesday, October 13th, 2009
Threads in my process run very fast. Not long ago the watch variable had the value 5 and now it is 6:
switch (years_at_citrix)

{

  case 5:

    write_blog_post(”I’ve just passed 5 year mark … “);

    wait_for_certificate();

    write_blog_post(”Shortly after celebrating 5 years … “);

    break;

  case 6:

    write_blog_post(”Threads in my process run very fast. Not long ago … “);

    break;

  case 7:

    // … TBD
}
- Dmitry Vostokov @ DumpAnalysis.org -
Posted in Announcements, Citrix, Crash Dump Analysis, Debugging, History, Software Engineering, Software Technical Support, Software Trace Analysis | 1 Comment »
Monday, October 12th, 2009
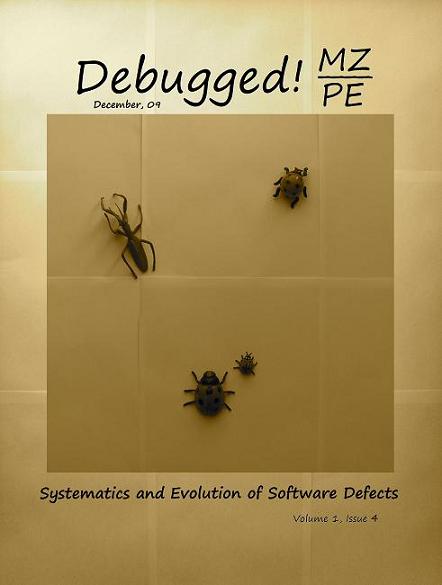
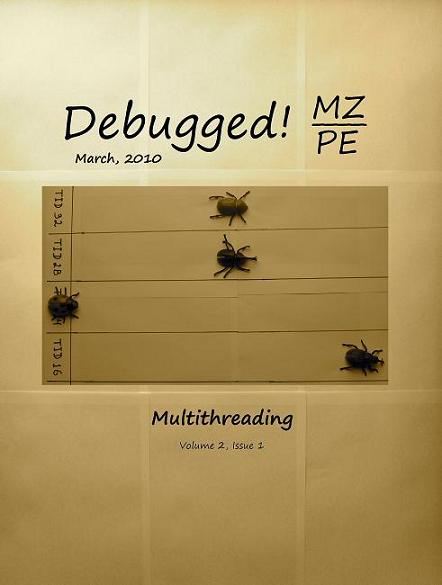
To commemorate 200 years since Darwin’s birth and 150 years since the publication of The Origin of Species, OpenTask plans to dedicate December, 2009 issue of Debugged! MZ/PE magazine to taxonomy and evolution of software defects and March, 2010 issue to multithreading (as natural selection).
Debugged! MZ/PE: Systematics and Evolution of Software Defects, December, 2009 (Paperback, ISBN: 978-1906717827)
Debugged! MZ/PE: Multithreading, March, 2010 (Paperback, ISBN: 978-1906717834)
Here are draft front covers designed during last weekend:
- Dmitry Vostokov @ DumpAnalysis.org -
Posted in Announcements, Books, CDA Pattern Classification, Computer Science, Crash Dump Analysis, Debugged! MZ/PE, Debugging, Multithreading, Publishing, Software Engineering, Software Technical Support | 2 Comments »
Monday, October 12th, 2009
The best of artistic work commissioned by OpenTask to be published with annotations in the following book scheduled to open 2010, The Year of The Foundation of Debugging (Crash Dump Analysis):
Spikes, Hangs, Crashes, Leaks and Dumps of Imagination: The Art of the Debugging Art (ISBN: 978-1906717841)
Note: This is not a book about natural computer memory visualization.
- Dmitry Vostokov @ DumpAnalysis.org -
Posted in Announcements, Art, Books, Debugged! MZ/PE, Debugging, Memory Dreams, Opcodism, Physicalist Art, Poetry, Publishing | No Comments »
Friday, October 9th, 2009
This is the first case study here that shows an interplay of memory dump analysis (DA) and software trace analysis (TA) patterns, what I call DATA analysis patterns (or DA+TA).
It was reported that one process was blocking vital server functionality. After the process restart the problem was gone away. A complete memory dump was saved on the next occurrence and it revealed critical section wait chains in that process but no critical section deadlocks:
0: kd> .process /r /p 87f76020

Implicit process is now 87f76020

Loading User Symbols

[...]
0: kd> !cs -l -o -s

-----------------------------------------

DebugInfo          = 0x0016c6d8

Critical section   = 0×0032be30 (+0×32BE30)

LOCKED

LockCount          = 0×34

WaiterWoken        = No

OwningThread       = 0×00001c64

RecursionCount     = 0×1

LockSemaphore      = 0×624

SpinCount          = 0×00000000

OwningThread       = .thread 86396db0

ntdll!RtlpStackTraceDataBase is NULL. Probably the stack traces are not enabled.

[…]
The thread 86396db0 (TID 1c64) that blocked more than 50 threads (0×34) was blocked itself sleeping for more than 6 seconds:
0: kd> .thread 86396db0

Implicit thread is now 86396db0
0: kd> kL 100

  *** Stack trace for last set context - .thread/.cxr resets it

ChildEBP RetAddr

ae7f8c98 8083d5b1 nt!KiSwapContext+0x26

ae7f8cc4 8083cf69 nt!KiSwapThread+0x2e5

ae7f8d0c 8092b03f nt!KeDelayExecutionThread+0x2ab

ae7f8d54 80833bef nt!NtDelayExecution+0x84

ae7f8d54 7c82860c nt!KiFastCallEntry+0xfc

1020e8ac 7c826f69 ntdll!KiFastSystemCallRet

1020e8b0 77e41ed5 ntdll!NtDelayExecution+0xc

1020e918 77e424fd kernel32!SleepEx+0x68

1020e928 67739357 kernel32!Sleep+0xf

1020e944 6773c3a2 ComponentA!DB_Driver_Command+0xa7

[…]

1020ec64 67485393 ComponentB!DatabaseSearch+0×34

[…]

1020ffb8 77e6482f msvcrt!_endthreadex+0xa3

1020ffec 00000000 kernel32!BaseThreadStart+0×34
0: kd> kv

  *** Stack trace for last set context - .thread/.cxr resets it

ChildEBP RetAddr  Args to Child

[...]

1020e918 77e424fd 00001b00 00000000 1020e944 kernel32!SleepEx+0x68 (FPO: [SEH])

1020e928 67739357 00001b00 00000000 0032ac6c kernel32!Sleep+0xf (FPO: [1,0,0])

[…]
0: kd> ? 1b00 / 0n1000

Evaluate expression: 6 = 00000006
Critical section it owns shows high contention count too:
0: kd> dt -r1 _RTL_CRITICAL_SECTION   0x0032be30

ProcessA!_RTL_CRITICAL_SECTION

   +0x000 DebugInfo        : 0x0016c6d8 _RTL_CRITICAL_SECTION_DEBUG

      +0x000 Type             : 0

      +0x002 CreatorBackTraceIndex : 0

      +0x004 CriticalSection  : 0x0032be30 _RTL_CRITICAL_SECTION

      +0x008 ProcessLocksList : _LIST_ENTRY [ 0x16c708 - 0x16c6b8 ]

      +0x010 EntryCount       : 0

      +0×014 ContentionCount  : 0xac352

      +0×018 Spare            : [2] 0×43005c

   +0×004 LockCount        : -210

   +0×008 RecursionCount   : 1

   +0×00c OwningThread     : 0×00001c64

   +0×010 LockSemaphore    : 0×00000624

   +0×014 SpinCount        : 0
Fortunately, that process had ETW tracing capability and its software trace recorded before the complete memory dump was saved the following recurrent periodic errorfrom different threads that confirms our observation about the possible problem with a database and explains thread delays we see (> 6 seconds for Sleep):
#    PID  TID  Time         Message

[...]

1972 2780 5992 10:05:11.005 Error: [DB Driver] Not enough space on temp disk

1973 2780 5992 10:05:11.005 Execute DB command sleeps on error (retry 26)

[...]

4513 2780 3292 10:06:02.942 Error: [DB Driver] Not enough space on temp disk

4514 2780 3292 10:06:02.942 Execute DB command sleeps on error (retry 11)

4515 2780 3292 10:06:09.598 Error: [DB Driver] Not enough space on temp disk

4516 2780 3292 10:06:09.598 Execute DB command sleeps on error (retry 12)

[…]
- Dmitry Vostokov @ DumpAnalysis.org -
Posted in Announcements, Complete Memory Dump Analysis, Crash Dump Analysis, Crash Dump Patterns, Software Trace Analysis, Trace Analysis Patterns | No Comments »