Icons for Memory Dump Analysis Patterns (Part 89)
Tuesday, February 8th, 2011Today we introduce an icon for Blocked Thread (hardware) pattern:
B/W
![]()
Color
![]()
- Dmitry Vostokov @ DumpAnalysis.org + TraceAnalysis.org -
Today we introduce an icon for Blocked Thread (hardware) pattern:
B/W
![]()
Color
![]()
- Dmitry Vostokov @ DumpAnalysis.org + TraceAnalysis.org -
This pattern has a funny name Gossip. I thought originally to call it Duplicated Message but gave it the new name allowing for the possibility of semantics of the same message to be distorted in subsequent trace messages from different adjoint threads. Typical ETW / CDF trace example (distortion free) of the same message content seen in different modules (some columns like Date and Time are omitted):
#     Module  PID  TID  Message[...]26875 ModuleA

2172 5284 LoadImageEvent: ImageName(\Device\HarddiskVolume2\Windows\System32\notepad.exe) ProcessId(0x000000000000087C)26876 ModuleB

2172 5284 LoadImageEvent: ImageName(\Device\HarddiskVolume2\Windows\System32\notepad.exe), ProcessId(2172)26877 ModuleC

2172 5284 ImageLoad: fileName=notepad.exe, pid: 000000000000087C[...]
In such cases, when constructing event sequence order it is recommended to choose messages from the one source instead of mixing events from different sources, for example:
#     Module  PID  TID  Message[...]26875 ModuleA

2172 5284 LoadImageEvent: ImageName(\Device\HarddiskVolume2\Windows\System32\notepad.exe) ProcessId(0×000000000000087C)[…]33132 ModuleA

4180 2130 LoadImageEvent: ImageName(\Device\HarddiskVolume2\Windows\System32\calc.exe) ProcessId(0×0000000000001054)[…]
- Dmitry Vostokov @ DumpAnalysis.org + TraceAnalysis.org -
Got an insider information from Memory Dump Analysis Services that they are developing a Prolog extension for memory dump analysis. Indeed, after asking their development team, I got a proof of concept extension DLL that works on my computer after installing x64 version of SWI-Prolog and copying wdes.dll to pl \ bin installation folder:
0: kd> .load C:\Program Files\pl\bin\wdes.dll
0: kd> !help

Help for Windows Debugging Expert System wdes.dll

   help               - Shows this help

   pload              - Loads Prolog interpretor
0: kd> !pload

SWI-Prolog has been loaded
So far so good. Waiting for more extension commands. Perhaps, one day, this extension realizes my dream reminisced while testing a Python extension.
- Dmitry Vostokov @ DumpAnalysis.org + TraceAnalysis.org -
Finally had time today to test python WinDbg extension. I installed python 2.6.6 and used Debugging Tools for Windows x64. The script I used was from the extension web site blog slightly modified and called processes.py:
from pykd import *

nt = loadModule( "nt" )

processList = typedVarList( nt.PsActiveProcessHead, "nt", "_EPROCESS", "ActiveProcessLinks" )

for process in processList:

    dprintln( "".join( [ chr(i) for i in process.ImageFileName.values() ] ) )

    dprintln( "\r" )
I loaded x64 version of pykd.pyd extension and executed the script:
0: kd> !py c:\PyScripts\processes.py

System

smss.exe

csrss.exe

csrss.exe

psxss.exe

winlogon.exe

wininit.exe

services.exe

lsass.exe

lsm.exe

svchost.exe

svchost.exe

svchost.exe

svchost.exe

svchost.exe

svchost.exe

svchost.exe

svchost.exe

spoolsv.exe

mdm.exe

svchost.exe

svchost.exe

svchost.exe

taskhost.exe

dwm.exe

explorer.exe

DTLite.exe

mmc.exe

WZQKPICK.EXE

concentr.exe

pnamain.exe

jusched.exe

wfcrun32.exe

msdtc.exe

iexplore.exe

iexplore.exe

iexplore.exe

splwow64.exe

iexplore.exe

jucheck.exe

iexplore.exe

notepad.exe

notepad.exe

iexplore.exe

notepad.exe

iexplore.exe

notepad.exe

notepad.exe

iexplore.exe

audiodg.exe

CDViewer.exe

wfica32.exe

iexplore.exe

notepad.exe

cmd.exe

conhost.exe

wuauclt.exe

wfica32.exe

wlrmdr.exe

TrustedInstall

wfica32.exe

notepad.exe

iexplore.exe

wmplayer.exe

VISIO.EXE

mspaint.exe

svchost.exe

sppsvc.exe

windbg.exe

mmc.exe

LogonUI.exe

taskeng.exe

NotMyfault.exe
Very good so far. I’m learning now Python language to write more interesting scripts for crash dump analysis pattern diagnostics, mining statistics, formatting and visualization. After browsing Amazon for some time I chose this book for study:
A Primer on Scientific Programming with Python

About 5 or 6 years ago I was thinking about using a Prolog interpreter to write an expert system for crash dump analysis. I even wrote a simple Prolog program to match product hotfixes and was contemplating writing a WinDbg extension especially after I learnt that SWI-Prolog system I used had an interpreter DLL that could be dynamically loaded into a Win32 API application.
- Dmitry Vostokov @ DumpAnalysis.org + TraceAnalysis.org -
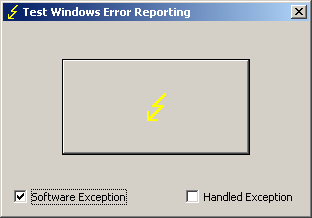
TestDefaultDebugger has been updated to version 2.0 with the following new features:
- Renamed to TestWER to reflect the shift from default debuggers to WER and LocalDumps (W2K8, Vista and Windows 7)
- The ability to generate software exceptions (by default TestWER generates hardware NULL pointer access violation exception)
- An option to handle generated exceptions (hardware and software) to test such scenarios
- Symbol PDB files are included in the package
Here’s an example stack trace when we select a software exception option and push the big button:
0:000> !analyze -v
[...]
EXCEPTION_RECORD:  0012f4a4 -- (.exr 0x12f4a4)

ExceptionAddress: 7742fbae (kernel32!RaiseException+0x00000058)

   ExceptionCode: e06d7363 (C++ EH exception)

  ExceptionFlags: 00000001

NumberParameters: 3

   Parameter[0]: 19930520

   Parameter[1]: 0012f83c

   Parameter[2]: 00428ef8

  pExceptionObject: 0012f83c

  _s_ThrowInfo    : 00428ef8

  Type            : int
[...]
0:000> k

ChildEBP RetAddr

0012edb4 775c5610 ntdll!KiFastSystemCallRet

0012edb8 7743a5d7 ntdll!NtWaitForMultipleObjects+0xc

0012ee54 7743a6f0 kernel32!WaitForMultipleObjectsEx+0x11d

0012ee70 774ae2a5 kernel32!WaitForMultipleObjects+0x18

0012eedc 774ae4d1 kernel32!WerpReportFaultInternal+0x16d

0012eef0 7748ff4d kernel32!WerpReportFault+0x70

0012ef7c 004187ee kernel32!UnhandledExceptionFilter+0x1b5

0012f2b4 004161e8 TestWER!abort+0x10f

0012f2e4 004130cb TestWER!terminate+0x33

0012f2ec 7748febe TestWER!__CxxUnhandledExceptionFilter+0x3c

0012f374 775d7fc1 kernel32!UnhandledExceptionFilter+0x127

0012f37c 77569bdc ntdll!__RtlUserThreadStart+0x6f

0012f390 77564067 ntdll!_EH4_CallFilterFunc+0x12

0012f3b8 775c5f79 ntdll!_except_handler4+0x8e

0012f3dc 775c5f4b ntdll!ExecuteHandler2+0x26

0012f48c 775c5dd7 ntdll!ExecuteHandler+0x24

0012f48c 7742fbae ntdll!KiUserExceptionDispatcher+0xf

0012f7e0 00412ac2 kernel32!RaiseException+0×58

0012f818 0041ff1f TestWER!_CxxThrowException+0×48

0012f85c 00403620 TestWER!CTestDefaultDebuggerDlg::OnBnClickedButton1+0xaf

0012f86c 0040382f TestWER!_AfxDispatchCmdMsg+0×45

0012f89c 00402df6 TestWER!CCmdTarget::OnCmdMsg+0×11c

0012f8c0 00409ef8 TestWER!CDialog::OnCmdMsg+0×1d

0012f910 0040a792 TestWER!CWnd::OnCommand+0×92

0012f9ac 00406dea TestWER!CWnd::OnWndMsg+0×36

0012f9cc 00409713 TestWER!CWnd::WindowProc+0×24

0012fa34 004097a2 TestWER!AfxCallWndProc+0×9a

0012fa54 7716fd72 TestWER!AfxWndProc+0×36

0012fa80 7716fe4a user32!InternalCallWinProc+0×23

0012faf8 77170943 user32!UserCallWinProcCheckWow+0×14b

0012fb38 77170b36 user32!SendMessageWorker+0×4b7

0012fb58 747eb4ba user32!SendMessageW+0×7c

0012fb78 747eb51c comctl32!Button_NotifyParent+0×3d

0012fb94 747eb627 comctl32!Button_ReleaseCapture+0×112

0012fbf4 7716fd72 comctl32!Button_WndProc+0xa98

0012fc20 7716fe4a user32!InternalCallWinProc+0×23

0012fc98 7717018d user32!UserCallWinProcCheckWow+0×14b

0012fcfc 7717022b user32!DispatchMessageWorker+0×322

0012fd0c 771651f5 user32!DispatchMessageW+0xf

0012fd30 0040618c user32!IsDialogMessageW+0×586

0012fd44 004071e2 TestWER!CWnd::IsDialogMessageW+0×32

0012fd50 00402dd3 TestWER!CWnd::PreTranslateInput+0×2d

0012fd64 00408dc1 TestWER!CDialog::PreTranslateMessage+0×9a

0012fd78 00403f35 TestWER!CWnd::WalkPreTranslateTree+0×23

0012fd90 00404090 TestWER!AfxInternalPreTranslateMessage+0×41

0012fd9c 00403f80 TestWER!CWinThread::PreTranslateMessage+0xd

0012fda8 004040dd TestWER!AfxPreTranslateMessage+0×19

0012fdb8 00408598 TestWER!AfxInternalPumpMessage+0×2d

0012fde0 00403440 TestWER!CWnd::RunModalLoop+0xc5

0012fe2c 004204ee TestWER!CDialog::DoModal+0×12d

0012fee4 0041fdf5 TestWER!CTestDefaultDebuggerApp::InitInstance+0xce

0012fef8 0040fc3e TestWER!AfxWinMain+0×48

0012ff88 7743d0e9 TestWER!__tmainCRTStartup+0×112

0012ff94 775a19bb kernel32!BaseThreadInitThunk+0xe

0012ffd4 775a198e ntdll!__RtlUserThreadStart+0×23

0012ffec 00000000 ntdll!_RtlUserThreadStart+0×1b
Here’s WinDbg output when we choose to handle exceptions:
0:001> g

(628.a90): Access violation - code c0000005 (first chance)

First chance exceptions are reported before any exception handling.

This exception may be expected and handled.

TestWER64!CTestDefaultDebuggerDlg::OnBnClickedButton1+0×44:

00000001`40024774 c704250000000000000000 mov dword ptr [0],0 ds:00000000`00000000=????????
0:000> g

(628.a90): C++ EH exception - code e06d7363 (first chance)
You can download TestWER package from Citrix support web site:
- Dmitry Vostokov @ DumpAnalysis.org + TraceAnalysis.org -