Archive for August, 2009
Friday, August 7th, 2009
The new contemporary movement of engineers resisting dump analysis automation (including automated debugging and perhaps automated software construction too)
Inspired by Luddite movement.
- Dmitry Vostokov @ DumpAnalysis.org -
Posted in Crash Dump Analysis, Fun with Crash Dumps, New Words | No Comments »
Friday, August 7th, 2009
While I was listening to Klaus Schulze In Blue album a colleague sent me the link to a tool that reconstructs blue screens from minidumps (small memory dumps):
BlueScreenView (written by Nir Sofer)
I immediately downloaded it at it works even with kernel dumps but without pointing to a module that triggered the bugcheck (it shows modules for minidumps):
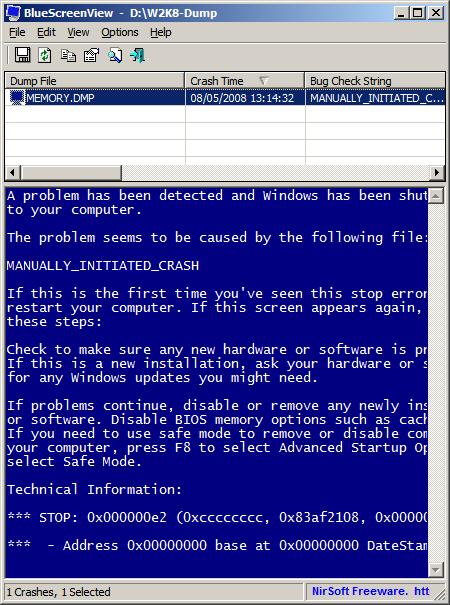
It ignores memory dumps and minidumps from x64 Windows so the next version I hope should do it 
PS. Long time ago I was thinking about writing a kernel driver that saves BSOD screen and embeds it in a memory dump.
- Dmitry Vostokov @ DumpAnalysis.org -
Posted in Announcements, Crash Dump Analysis, Crash Dumps for Dummies, Fun with Crash Dumps, Minidump Analysis, Software Technical Support, Tools, Windows System Administration | No Comments »
Friday, August 7th, 2009
This is an encyclopedic work I bought in a local book shop and finally finished reading today. It took me a year to read from cover to cover and pages were falling out of the glue but I continued to read. Highly recommended for education and another view on human history. The review of Freud was enlightening to me because I didn’t know about the recent scholarship criticizing his work. In fact, I so liked this book that just bought it again in a hardcover version from Folio Society and start rereading it again soon.
Ideas: A History of Thought and Invention, from Fire to Freud

The second encyclopedic book seems was written before the previous one but looks like the logical sequel to it. I’m starting reading it next week.
The Modern Mind: An Intellectual History of the 20th Century

- Dmitry Vostokov @ LiterateScientist.com -
Posted in Anthropology, Art, Biology, Chemistry, Economics, Ethics, Evolution, From Cover To Cover, General Science, Geography, History, Humanities, Ideas, Language, Medicine, Philosophy, Physics, Politics, Psychology, Reading List 2009, Religion, Reviewed on Amazon, Social Sciences, Statistics, Theology | No Comments »
Thursday, August 6th, 2009
The road to immortality is paved with memory dumps.
Dmitry Vostokov
- Dmitry Vostokov @ DumpAnalysis.org -
Posted in Bugtations, Memory Religion (Memorianity) | No Comments »
Thursday, August 6th, 2009
The hierarchy of Ψ1, …, Ψ8, …, Ψ16, …, Ψ32, …, Ψ64, …, …, …, ΨΨ numbers where the subscript denotes the number of bits a memory address can have, so Ψ32 and Ψ64 are memorillion and quadrimemorillion of memory dumps respectively. We only need to figure out the meaning of Ψ0 and ΨΨ. Perhaps there is some meaning in Dirac notation here: <Ψ0|ΨΨ>. More on this later because I have to finish this week the book x64 Windows Debugging: Practical Foundations and write an errata file for the previous x86 version of the book series.
Note: Ψ is an M upside down.
- Dmitry Vostokov @ DumpAnalysis.org -
Posted in Crash Dump Analysis, Crash Dump Patterns, Fun with Crash Dumps, Futuristic Memory Dump Analysis, Intelligent Memory Movement, Psi-computation, Science of Memory Dump Analysis | No Comments »
Thursday, August 6th, 2009
There is an obvious pattern called Missing Component. We don’t see trace statements we expect and wonder whether the component was not loaded, its container ceased to exist or simply it wasn’t selected for tracing. In many support cases there is a trade-off between tracing everything and the size of trace files. Customers and engineers usually prefer smaller files to analyze. However in the case of predictable and reproducible issues with short duration we can always select all components or deselect a few (instead of selecting a few). Here is the article for Citrix CDF tracing best practices and it can be applied to other software traces as well:
Tracing Best Practices
We can find an example from Discontinuity pattern where the possibility of a sudden and silent gap in trace statements could happen because not all necessary components were selected for tracing.
Sometimes, in cases when the missing component was selected for tracing but we don’t see any trace output from it other module traces can give us an indication, perhaps showing the load failure message. For example, Process Monitor tracing done in parallel can reveal load failures.
- Dmitry Vostokov @ TraceAnalysis.org -
Posted in CDF Analysis Tips and Tricks, Citrix, Debugging, Software Trace Analysis, Trace Analysis Patterns | 4 Comments »
Tuesday, August 4th, 2009
To be is to crash and to be crashed.
Dmitry Vostokov
- Dmitry Vostokov @ DumpAnalysis.org -
Posted in Bugtations, Crash Dump Analysis, Debugging, Fun with Crash Dumps | No Comments »
Tuesday, August 4th, 2009
Sometimes there are reported delays in application startup, session initialization, long response times and simply the absence of response. All these problems can be reflected in software traces showing sudden gaps in threads of activity. I call this pattern Discontinuity per analogy with continuous and discontinuous functions in mathematics. Here is an example I came upon recently and it will be covered fully in the forthcoming pattern cooperation case study spanning both memory dump and trace analysis. One process was reported to have a long period of CPU spiking calculation and a CDF trace was recorded. When we open it we see this periodic error:
N   PID  TID  Time         Message

[…]

326 2592 5476 08:17:18.823 OpenRegistry: Attempting to open [… Hive path …]

327 2592 5476 08:17:18.824 OpenRegistry: Failed: 2

[…]
However when looking for any discontinuities for the thread 5476 we see this gap of more than 7 minutes:
N    PID  TID  Time         Message

[...]

3395 2592 5476 08:17:19.608 OpenRegistry: Attempting to open [... Hive path ...]

3396 2592 5476 08:17:19.608 OpenRegistry: Failed: 2

3461 2592 5476 08:24:31.137 OpenRegistry: Attempting to open [… Hive path …]

3462 2592 5476 08:24:31.137 OpenRegistry: Failed: 2

[…]
Therefore we have 3 possibilities here:
1. The process twice did lengthy CPU spiking calculations involving registry access and was quiet between them.
2. Registry access belonged to some background activity and ceased for 7 minutes and during that time it had CPU spiking intensive calculation.
3. This discontinuity is irrelevant because either the calculation module was not selected for tracing or it simply doesn’t have relevant tracing statement coverage for the code that does calculation.
Stay tuned because this story will be unfolded in other patterns and in the final case study.
- Dmitry Vostokov @ TraceAnalysis.org -
Posted in CDF Analysis Tips and Tricks, Debugging, Software Trace Analysis, Trace Analysis Patterns | 2 Comments »
Tuesday, August 4th, 2009
OpenTask plans to expand its Practical Foundations series and publish the following 2 books for the forthcoming Memory Dump Analysis Fundamentals certification (Unix track) being developed by Memory Analysis and Debugging Institute:
Linux, FreeBSD and Mac OS X Debugging: Practical Foundations (ISBN: 978-1906717773)
64-bit Linux, FreeBSD and Mac OS X Debugging: Practical Foundations (ISBN: 978-1906717780)
- Dmitry Vostokov @ DumpAnalysis.org -
Posted in Announcements, Assembly Language, Books, Certification, Crash Dump Analysis, Debugging, Education and Research, FreeBSD Crash Corner, GDB for WinDbg Users, Linux Crash Corner, Mac Crash Corner, Memory Dump Analysis Jobs, Publishing, Software Engineering, Software Technical Support, Testing, Tools, Training and Seminars | No Comments »
Monday, August 3rd, 2009
When we have software traces that record process identifiers (PID) and thread identifiers (TID) it is important to differentiate between trace statements sorted by time and by Thread of Activity. The latter is simply the flow of trace messages sorted by TID and it is very helpful in cases with dense traces coming from hundreds of processes and components. Here is an example from MessageHistory bulk trace fragment showing different threads of activity in different colors:
Start time: 21:5:36:651

Format time: 21:5:43:133

Number of messages sent: 24736

Number of messages posted: 905
[...]

21:5:41:990 S PID: a7c TID: 554 HWND: 0×0000000000010E62  Class: “ToolbarWindow32″ Title: “” WM_USER+4b (0×44b) wParam: 0×14 lParam: 0×749e300

21:5:41:990 S PID: a7c TID: 554 HWND: 0×00010E4A  Class: “CtrlNotifySink” Title: “” WM_NOTIFY (0×4e) wParam: 0×0 lParam: 0×749efa8

21:5:41:990 S PID: a7c TID: 554 HWND: 0×00010E62  Class: “ToolbarWindow32″ Title: “” WM_USER+3f (0×43f) wParam: 0×14 lParam: 0×749e1e0

21:5:41:990 S PID: a7c TID: 554 HWND: 0×00010E62  Class: “ToolbarWindow32″ Title: “” WM_USER+4b (0×44b) wParam: 0×14 lParam: 0×749e300

21:5:41:990 S PID: a7c TID: 554 HWND: 0×00010E62  Class: “ToolbarWindow32″ Title: “” WM_USER+19 (0×419) wParam: 0×14 lParam: 0×0

21:5:41:990 S PID: a7c TID: 554 HWND: 0×00010E62  Class: “ToolbarWindow32″ Title: “” WM_USER+61 (0×461) wParam: 0×6 lParam: 0×0

21:5:41:990 S PID: a7c TID: 554 HWND: 0×00010E62  Class: “ToolbarWindow32″ Title: “” WM_USER+56 (0×456) wParam: 0×0 lParam: 0×0

21:5:41:990 S PID: a7c TID: 554 HWND: 0×00010E4A  Class: “CtrlNotifySink” Title: “” WM_NOTIFY (0×4e) wParam: 0×0 lParam: 0×749f290

21:5:41:990 S PID: a7c TID: 554 HWND: 0×000E04A8  Class: “CtrlNotifySink” Title: “” WM_NCPAINT (0×85) wParam: 0xffffffffcc043bdb lParam: 0×0

21:5:41:990 P PID: a7c TID: 554 HWND: 0×000E04A8  Class: “CtrlNotifySink” Title: “” WM_PAINT (0xf) wParam: 0×0 lParam: 0×0

21:5:42:007 S PID: 1a8 TID: 660 HWND: 0×0001003C  Class: “CiceroUIWndFrame” Title: “TF_FloatingLangBar_WndTitle” WM_WINDOWPOSCHANGING (0×46) wParam: 0×0 lParam: 0×29af030

21:5:42:007 P PID: a7c TID: 9b4 HWND: 0×00010084  Class: “CiceroUIWndFrame” Title: “TF_FloatingLangBar_WndTitle” WM_TIMER (0×113) wParam: 0×6 lParam: 0×0

21:5:42:007 P PID: 1a8 TID: 660 HWND: 0×0001003C  Class: “CiceroUIWndFrame” Title: “TF_FloatingLangBar_WndTitle” WM_TIMER (0×113) wParam: 0×8 lParam: 0×0

21:5:42:007 P PID: a7c TID: 9b4 HWND: 0×00010084  Class: “CiceroUIWndFrame” Title: “TF_FloatingLangBar_WndTitle” WM_TIMER (0×113) wParam: 0×9 lParam: 0×0

21:5:42:022 P PID: a7c TID: a28 HWND: 0×0001061A  Class: “WPDShServiceObject” Title: “WPDShServiceObject_WND” WM_TIMER (0×113) wParam: 0xd lParam: 0×0

21:5:42:022 P PID: a7c TID: 9b4 HWND: 0×00010084  Class: “CiceroUIWndFrame” Title: “TF_FloatingLangBar_WndTitle” WM_TIMER (0×113) wParam: 0×8 lParam: 0×0

21:5:42:022 P PID: a7c TID: 9b4 HWND: 0×00010084  Class: “CiceroUIWndFrame” Title: “TF_FloatingLangBar_WndTitle” WM_PAINT (0xf) wParam: 0×0 lParam: 0×0

21:5:42:036 P PID: 1a8 TID: 660 HWND: 0×0001003C  Class: “CiceroUIWndFrame” Title: “TF_FloatingLangBar_WndTitle” WM_TIMER (0×113) wParam: 0×5 lParam: 0×0

21:5:42:054 S PID: a7c TID: 9b4 HWND: 0×0001006C  Class: “ReBarWindow32″ Title: “” WM_USER+10 (0×410) wParam: 0×2 lParam: 0×0

21:5:42:054 S PID: a7c TID: 9b4 HWND: 0×0001006C  Class: “ReBarWindow32″ Title: “” WM_USER+18 (0×418) wParam: 0×2 lParam: 0×1041a

21:5:42:054 S PID: a7c TID: 9b4 HWND: 0×0001006C  Class: “ReBarWindow32″ Title: “” WM_USER+1a (0×41a) wParam: 0×0 lParam: 0×1041c

21:5:42:054 S PID: a7c TID: 9b4 HWND: 0×0001006C  Class: “ReBarWindow32″ Title: “” WM_USER+19 (0×419) wParam: 0×0 lParam: 0×0

21:5:42:054 S PID: a7c TID: 9b4 HWND: 0×00010084  Class: “CiceroUIWndFrame” Title: “TF_FloatingLangBar_WndTitle” WM_WINDOWPOSCHANGING (0×46) wParam: 0×0 lParam: 0×2bef960

21:5:42:054 P PID: a7c TID: 9b4 HWND: 0×00010084  Class: “CiceroUIWndFrame” Title: “TF_FloatingLangBar_WndTitle” WM_TIMER (0×113) wParam: 0×10 lParam: 0×0

21:5:42:054 P PID: a7c TID: 9b4 HWND: 0×00010084  Class: “CiceroUIWndFrame” Title: “TF_FloatingLangBar_WndTitle” WM_TIMER (0×113) wParam: 0×5 lParam: 0×0

21:5:42:074 S PID: a7c TID: 554 HWND: 0×00010E32  Class: “DirectUIHWND” Title: “” WM_NCHITTEST (0×84) wParam: 0×0 lParam: 0×640406

21:5:42:074 S PID: a7c TID: 554 HWND: 0×00010E30  Class: “DUIViewWndClassName” Title: “” WM_NCHITTEST (0×84) wParam: 0×0 lParam: 0×640406

21:5:42:074 S PID: a7c TID: 554 HWND: 0×00010E32  Class: “DirectUIHWND” Title: “” WM_SETCURSOR (0×20) wParam: 0×10e32 lParam: 0×2000001

21:5:42:074 S PID: a7c TID: 554 HWND: 0×00010E30  Class: “DUIViewWndClassName” Title: “” WM_SETCURSOR (0×20) wParam: 0×10e32 lParam: 0×2000001

21:5:42:074 S PID: a7c TID: 554 HWND: 0×00010E20  Class: “ShellTabWindowClass” Title: “Release” WM_SETCURSOR

[…]
Ususally when we see an error indication we select its current thread of activity and investigate what happened in this process and thread before. Here is a synthesised example from real CDF traces:
No     PID  TID  Time         Message

[...]

165797 4280 5696 07:07:23.709 FreeToken Handle 00000000

165798 4660 7948 07:07:23.709 EnumProcesses failed. Error=-2144534527

165799 7984 6216 07:07:23.749 GetData threw exception

165800 7984 6216 07:07:23.750 === Begin Exception Dump ===

[…]
We see the error and sort by TID 7948 to see what happened before and get additional information like server name:
No     PID  TID  Time         Message

[...]

165223 4660 7948 07:07:23.704 GetServerName: Exit. ServerName = SERVER02

165224 4660 7948 07:07:23.704 GetServerProcesses: ServerName is SERVER02

165798 4660 7948 07:07:23.709 EnumProcesses failed. Error=-2144534527

[…]
- Dmitry Vostokov @ TraceAnalysis.org -
Posted in CDF Analysis Tips and Tricks, Debugging, Software Trace Analysis, Trace Analysis Patterns | 3 Comments »