Sometimes we have processes that actively monitor debugger attachments to prevent reverse engineering and terminate themselves if such attempts are detected. Some of them use very simple methods to achieve this like creating a thread that periodically calls IsDebuggerPresent API or waits for debugger events. In such cases attempts of any application to actively attach to these processes result in their termination.
Consider the following stack trace from the postmortem crash dump saved by NTSD on Windows Server 2003:
0:000> kL

ChildEBP RetAddr

00fefbcc 098b84a1 kernel32!RaiseException+0x53

...

...

...

00fefd28 0116a86a component!_CRT_INIT+0x187

00fefd6c 0116a8e6 component!__DllMainCRTStartup+0xb7

00fefd74 7c81a352 component!_DllMainCRTStartup+0x1d

00fefd94 7c830e70 ntdll!LdrpCallInitRoutine+0x14

00fefe4c 77e668a3 ntdll!LdrShutdownProcess+0x182

00feff38 77e66905 kernel32!_ExitProcess+0x43

00feff4c 00561ab9 kernel32!ExitProcess+0x14

00feffb8 77e64829 application!foo+0x41

00feffec 00000000 kernel32!BaseThreadStart+0x34
Disassembling application!foo shows the call to WaitForDebugEvent API:
0:000> u application!foo

application!foo:

00561a78 push    ebp

00561a79 mov     ebp,esp

00561a7b sub     esp,60h

00561a7e push    0FFFFFFFFh

00561a80 lea     eax,[ebp-60h]

00561a83 push    eax

00561a84 call    dword ptr [application!_imp__WaitForDebugEvent (00655224)]

00561a8a mov     eax,dword ptr [ebp+8]
We also see it on the raw stack which might also help in more complex cases:
0:000> !teb

TEB at 7ffdd000

    ExceptionList:        00fefbf8

    StackBase:            00ff0000

    StackLimit:           00fef000

    SubSystemTib:         00000000

    FiberData:            00001e00

    ArbitraryUserPointer: 00000000

    Self:                 7ffdd000

    EnvironmentPointer:   00000000

    ClientId:             000063fc . 00003270

    RpcHandle:            00000000

    Tls Storage:          00000000

    PEB Address:          7ffdb000

    LastErrorValue:       0

    LastStatusValue:      c0000034

    Count Owned Locks:    0

    HardErrorMode:        0
0:000> dds 00fef000 00ff0000

...

...

...

00fefecc  00000000

00fefed0  00feff48

00fefed4  77e9c4d7 kernel32!WaitForDebugEvent+0×66

00fefed8  c0000008

00fefedc  00000000

00fefee0  77e41ef3 kernel32!SleepEx+0×91

00fefee4  00000000

00fefee8  00000000

…

…

…
How would we find what process was trying to attach to our application? Let’s go with pure crash dump analysis approach. We can take the advantage of RaiseException call and get a kernel or a complete memory dump to examine all running processes and their threads. In order to model this I created a small program that simulates the behavior shown above:
// IsDebuggerPresent64
#include "stdafx.h"

#include "windows.h"
int _tmain(int argc, _TCHAR* argv[])

{

    while (1)

    {

        IsDebuggerPresent()

            ? puts ("Yes"),

                RaiseException(0x12345678,

                    0, 0, NULL)

            : puts ("No");

        Sleep(5000);

    }
    return 0;

}
Then I configured Process Monitoring Rules in Userdump Process Dumper Control Panel applet to bugcheck the system after dumping:
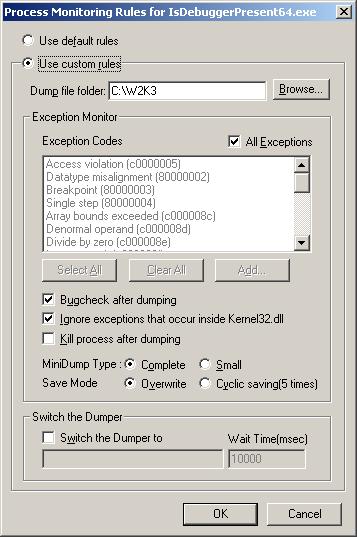
Then I asked one of my friends to debug the running instance of that application and let me know if there was any sudden BSOD. Indeed there was one and I got my complete memory dump (although kernel dump would suffice here). Let’s look at it.
We see that our process has an open debug port and its main thread is suspended:
kd> !process /r /p fffffadfe73f9c20

PROCESS fffffadfe73f9c20

    SessionId: 0  Cid: 0e4c    Peb: 7fffffd4000  ParentCid: 0e54

    DirBase: 2c472000  ObjectTable: fffffa80006f1690  HandleCount:  12.

    Image: IsDebuggerPresent64.exe

    VadRoot fffffadfe6ef3e30 Vads 26 Clone 0 Private 97. Modified 0. Locked 0.

    DeviceMap fffffa8000930540

    Token                             fffffa80030e7910

    ElapsedTime                       00:00:03.062

    UserTime                          00:00:00.000

    KernelTime                        00:00:00.000

    QuotaPoolUsage[PagedPool]         16288

    QuotaPoolUsage[NonPagedPool]      3488

    Working Set Sizes (now,min,max)  (1322, 50, 345) (5288KB, 200KB, 1380KB)

    PeakWorkingSetSize                1322

    VirtualSize                       7 Mb

    PeakVirtualSize                   7 Mb

    PageFaultCount                    1314

    MemoryPriority                    BACKGROUND

    BasePriority                      8

    CommitCharge                      107

    DebugPort                         fffffadfe6ec9040
THREAD fffffadfe69a2bf0  Cid 0e4c.0e74  Teb: 000007fffffde000 Win32Thread: 0000000000000000 WAIT: (Unknown) KernelMode Non-Alertable

SuspendCount 1

    fffffadfe69a2e90  Semaphore Limit 0×2

Not impersonating

DeviceMap                 fffffa8000930540

Owning Process            fffffadfe73f9c20       Image:         IsDebuggerPresent64.exe

Wait Start TickCount      37247          Ticks: 49 (0:00:00:00.765)

Context Switch Count      45

UserTime                  00:00:00.000

KernelTime                00:00:00.000

Win32 Start Address IsDebuggerPresent64 (0×00000001400013b0)

Start Address kernel32!BaseProcessStart (0×0000000077d59620)

Stack Init fffffadfdf7b5e00 Current fffffadfdf7b54f0

Base fffffadfdf7b6000 Limit fffffadfdf7b0000 Call 0
Priority 12 BasePriority 8 PriorityDecrement 2

Child-SP          RetAddr           Call Site

fffffadf`df7b5530 fffff800`0103b063 nt!KiSwapContext+0x85

fffffadf`df7b56b0 fffff800`0103c403 nt!KiSwapThread+0xc3

fffffadf`df7b56f0 fffff800`0105dc7c nt!KeWaitForSingleObject+0x528

fffffadf`df7b5780 fffff800`0105db2b nt!KiSuspendThread+0x2c

fffffadf`df7b57c0 fffff800`01058e71 nt!KiDeliverApc+0x20a

fffffadf`df7b5840 fffff800`0103c403 nt!KiSwapThread+0xde

fffffadf`df7b5880 fffffadf`dfd4a20c nt!KeWaitForSingleObject+0x528

fffffadf`df7b5910 fffffadf`dfd4a3be userdump!UdpCompleteExceptionForwarding+0x11c

fffffadf`df7b5990 fffffadf`dfd49dd8 userdump!UdpForwardException+0x13e

fffffadf`df7b59c0 fffff800`012ce9cf userdump!UdIoctl+0x618

fffffadf`df7b5a70 fffff800`012df026 nt!IopXxxControlFile+0xa5a

fffffadf`df7b5b90 fffff800`010410fd nt!NtDeviceIoControlFile+0x56

fffffadf`df7b5c00 00000000`77ef0a5a nt!KiSystemServiceCopyEnd+0x3 (TrapFrame @ fffffadf`df7b5c70)
If we search for a process that has NtWaitForDebugEvent function present on one of its stack traces we would find the debugger:
kd> !stacks 2 nt!NtWaitForDebugEvent

...

...

...

                [fffffadfe63da3b0 ntsd.exe]

 e54.000e50  fffffadfe6afbbf0 ffff6e8a Blocked    nt!KiSwapContext+0×85

                nt!KiSwapThread+0xc3

                nt!KeWaitForSingleObject+0×528

                nt!NtWaitForDebugEvent+0×342

                nt!KiSystemServiceCopyEnd+0×3

                ntdll!ZwWaitForDebugEvent+0xa

                dbgeng!LiveUserDebugServices::WaitForEvent+0xee

                dbgeng!LiveUserTargetInfo::WaitForEvent+0×488

                dbgeng!RawWaitForEvent+0×23c

                dbgeng!DebugClient::WaitForEvent+0×96

                ntsd!MainLoop+0xb7

                ntsd!main+0×18e

                ntsd!mainCRTStartup+0×171

                kernel32!BaseProcessStart+0×29
We see that it is NTSD.
- Dmitry Vostokov @ DumpAnalysis.org -