Visualizing Memory Leaks
Sunday, August 12th, 2007Dump2Picture can be used to explore memory leaks visually. I created the following small program in Visual C++ that leaks 64Kb every second:
#include "stdafx.h"

#include <windows.h>
int _tmain(int argc, _TCHAR* argv[])

{

  while (true)

  {

    printf("%x\n", (UINT_PTR)malloc(0xFFFF));

    Sleep(1000);

  }
  return 0;

}
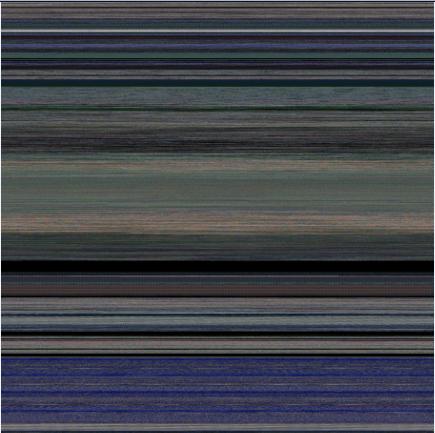
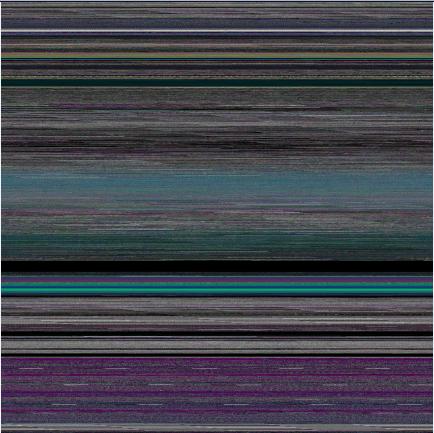
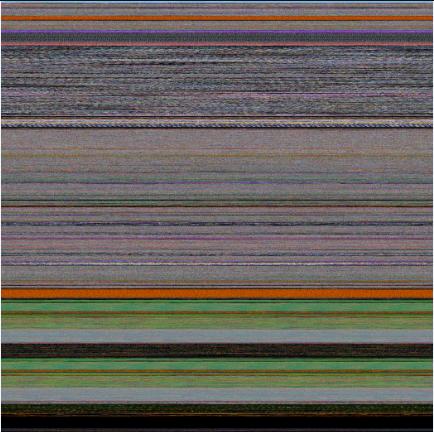
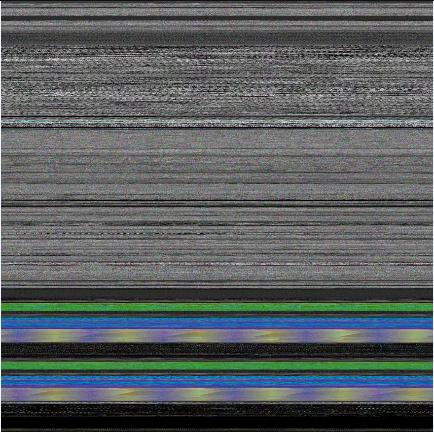
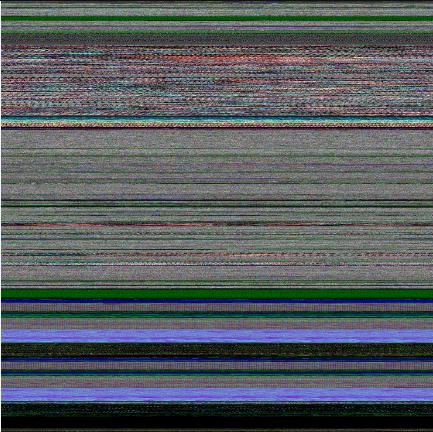
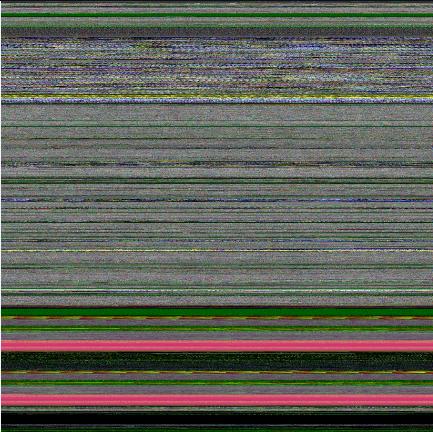
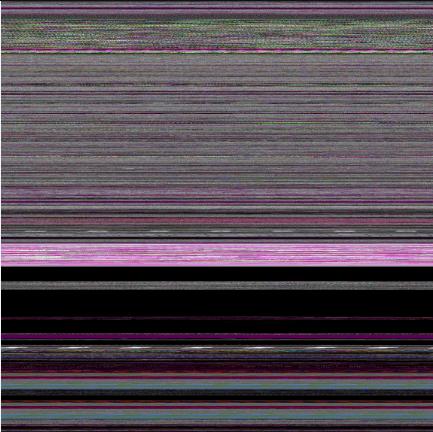
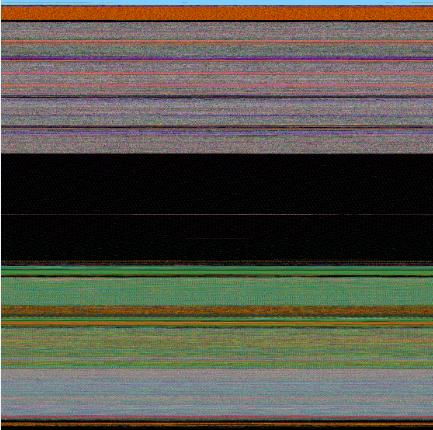
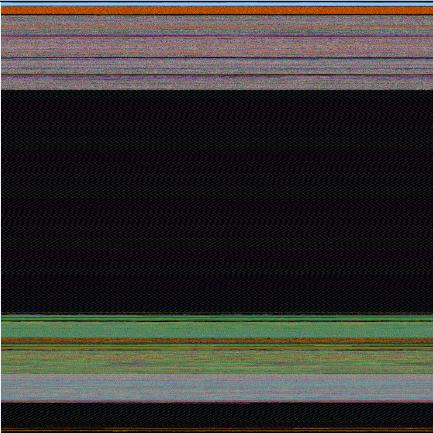
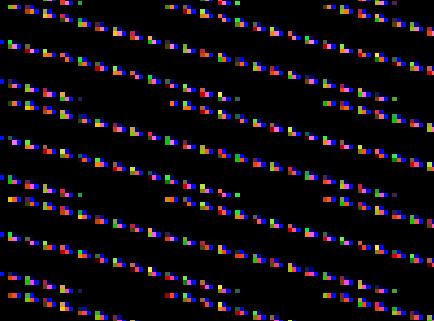
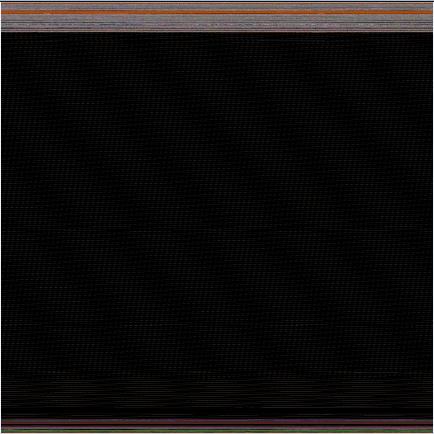
Then I sampled 3 dumps at 7Mb, 17Mb and 32Mb process virtual memory size and converted them as 16 bits-per-pixel bitmaps. On the pictures below we can see that the middle black memory area grows significantly. Obviously malloc function allocates zeroed memory and therefore we see black color.
7Mb process memory dump:
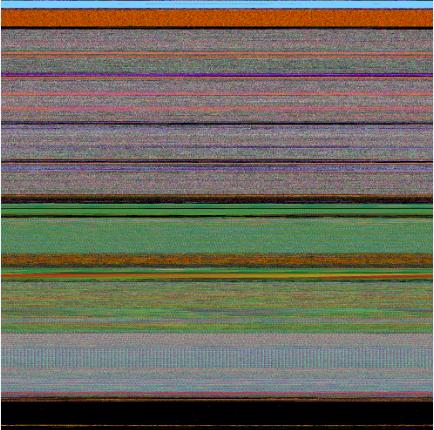
17Mb process memory dump:
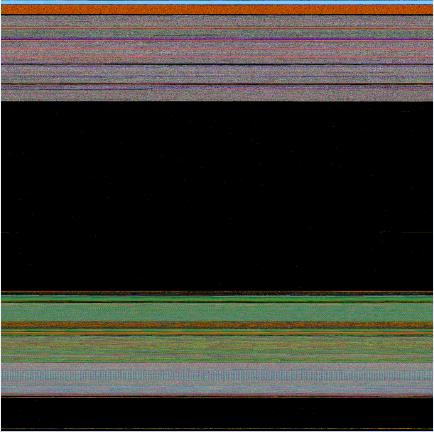
32Mb process memory dump:
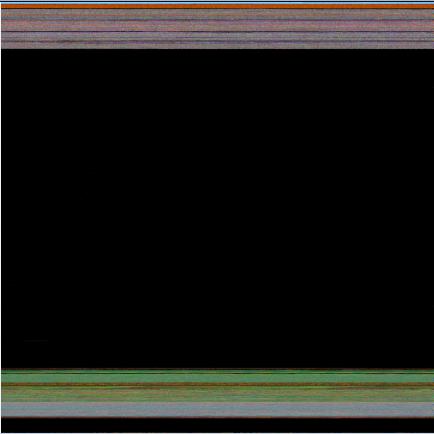
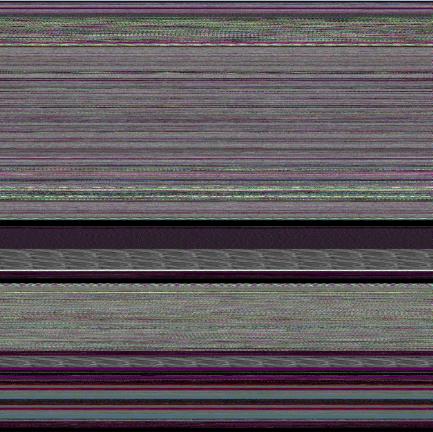
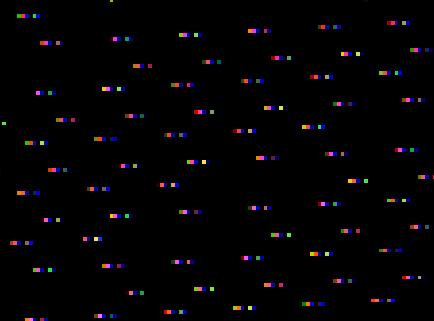
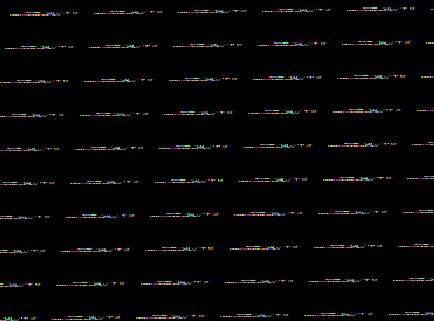
If we zoom in the black area we would see the following pattern:
Colored lines inside are heap control structures that are created for every allocated block of memory. If this is correct then allocating smaller memory blocks would create a hatched pattern. And this is true indeed. The following program leaks 256 byte memory blocks:
#include "stdafx.h"

#include <windows.h>
int _tmain(int argc, _TCHAR* argv[])

{

  while (true)

  {

    printf("%x\n", (UINT_PTR)malloc(0xFF));

    Sleep(1000/0xFF);

  }
  return 0;

}
The corresponding process memory picture and zoomed heap area are the following:
Making allocations 4 times smaller makes heap area to look hatched and zoomed picture is more densely packed by heap control structures:
#include "stdafx.h"

#include <windows.h>
int _tmain(int argc, _TCHAR* argv[])

{

  while (true)

  {

    printf("%x\n", (UINT_PTR)malloc(0xFF/4));

    Sleep((1000/0xFF)/4);

  }
  return 0;

}
Here is another example. One service was increasing its memory constantly. The crash dump picture shows huge hatched dark region in the middle:
and if we zoom in this region:
Because the pattern and allocation size look uniform it could be the true heap memory leak for some operation that allocates constant size buffers. After opening the dump and looking at heap segments that had grown the most we see the same allocation size indeed:
0:000> !.\w2kfre\ntsdexts.heap -h 5

HEAPEXT: Unable to get address of NTDLL!NtGlobalFlag.

Index   Address  Name      Debugging options enabled

  1:   00140000

  2:   00240000

  3:   00310000

  4:   00330000

  5:   00370000

    Segment at 00370000 to 00380000 (00010000 bytes committed)

    Segment at 01680000 to 01780000 (00100000 bytes committed)

    Segment at 019C0000 to 01BC0000 (00200000 bytes committed)

    Segment at 01BC0000 to 01FC0000 (00400000 bytes committed)

    Segment at 01FC0000 to 027C0000 (00800000 bytes committed)

    Segment at 027C0000 to 037C0000 (01000000 bytes committed)

    Segment at 037C0000 to 057C0000 (02000000 bytes committed)

    Segment at 057C0000 to 097C0000 (00155000 bytes committed)

…

…

…

    057B96E0: 01048 . 01048 [07] - busy (1030), tail fill

    057BA728: 01048 . 01048 [07] - busy (1030), tail fill

    057BB770: 01048 . 01048 [07] - busy (1030), tail fill

    057BC7B8: 01048 . 01048 [07] - busy (1030), tail fill

    057BD800: 01048 . 01048 [07] - busy (1030), tail fill

    057BE848: 01048 . 01048 [07] - busy (1030), tail fill

    057BF890: 01048 . 00770 [14] free fill

  Heap entries for Segment07 in Heap 370000

    057C0040: 00040 . 01048 [07] - busy (1030), tail fill

    057C1088: 01048 . 01048 [07] - busy (1030), tail fill

    057C20D0: 01048 . 01048 [07] - busy (1030), tail fill

    057C3118: 01048 . 01048 [07] - busy (1030), tail fill

    057C4160: 01048 . 01048 [07] - busy (1030), tail fill

    057C51A8: 01048 . 01048 [07] - busy (1030), tail fill

…

…

…
- Dmitry Vostokov @ DumpAnalysis.org -