Manual dump, virtualized process, stack trace collection, multiple exceptions, optimized code, wild code pointer, incorrect stack trace and hidden exception: pattern cooperation
June 4th, 2009The following WER dialog appeared after I copied an RTF text from an e-mail client to IE while editing another blog post:
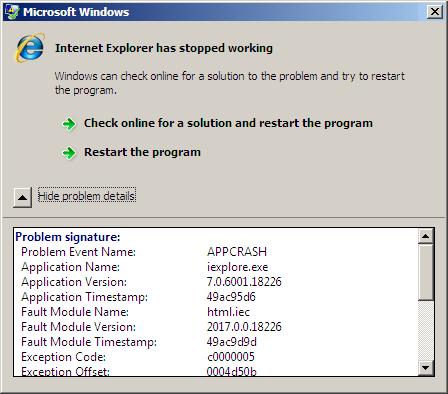
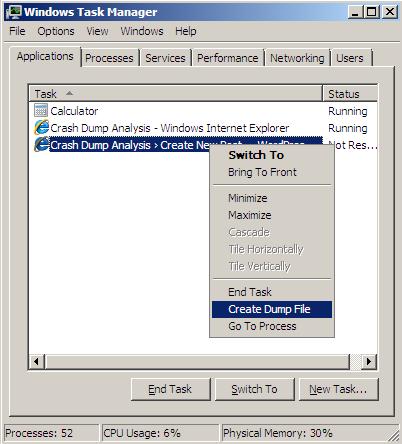
Although the dialog points to html.iec it is good to show the basic techniques for component identification using WinDbg. I took a manual user dump of that unresponsive process while it was showing that dialog above using Task Manager:
The saved process memory dump shows that IE was virtualized 32-bit process running on x64 Windows:
STACK_TEXT:

00000000`000dee18 00000000`75bbab46 : wow64cpu!TurboDispatchJumpAddressEnd+0xef

00000000`000deec0 00000000`75bba14c : wow64!Wow64SystemServiceEx+0×27a

00000000`000deef0 00000000`778f52d3 : wow64!Wow64LdrpInitialize+0×4b4

00000000`000df450 00000000`778f5363 : ntdll!CsrClientConnectToServer+0×493

00000000`000df700 00000000`778e85ce : ntdll!CsrClientConnectToServer+0×523

00000000`000df7b0 00000000`00000000 : ntdll!LdrInitializeThunk+0xe
However, even after switching to x86 mode, !analyze -v doesn’t report any signs of exception violation, c0000005, seen from WER dialog above:
0:000> .load wow64exts; .effmach x86

Effective machine: x86 compatible (x86)
0:000:x86> !analyze -v

[...]
EXCEPTION_RECORD:  ffffffffffffffff -- (.exr 0xffffffffffffffff)

ExceptionAddress: 0000000000000000

   ExceptionCode: 80000003 (Break instruction exception)

  ExceptionFlags: 00000000

NumberParameters: 0
ERROR_CODE: (NTSTATUS) 0x80000003 - {EXCEPTION} Breakpoint A breakpoint has been reached.
STACK_TEXT:

0027e428 7679e91a ntdll_77a60000!NtWaitForMultipleObjects+0x15

0027e4c4 76a58f76 kernel32!WaitForMultipleObjectsEx+0x11d

0027e518 75ad6071 user32!RealMsgWaitForMultipleObjectsEx+0x14d

WARNING: Frame IP not in any known module. Following frames may be wrong.

0027e538 75ad61f0 ieui+0x6071

0027e560 75ad6196 ieui+0x61f0

0027e59c 7291ffc6 ieui+0x6196

0027e5a8 7290f579 ieframe!BrowserThreadProc+0x3f

0027e5cc 7290f4c7 ieframe!BrowserNewThreadProc+0x7b

0027f63c 728fd1ba ieframe!SHOpenFolderWindow+0x188

0027f86c 013133c3 ieframe!IEWinMain+0x2d9

0027fcb0 0131325a iexplore!wWinMain+0x27b

0027fd44 7680e4a5 iexplore!_initterm_e+0x1b1

0027fd50 77adcfed kernel32!BaseThreadInitThunk+0xe

0027fd90 77add1ff ntdll_77a60000!__RtlUserThreadStart+0x23

0027fda8 00000000 ntdll_77a60000!_RtlUserThreadStart+0x1b
We list all threads for any exception processing signs and we find one such thread indeed:
0:002:x86> ~*kc 100
[...]
2 Id: 404.ba4 Suspend: 0 Teb: 7efaa000 Unfrozen
ntdll_77a60000!NtWaitForMultipleObjects

kernel32!WaitForMultipleObjectsEx

kernel32!WaitForMultipleObjects

kernel32!WerpReportFaultInternal

kernel32!WerpReportFault

kernel32!UnhandledExceptionFilter

ntdll_77a60000!__RtlUserThreadStart

ntdll_77a60000!_EH4_CallFilterFunc

ntdll_77a60000!_except_handler4

ntdll_77a60000!ExecuteHandler2

ntdll_77a60000!ExecuteHandler

ntdll_77a60000!KiUserExceptionDispatcher

WARNING: Frame IP not in any known module. Following frames may be wrong.

0×0

html!LwMultDivRU

html!FMarkListCallback

html!JcCalcFromXaExtents

html!EmitNonBreakingSpace

html!FEmitHtmlFnOtag

html!ConvertRtfToForeign

html!FceRtfToForeign

html!RtfToForeign32

mshtmled!CRtfToHtmlConverter::ExternalRtfToInternalHtml

mshtmled!CRtfToHtmlConverter::StringRtfToStringHtml

mshtmled!CRtfToHtmlConverter::StringRtfToStringHtml

mshtmled!CHTMLEditor::ConvertRTFToHTML

mshtmled!CPasteCommand::PasteFromClipboard

mshtmled!CPasteCommand::PrivateExec

mshtmled!CCommand::Exec

mshtmled!CMshtmlEd::Exec

mshtml!CEditRouter::ExecEditCommand

mshtml!CDoc::ExecHelper

mshtml!CFrameSite::Exec

mshtml!CDoc::RouteCTElement

mshtml!CDoc::ExecHelper

mshtml!CDoc::Exec

mshtml!CDoc::OnCommand

mshtml!CDoc::OnWindowMessage

mshtml!CServer::WndProc

user32!InternalCallWinProc

user32!UserCallWinProcCheckWow

user32!SendMessageWorker

user32!SendMessageW

mshtml!CElement::PerformTA

mshtml!CDoc::PerformTA

mshtml!CDoc::PumpMessage

mshtml!CDoc::DoTranslateAccelerator

mshtml!CServer::TranslateAcceleratorW

mshtml!CDoc::TranslateAcceleratorW

ieframe!CProxyActiveObject::TranslateAcceleratorW

ieframe!CDocObjectView::TranslateAcceleratorW

ieframe!CCommonBrowser::v_MayTranslateAccelerator

ieframe!CShellBrowser2::_MayTranslateAccelerator

ieframe!CShellBrowser2::v_MayTranslateAccelerator

ieframe!CTabWindow::_TabWindowThreadProc

kernel32!BaseThreadInitThunk

ntdll_77a60000!__RtlUserThreadStart

ntdll_77a60000!_RtlUserThreadStart
[...]
The same stack fragment with function parameters has a zero for its UnhandledExceptionFilter first parameter, perhaps because of optimized code reusing local variable slots, and we cannot apply .exptr meta-command:
0:002:x86> ~2kv

ChildEBP RetAddr  Args to Child

0361d938 7679e91a 00000002 0361d988 00000001 ntdll_77a60000!NtWaitForMultipleObjects+0x15

0361d9d4 767949d9 0361d988 0361da24 00000000 kernel32!WaitForMultipleObjectsEx+0x11d

0361d9f0 7684573d 00000002 0361da24 00000000 kernel32!WaitForMultipleObjects+0x18

0361da5c 76845969 0361db2c 00000001 00000001 kernel32!WerpReportFaultInternal+0x16d

0361da70 7681c66f 0361db2c 00000001 35137a6c kernel32!WerpReportFault+0x70

0361dafc 77add03e 00000000 77aaf2d0 00000000 kernel32!UnhandledExceptionFilter+0×1b5

0361db04 77aaf2d0 00000000 0361fe04 77a8da38 ntdll_77a60000!__RtlUserThreadStart+0×6f

0361db18 77b129b3 00000000 00000000 00000000 ntdll_77a60000!_EH4_CallFilterFunc+0×12

0361db40 77a83099 fffffffe 0361fdf4 0361dc7c ntdll_77a60000!_except_handler4+0×8e

0361db64 77a8306b 0361dc2c 0361fdf4 0361dc7c ntdll_77a60000!ExecuteHandler2+0×26

0361dc14 77a82eff 0161dc2c 0361dc7c 0361dc2c ntdll_77a60000!ExecuteHandler+0×24

0361dc18 0161dc2c 0361dc7c 0361dc2c 0361dc7c ntdll_77a60000!KiUserExceptionDispatcher+0xf

WARNING: Frame IP not in any known module. Following frames may be wrong.

0361df5c 72333b0e 07feaee4 0000001f 00000000 0×161dc2c

0361df74 72332ba9 00000000 0361dffc 00000000 html!LwMultDivRU+0×4b6

0361dfb8 7233518a 0361dffc 0000000c 0361e074 html!FMarkListCallback+0×56c

0361dfc8 723368b7 0000001f 0361dffc 0000000f html!JcCalcFromXaExtents+0×91

0361e074 723370c5 0000000f 00000000 000007d0 html!EmitNonBreakingSpace+0×445

0361e1a0 723407ff 00000000 0000000f 00000104 html!FEmitHtmlFnOtag+0×17d

0361e1c4 7231c6a8 00000001 00000000 00000000 html!ConvertRtfToForeign+0×105

0361e64c 7231c745 00ed03bc 00000000 00ed0374 html!FceRtfToForeign+0×266
Also the transition from html.iec module to exception processing code is through an invalid address 0×161dc2c so we might guess that this was an instance of wild code pointer or the case of incorrect stack trace. However using techniques to get exception context from hidden exceptions we get the following stack trace:
0:002:x86> .cxr 0361dc7c

eax=0000004e ebx=09d5755f ecx=07feaee4 edx=07feaf08 esi=07feaee4 edi=00000000

eip=7233d50b esp=0361df48 ebp=0361df5c iopl=0  nv up ei pl nz na pe nc

cs=0023 ss=002b ds=002b es=002b fs=0053 gs=002b efl=00010206

html!FPseudoStyleBis+0×26:

7233d50b 0fb70f          movzx   ecx,word ptr [edi]       ds:002b:00000000=????
0:002:x86> kL 100

ChildEBP RetAddr

0361df50 7233d597 html!FPseudoStyleBis+0x26

0361df5c 72333b0e html!BisFromLpxszStyle+0x1c

0361df74 72332ba9 html!LwMultDivRU+0x4b6

0361dfb8 7233518a html!FMarkListCallback+0x56c

0361dfc8 723368b7 html!JcCalcFromXaExtents+0x91

0361e074 723370c5 html!EmitNonBreakingSpace+0x445

0361e1a0 723407ff html!FEmitHtmlFnOtag+0x17d

0361e1c4 7231c6a8 html!ConvertRtfToForeign+0x105

0361e64c 7231c745 html!FceRtfToForeign+0x266

0361e674 744e5ad4 html!RtfToForeign32+0x51

0361eabc 744e5c83 mshtmled!CRtfToHtmlConverter::ExternalRtfToInternalHtml+0x163

0361ef10 7449cc15 mshtmled!CRtfToHtmlConverter::StringRtfToStringHtml+0x11a

0361ef2c 7449cd81 mshtmled!CRtfToHtmlConverter::StringRtfToStringHtml+0x38

0361ef40 744cdcea mshtmled!CHTMLEditor::ConvertRTFToHTML+0x12

0361efac 744ce392 mshtmled!CPasteCommand::PasteFromClipboard+0x2c0

0361f01c 7448d218 mshtmled!CPasteCommand::PrivateExec+0x47a

0361f040 7448d1ad mshtmled!CCommand::Exec+0x4b

0361f064 74000d14 mshtmled!CMshtmlEd::Exec+0xf9

0361f094 73ff88a8 mshtml!CEditRouter::ExecEditCommand+0xd6

0361f43c 7415eccf mshtml!CDoc::ExecHelper+0x338d

0361f488 73ff8a2f mshtml!CFrameSite::Exec+0x264

0361f4bc 73ff87af mshtml!CDoc::RouteCTElement+0xf1

0361f854 73ff8586 mshtml!CDoc::ExecHelper+0x325e

0361f874 740a0e7b mshtml!CDoc::Exec+0x1e

0361f8ac 7401a708 mshtml!CDoc::OnCommand+0x9c

0361f9c0 73f297e1 mshtml!CDoc::OnWindowMessage+0x841

0361f9ec 76a58807 mshtml!CServer::WndProc+0x78

0361fa18 76a58962 user32!InternalCallWinProc+0x23

0361fa90 76a5c4b6 user32!UserCallWinProcCheckWow+0x109

0361fad4 76a5c517 user32!SendMessageWorker+0x55b

0361faf8 7400fb9b user32!SendMessageW+0x7f

0361fb24 73f68e5a mshtml!CElement::PerformTA+0x71

0361fb44 73f68db9 mshtml!CDoc::PerformTA+0xd8

0361fbc0 73ff381c mshtml!CDoc::PumpMessage+0x8e0

0361fc74 73ff3684 mshtml!CDoc::DoTranslateAccelerator+0x33f

0361fc90 73ff34cc mshtml!CServer::TranslateAcceleratorW+0x56

0361fcb0 7296f550 mshtml!CDoc::TranslateAcceleratorW+0x83

0361fccc 7296f600 ieframe!CProxyActiveObject::TranslateAcceleratorW+0x30

0361fcf0 7296fca1 ieframe!CDocObjectView::TranslateAcceleratorW+0xb1

0361fd10 7296faf4 ieframe!CCommonBrowser::v_MayTranslateAccelerator+0xda

0361fd3c 7296f7b0 ieframe!CShellBrowser2::_MayTranslateAccelerator+0x68

0361fd4c 7296f7f5 ieframe!CShellBrowser2::v_MayTranslateAccelerator+0x15

0361fdb8 7680e4a5 ieframe!CTabWindow::_TabWindowThreadProc+0x264

0361fdc4 77adcfed kernel32!BaseThreadInitThunk+0xe

0361fe04 77add1ff ntdll_77a60000!__RtlUserThreadStart+0x23

0361fe1c 00000000 ntdll_77a60000!_RtlUserThreadStart+0x1b
Then we can use lmv command to see the component version:
0:002:x86> lmv m html

start             end                 module name

722f0000 7236f000   html     # (pdb symbols)          c:\mss\html.pdb\34A9E6645AEA4E6A83EA51D2849C731C1\html.pdb

    Loaded symbol image file: html.iec

    Image path: C:\Windows\System32\html.iec

    Image name: html.iec

    Timestamp:        Tue Mar 03 03:26:33 2009 (49ACA369)

    CheckSum:         00086241

    ImageSize:        0007F000

    File version:     2017.0.0.18226

    Product version:  6.0.6001.18226

    File flags:       0 (Mask 3F)

    File OS:          40004 NT Win32

    File type:        2.0 Dll

    File date:        00000000.00000000

    Translations:     0409.04b0

    CompanyName:      Microsoft Corporation

    ProductName:      Microsoft® Windows® Operating System

    InternalName:     HTML.IEC

    OriginalFilename: HTML.IEC

    ProductVersion:   6.0.6001.18226

    FileVersion:      2017.0.0.18226 (vistasp1_gdr.090302-1506)

    FileDescription:  Microsoft HTML Converter

    LegalCopyright:   © Microsoft Corporation. All rights reserved.
- Dmitry Vostokov @ DumpAnalysis.org -


 or
or 


 or
or  or
or 

 or
or