Archive for the ‘Trace Analysis Patterns’ Category
Tuesday, January 12th, 2010
Inter-Correlation pattern is analogous to the previously described Intra-Correlation pattern but involves several traces from possibly different trace agents recorded (most commonly) at the same time or during an overlapping time interval:
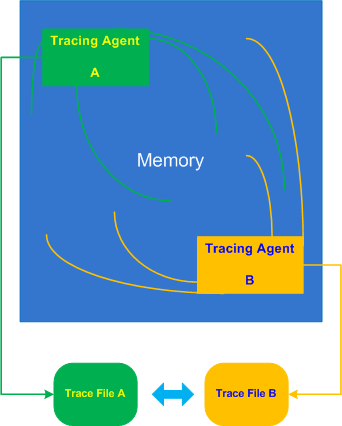
Let’s look at a typical example of an application subclassing windows to add additional look and feel element to its GUI or thjat hooks into window messaging. Suppose this application also records important trace points like window parameters before and after subclassing using ETW technology (Event Tracing for Windows). When we run the application in terminal services environment all windows (including other processes) are shown with an incorrect dimension. We therefore request the application trace and in addition WindowHistory trace to see how coordinates of all windows are changed over time. We easily find some Basic Facts in both traces such as window class name or time but it looks like window handle is different. In another set of traces recorded for comparison we have same window handle values, class name is absent from the ETW trace but a process and thread ID for the same window handle are different. We, therefore, don’t see a correlation between these traces and suspect that both traces in 2 sets were recorded in different terminal sessions, for example:
ETW trace:
#      PID   TID   Time          Message

[…]

46750  5890  6960  10:17:18.825  Subclassing, handle=0×100B8, class=MyWindowClass, […]

[…]
WindowHistory trace:
Handle: 0001006E Class: “MyWindowClass” Title: “”

Captured at: 10:17:19:637

   Process ID: 19e0

Thread ID: 16e4

Parent: 0

Screen position (l,t,r,b): (-2,896,1282,1026)

Client rectangle (l,t,r,b): (0,0,1276,122)

Visible: true

Window placement command: SW_SHOWNORMAL

Foreground: false

HungApp: false

Minimized: false

Maximized: false

[…]
- Dmitry Vostokov @ TraceAnalysis.org -
Posted in CDF Analysis Tips and Tricks, Debugging, Software Trace Analysis, Trace Analysis Patterns | No Comments »
Thursday, January 7th, 2010
Some practical engineers asked me how do Debugged! MZ/PE magazine back covers look like from a birds eye view:
One engineer even commented that they look better and better (counterclockwise) :-)
- Dmitry Vostokov @ DumpAnalysis.org -
Posted in Announcements, Art, Books, CDF Analysis Tips and Tricks, Crash Dump Analysis, Crash Dump Patterns, Debugged! MZ/PE, Debugging, Publishing, Software Trace Analysis, Trace Analysis Patterns, WinDbg Tips and Tricks | No Comments »
Thursday, December 31st, 2009
What will you do confronted with a one million trace messages recorded between 10:44:15 and 10:46:55 with an average trace statement current of 7,000 msg/s from dozens of modules and having a one sentence problem description? One solution is to try to search for a specific vocabulary relevant to the problem description, for example, if a problem is an intermittent re-authentication then we might try to search for a word “password” or a similar one drawn from a troubleshooting domain vocabulary. So it is useful to have a Vocabulary Index to search for. Hence, the same name of this pattern. In our trace example, the search for “password” jumps straight to a small activity region of authorization modules starting from the message number #180,010 and the last “password” occurrence is in the message #180,490 that narrows initial analysis region to just 500 messages. Note the similarity here between a book and its index and a trace as a software narrative and its vocabulary index.
- Dmitry Vostokov @ TraceAnalysis.org -
Posted in CDF Analysis Tips and Tricks, Debugging, Software Narratology, Software Trace Analysis, Trace Analysis Patterns | 1 Comment »
Sunday, December 20th, 2009
“Memory dumps are facts.”
I’m very excited to announce that Volume 3 is available in paperback, hardcover and digital editions:
Memory Dump Analysis Anthology, Volume 3
Table of Contents
In two weeks paperback edition should also appear on Amazon and other bookstores. Amazon hardcover edition is planned to be available in January 2010.
The amount of information was so voluminous that I had to split the originally planned volume into two. Volume 4 should appear by the middle of February together with Color Supplement for Volumes 1-4.
- Dmitry Vostokov @ DumpAnalysis.org -
Posted in .NET Debugging, Aesthetics of Memory Dumps, Announcements, AntiPatterns, Art, Assembly Language, Books, Bugtations, C and C++, CDA Pattern Classification, CDF Analysis Tips and Tricks, Certification, Citrix, Code Reading, Common Mistakes, Computer Science, Crash Dump Analysis, Crash Dump Patterns, Crash Dumps for Dummies, DebugWare Patterns, Debugging, Debugging Slang, Deep Down C++, Education and Research, Escalation Engineering, Fun with Crash Dumps, Hardware, Horrors of Computation, Kernel Development, Mathematics of Debugging, Memiotics (Memory Semiotics), Memoidealism, Memoretics, Memory Analysis Culture, Memory Analysis Forensics and Intelligence, Memory Space Art, Memory Visualization, Minidump Analysis, Multithreading, Philosophy, Poetry, Publishing, Science of Memory Dump Analysis, Science of Software Tracing, Security, Software Architecture, Software Defect Construction, Software Engineering, Software Narratology, Software Technical Support, Software Trace Analysis, Software Trace Visualization, Software Tracing for Dummies, Software Victimology, Stack Trace Collection, Testing, Tools, Trace Analysis Patterns, Training and Seminars, Troubleshooting Methodology, Victimware, Virtualization, Vista, Visual Dump Analysis, WinDbg Scripts, WinDbg Tips and Tricks, WinDbg for GDB Users, Windows 7, Windows Server 2008, Windows System Administration | 1 Comment »
Wednesday, December 16th, 2009
Finally, after the long delay, the issue is available in print on Amazon and through other sellers:
Debugged! MZ/PE: Software Tracing

- Dmitry Vostokov @ DumpAnalysis.org -
Posted in Announcements, Books, CDF Analysis Tips and Tricks, Computer Science, Crash Dump Analysis, Crash Dump Patterns, Debugged! MZ/PE, Debugging, Education and Research, Fun with Crash Dumps, Memoretics, Memory Visualization, Publishing, Science of Memory Dump Analysis, Science of Software Tracing, Software Technical Support, Software Trace Analysis, Software Trace Visualization, Testing, Tools, Trace Analysis Patterns, Training and Seminars, Troubleshooting Methodology, Visual Dump Analysis | 1 Comment »
Tuesday, November 17th, 2009
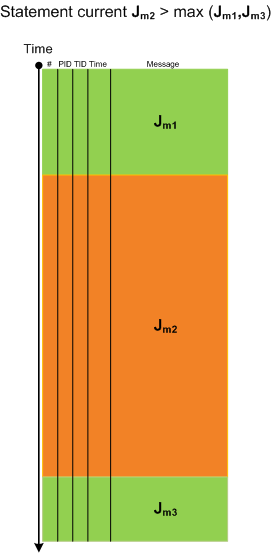
When looking at lengthy traces with thousands and millions of messages (trace statements) we can see regions of activity where statement current (Jm, msg/s) is much higher than in surrounding temporal regions. Hence the name of this pattern, Activity Region. Here is an illustration for a typical ETW/CDF trace where a middle region of activity (Jm2) signifies a system performing some response function like a user session initialization and application launch:
- Dmitry Vostokov @ TraceAnalysis.org -
Posted in CDF Analysis Tips and Tricks, Debugging, Software Trace Analysis, Software Trace Visualization, Trace Analysis Patterns | 8 Comments »
Saturday, November 7th, 2009
Birds eye view of software traces makes it easier to see their coarse blocked structure:
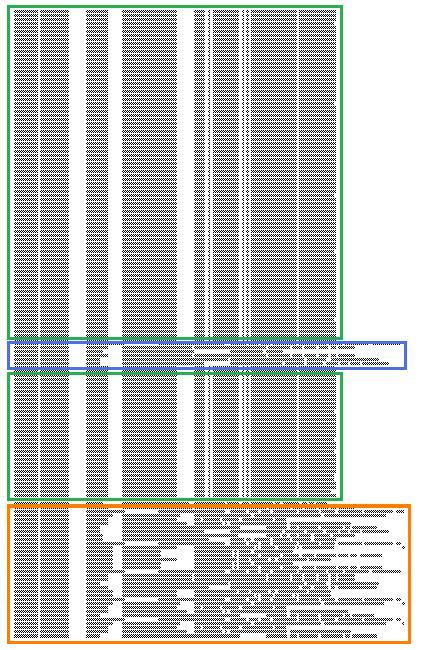
where further finer structure is discernible and even nested blocks:
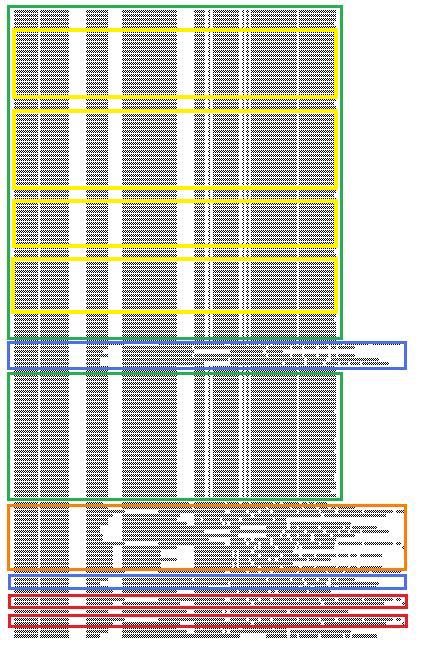
Some blocks of output can be seen when scrolling trace viewer output but if a viewer support zooming it is possible to get an overview and jump directly into a Characteristic Message Block, for example, debug messages of repeated attempts to query a database. If a viewer supports message coloring it also helps. Sometimes this technique is useful to ignore bulk messages and start the analysis around block boundaries.
- Dmitry Vostokov @ TraceAnalysis.org -
Posted in Citrix, Debugging, Memory Visualization, Software Trace Analysis, Software Trace Visualization, Trace Analysis Patterns | 2 Comments »
Friday, November 6th, 2009
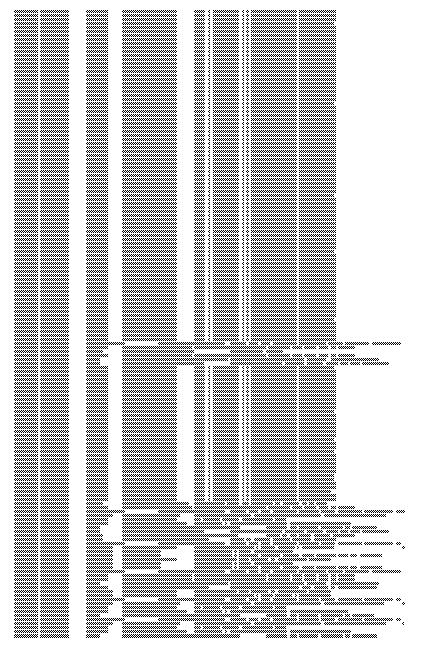
Here is a fragment of a condensed view of a CDF (ETW-based) trace imported into MS Word:
- Dmitry Vostokov @ TraceAnalysis.org -
Posted in CDF Analysis Tips and Tricks, Debugging, Memory Visualization, Software Trace Analysis, Software Trace Visualization, Trace Analysis Patterns | 1 Comment »
Monday, October 12th, 2009
It was reported that one important system functionality is not available from time to time but is usually restored to normal operation when one service (ServiceA) is restarted. That service was coupled with ServiceB and their memory dumps were saved and delivered for analysis. Unfortunately, nothing raising a suspicion was found inside. To tackle the problem it was advised to get an ETW trace from the system including modules from ServiceA together with process memory dumps when the problem happens again. The trace revealed the following message with exceptionally high statement current of 72,118 msg/s (and also superdense - no other types of trace statements were found inside):
#      PID    TID    Message

[...]

823296 11300  2484   ServiceB notification failed, error code = 6

[…]
Where the error 6 is invalid handle error:
0:000> !error 6

Error code: (Win32) 0x6 (6) - The handle is invalid.
The thread 2484 (9B4) corresponds to thread #22 in ServiceA and it is blocked waiting for an LPC reply:
  22  Id: 2c24.9b4 Suspend: 1 Teb: 7ffa4000 Unfrozen

ChildEBP RetAddr

020cfa18 7c827899 ntdll!KiFastSystemCallRet

020cfa1c 77c80a6e ntdll!ZwRequestWaitReplyPort+0xc

020cfa68 77c7fcf0 rpcrt4!LRPC_CCALL::SendReceive+0×230

020cfa74 77c80673 rpcrt4!I_RpcSendReceive+0×24

020cfa88 77ce315a rpcrt4!NdrSendReceive+0×2b

020cfe70 73077ca5 rpcrt4!NdrClientCall2+0×22e

020cfe88 73077c2a ServiceA!RpcNextNotification+0×1c

020cffb8 77e6482f ServiceA!EventWatcherThread+0×107

020cffec 00000000 kernel32!BaseThreadStart+0×34
Suspicious of a loop we confirm that the thread was spiking:
0:000> !runaway f

 User Mode Time

  Thread       Time

  22:9b4       0 days 0:41:27.453

  19:4768      0 days 0:00:00.109

[…]

Kernel Mode Time

  Thread       Time

  22:9b4       0 days 0:24:27.984

  23:407c      0 days 0:00:00.437

[…]

 Elapsed Time

  Thread       Time

[…]

  22:9b4       0 days 5:26:21.499

[…]
Looking at the raw stack data (using !teb and dds WinDbg commands) we see a hidden processed exception:
020cf6c4  020cf4c0

020cf6c8  020cf6d8

020cf6cc  020cf718

020cf6d0  7c828290 ntdll!_except_handler3

020cf6d4  7c82a120 ntdll!CheckHeapFillPattern+0x54

020cf6d8  020cf6e8

020cf6dc  00140000

020cf6e0  7c82a144 ntdll!RtlpAllocateFromHeapLookaside+0x13

020cf6e4  00140868

020cf6e8  020cf910

020cf6ec  7c82a0d8 ntdll!RtlAllocateHeap+0x1dd

020cf6f0  7c82a11c ntdll!RtlAllocateHeap+0xee7

020cf6f4  73074548

020cf6f8  00000000

020cf6fc  00000000

020cf700  00000000

020cf704  00000000

020cf708  00218ef0

020cf70c  020cf728

020cf710  7c82a791 ntdll!RtlpCoalesceFreeBlocks+0x383

020cf714  020d0000

020cf718  00218ef0

020cf71c  020cf9fc

020cf720  7c82865c ntdll!RtlRaiseException+0×3d

020cf724  020ce000

020cf728  020cf72c

020cf72c  00010007

020cf730  020cf810

020cf734  7c829f5d ntdll!RtlFreeHeap+0×20e

020cf738  001407d8

020cf73c  7c829f79 ntdll!RtlFreeHeap+0×70f

020cf740  00000000
After some time another pair of coupled processes was collected where ServiceA(2) was hanging on an LPC request again but this time ServiceB(2) had one thread blocked by a GUI property sheet processing code (a variant of Message Box pattern):
0:015> kL 100

ChildEBP RetAddr

017fb9f0 7c827d29 ntdll!KiFastSystemCallRet

017fb9f4 77e61d1e ntdll!ZwWaitForSingleObject+0xc

017fba64 77e61c8d kernel32!WaitForSingleObjectEx+0xac

017fba78 6dfcdac3 kernel32!WaitForSingleObject+0x12

[...]

017fbdac 730801c5 compstui!CommonPropertySheetUIW+0×17

017fbdf4 73080f5d ServiceB!CommonPropertySheetUI+0×43

WARNING: Stack unwind information not available. Following frames may be wrong.

017fc27c 5c3ae4e6 ComponentA!DllGetClassObject+0xbf4e

[…]

017ff8f8 77ce33e1 rpcrt4!Invoke+0×30

017ffcf8 77ce35c4 rpcrt4!NdrStubCall2+0×299

017ffd14 77c7ff7a rpcrt4!NdrServerCall2+0×19

017ffd48 77c8042d rpcrt4!DispatchToStubInCNoAvrf+0×38

017ffd9c 77c80353 rpcrt4!RPC_INTERFACE::DispatchToStubWorker+0×11f

017ffdc0 77c811dc rpcrt4!RPC_INTERFACE::DispatchToStub+0xa3

017ffdfc 77c812f0 rpcrt4!LRPC_SCALL::DealWithRequestMessage+0×42c

017ffe20 77c88678 rpcrt4!LRPC_ADDRESS::DealWithLRPCRequest+0×127

017fff84 77c88792 rpcrt4!LRPC_ADDRESS::ReceiveLotsaCalls+0×430

017fff8c 77c8872d rpcrt4!RecvLotsaCallsWrapper+0xd

017fffac 77c7b110 rpcrt4!BaseCachedThreadRoutine+0×9d

017fffb8 77e6482f rpcrt4!ThreadStartRoutine+0×1b

017fffec 00000000 kernel32!BaseThreadStart+0×34
ComponentA was also found loaded in ServiceB(1) user dump and in the ServiceB memory dump from the initial coupled pair where nothing was found before. The timestamp of that component was old enough (lmv command) to warrant more attention to it and contact its ISV.
- Dmitry Vostokov @ DumpAnalysis.org -
Posted in Crash Dump Analysis, Crash Dump Patterns, Debugging, Software Trace Analysis, Trace Analysis Patterns | No Comments »
Friday, October 9th, 2009
This is the first case study here that shows an interplay of memory dump analysis (DA) and software trace analysis (TA) patterns, what I call DATA analysis patterns (or DA+TA).
It was reported that one process was blocking vital server functionality. After the process restart the problem was gone away. A complete memory dump was saved on the next occurrence and it revealed critical section wait chains in that process but no critical section deadlocks:
0: kd> .process /r /p 87f76020

Implicit process is now 87f76020

Loading User Symbols

[...]
0: kd> !cs -l -o -s

-----------------------------------------

DebugInfo          = 0x0016c6d8

Critical section   = 0×0032be30 (+0×32BE30)

LOCKED

LockCount          = 0×34

WaiterWoken        = No

OwningThread       = 0×00001c64

RecursionCount     = 0×1

LockSemaphore      = 0×624

SpinCount          = 0×00000000

OwningThread       = .thread 86396db0

ntdll!RtlpStackTraceDataBase is NULL. Probably the stack traces are not enabled.

[…]
The thread 86396db0 (TID 1c64) that blocked more than 50 threads (0×34) was blocked itself sleeping for more than 6 seconds:
0: kd> .thread 86396db0

Implicit thread is now 86396db0
0: kd> kL 100

  *** Stack trace for last set context - .thread/.cxr resets it

ChildEBP RetAddr

ae7f8c98 8083d5b1 nt!KiSwapContext+0x26

ae7f8cc4 8083cf69 nt!KiSwapThread+0x2e5

ae7f8d0c 8092b03f nt!KeDelayExecutionThread+0x2ab

ae7f8d54 80833bef nt!NtDelayExecution+0x84

ae7f8d54 7c82860c nt!KiFastCallEntry+0xfc

1020e8ac 7c826f69 ntdll!KiFastSystemCallRet

1020e8b0 77e41ed5 ntdll!NtDelayExecution+0xc

1020e918 77e424fd kernel32!SleepEx+0x68

1020e928 67739357 kernel32!Sleep+0xf

1020e944 6773c3a2 ComponentA!DB_Driver_Command+0xa7

[…]

1020ec64 67485393 ComponentB!DatabaseSearch+0×34

[…]

1020ffb8 77e6482f msvcrt!_endthreadex+0xa3

1020ffec 00000000 kernel32!BaseThreadStart+0×34
0: kd> kv

  *** Stack trace for last set context - .thread/.cxr resets it

ChildEBP RetAddr  Args to Child

[...]

1020e918 77e424fd 00001b00 00000000 1020e944 kernel32!SleepEx+0x68 (FPO: [SEH])

1020e928 67739357 00001b00 00000000 0032ac6c kernel32!Sleep+0xf (FPO: [1,0,0])

[…]
0: kd> ? 1b00 / 0n1000

Evaluate expression: 6 = 00000006
Critical section it owns shows high contention count too:
0: kd> dt -r1 _RTL_CRITICAL_SECTION   0x0032be30

ProcessA!_RTL_CRITICAL_SECTION

   +0x000 DebugInfo        : 0x0016c6d8 _RTL_CRITICAL_SECTION_DEBUG

      +0x000 Type             : 0

      +0x002 CreatorBackTraceIndex : 0

      +0x004 CriticalSection  : 0x0032be30 _RTL_CRITICAL_SECTION

      +0x008 ProcessLocksList : _LIST_ENTRY [ 0x16c708 - 0x16c6b8 ]

      +0x010 EntryCount       : 0

      +0×014 ContentionCount  : 0xac352

      +0×018 Spare            : [2] 0×43005c

   +0×004 LockCount        : -210

   +0×008 RecursionCount   : 1

   +0×00c OwningThread     : 0×00001c64

   +0×010 LockSemaphore    : 0×00000624

   +0×014 SpinCount        : 0
Fortunately, that process had ETW tracing capability and its software trace recorded before the complete memory dump was saved the following recurrent periodic errorfrom different threads that confirms our observation about the possible problem with a database and explains thread delays we see (> 6 seconds for Sleep):
#    PID  TID  Time         Message

[...]

1972 2780 5992 10:05:11.005 Error: [DB Driver] Not enough space on temp disk

1973 2780 5992 10:05:11.005 Execute DB command sleeps on error (retry 26)

[...]

4513 2780 3292 10:06:02.942 Error: [DB Driver] Not enough space on temp disk

4514 2780 3292 10:06:02.942 Execute DB command sleeps on error (retry 11)

4515 2780 3292 10:06:09.598 Error: [DB Driver] Not enough space on temp disk

4516 2780 3292 10:06:09.598 Execute DB command sleeps on error (retry 12)

[…]
- Dmitry Vostokov @ DumpAnalysis.org -
Posted in Announcements, Complete Memory Dump Analysis, Crash Dump Analysis, Crash Dump Patterns, Software Trace Analysis, Trace Analysis Patterns | No Comments »
Saturday, September 26th, 2009
This is a revised, edited, cross-referenced and thematically organized volume of selected DumpAnalysis.org blog posts about crash dump analysis and debugging written in October 2008 - June 2009 for software engineers developing and maintaining products on Windows platforms, quality assurance engineers testing software on Windows platforms and technical support and escalation engineers dealing with complex software issues. The third volume features:
- 15 new crash dump analysis patterns
- 29 new pattern interaction case studies
- Trace analysis patterns
- Updated checklist
- Fully cross-referenced with Volume 1 and Volume 2
- New appendixes
Product information:
- Title: Memory Dump Analysis Anthology, Volume 3
- Author: Dmitry Vostokov
- Language: English
- Product Dimensions: 22.86 x 15.24
- Paperback: 404 pages
- Publisher: Opentask (20 December 2009)
- ISBN-13: 978-1-906717-43-8
- Hardcover: 404 pages
- Publisher: Opentask (30 January 2010)
- ISBN-13: 978-1-906717-44-5

Back cover features 3D computer memory visualization image.
- Dmitry Vostokov @ DumpAnalysis.org -
Posted in Announcements, AntiPatterns, Art, Assembly Language, Books, C and C++, CDF Analysis Tips and Tricks, Certification, Citrix, Code Reading, Common Mistakes, Computational Ghosts and Bug Hauntings, Computer Science, Countefactual Debugging, Crash Dump Analysis, Crash Dump Patterns, Crash Dumps for Dummies, DebugWare Patterns, Debugging, Debugging Slang, Deep Down C++, Education and Research, Escalation Engineering, Fun with Crash Dumps, Futuristic Memory Dump Analysis, Games for Debugging, Hardware, Horrors of Computation, Hyper-V, Intelligent Memory Movement, Kernel Development, Mathematics of Debugging, Memiotics (Memory Semiotics), Memoidealism, Memoretics, Memory Analysis Culture, Memory Analysis Forensics and Intelligence, Memory Dreams, Memory Dump Analysis Jobs, Memory Space Music, Memory Visualization, Memuonics, Minidump Analysis, Multithreading, Music for Debugging, New Acronyms, New Words, Occult Debugging, Philosophy, Poetry, Psi-computation, Publishing, Science of Memory Dump Analysis, Science of Software Tracing, Security, Software Architecture, Software Defect Construction, Software Engineering, Software Generalist, Software Narratology, Software Technical Support, Software Trace Analysis, Software Tracing for Dummies, Testing, Tools, Trace Analysis Patterns, Training and Seminars, Troubleshooting Methodology, Virtualization, Vista, Visual Dump Analysis, WinDbg Scripts, WinDbg Tips and Tricks, WinDbg for GDB Users, Windows 7, Windows Server 2008, Windows System Administration | No Comments »
Tuesday, September 22nd, 2009
Citrix released the powerful GUI CDF trace analyzer tool that can work with hundred Mb trace files with millions of trace messages:
http://support.citrix.com/article/CTX122741
I use it on day-to-day basis while analyzing CDF traces from terminal services environments and highly recommend. Its ability to quick filter out modules is indispensable when dealing with messages from hundreds of processes and thousands of threads. I haven’t tried it yet with MS TMF files though.
- Dmitry Vostokov @ DumpAnalysis.org -
Posted in Announcements, CDF Analysis Tips and Tricks, Citrix, Debugging, Software Technical Support, Software Trace Analysis, Tools, Trace Analysis Patterns | 1 Comment »
Thursday, September 10th, 2009
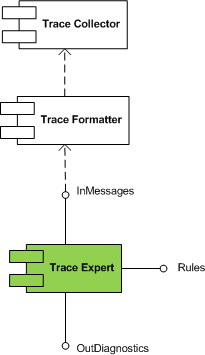
Trace Expert pattern came to my mind when I was writing about software trace patterns. It is a very lightweight expert system relying on trace collector and trace formatter (patterns to be written about soon). It is a module that takes a preformatted software trace message file or a buffer and a set of built in rules and uses simple search (peharps involving regular expressions) to dig out diagnostic information and provide troubleshooting and debugging directions.
This module is schematically depicted on the following UML component diagram:
- Dmitry Vostokov @ DumpAnalysis.org -
Posted in DebugWare Patterns, Debugging, Software Architecture, Software Technical Support, Software Trace Analysis, Tools, Trace Analysis Patterns, Troubleshooting Methodology | No Comments »
Tuesday, September 1st, 2009
Recently I came upon two software traces from working and non-working software environments that were a perfect example of Bifurcation Point pattern (the name is borrowed from catastrophe theory):
Working (issue is absent):
#   PID  TID  Message

[…]

25  2768 3056 Trace Statement A

26  3756 2600 Trace Statement B

27  3756 2600 Trace Statement C

[…]

149 3756  836 Trace Statement X (Query result: XXX)

150 3756  836 Trace Statement 150.1

151 3756  836 Trace Statement 151.1

152 3756  836 Trace Statement 152.1

153 3756  836 Trace Statement 153.1

[…]
Non-working (issue is present):
#   PID  TID  Message

[…]

27  2768 3056 Trace Statement A

28  3756 2176 Trace Statement B

29  3756 2176 Trace Statement C

[…]

151 3756 5940 Trace Statement Y (Query result: YYY)

152 3756 5940 Trace Statement 152.2

153 3756 5940 Trace Statement 153.2

154 3756 5940 Trace Statement 154.2

155 3756 5940 Trace Statement 155.2

[…]
First, we notice that in both traces PID are the same (2768 and 3756) and we can conclude that most likely both traces came from the same environment and session. Second, messages A, B, C and further are identical up to messages X and Y. The latter two messages differ greatly in their query results XXX and YYY. After that, message distribution differs greatly in both size and content. Despite the same tracing time, 15 seconds, statement current is 155 msg/s for working and 388 msg/s for non-working case.
Bifurcation points are easily observed when tracing noise ratio is small and, for example, in the case of Citrix terminal services environments, could be achieved by selecting appropriate tracing modules based on problem description or filtering irrelevant ones from full CDF traces.
- Dmitry Vostokov @ TraceAnalysis.org -
Posted in CDF Analysis Tips and Tricks, Citrix, Debugging, Software Trace Analysis, Trace Analysis Patterns | 1 Comment »
Tuesday, August 18th, 2009
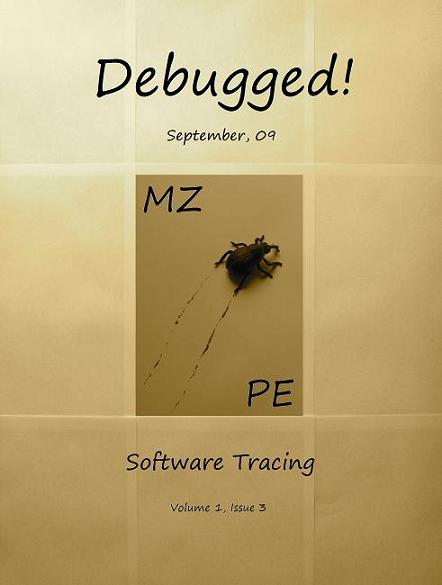
Finally, the front cover has materialized for this issue of Debugged! magazine:
Debugged! MZ/PE: Software Tracing (ISBN: 978-1906717797)
If you have an article idea or if you’d like to write an article for us please use the following contact form:
http://www.dumpanalysis.org/contact
The deadline for this issue is 25th of September.
- Dmitry Vostokov @ DumpAnalysis.org -
Posted in Announcements, Crash Dump Analysis, Debugged! MZ/PE, Debugging, Publishing, Software Technical Support, Software Trace Analysis, Trace Analysis Patterns | 1 Comment »
Thursday, August 6th, 2009
There is an obvious pattern called Missing Component. We don’t see trace statements we expect and wonder whether the component was not loaded, its container ceased to exist or simply it wasn’t selected for tracing. In many support cases there is a trade-off between tracing everything and the size of trace files. Customers and engineers usually prefer smaller files to analyze. However in the case of predictable and reproducible issues with short duration we can always select all components or deselect a few (instead of selecting a few). Here is the article for Citrix CDF tracing best practices and it can be applied to other software traces as well:
Tracing Best Practices
We can find an example from Discontinuity pattern where the possibility of a sudden and silent gap in trace statements could happen because not all necessary components were selected for tracing.
Sometimes, in cases when the missing component was selected for tracing but we don’t see any trace output from it other module traces can give us an indication, perhaps showing the load failure message. For example, Process Monitor tracing done in parallel can reveal load failures.
- Dmitry Vostokov @ TraceAnalysis.org -
Posted in CDF Analysis Tips and Tricks, Citrix, Debugging, Software Trace Analysis, Trace Analysis Patterns | 4 Comments »
Tuesday, August 4th, 2009
Sometimes there are reported delays in application startup, session initialization, long response times and simply the absence of response. All these problems can be reflected in software traces showing sudden gaps in threads of activity. I call this pattern Discontinuity per analogy with continuous and discontinuous functions in mathematics. Here is an example I came upon recently and it will be covered fully in the forthcoming pattern cooperation case study spanning both memory dump and trace analysis. One process was reported to have a long period of CPU spiking calculation and a CDF trace was recorded. When we open it we see this periodic error:
N   PID  TID  Time         Message

[…]

326 2592 5476 08:17:18.823 OpenRegistry: Attempting to open [… Hive path …]

327 2592 5476 08:17:18.824 OpenRegistry: Failed: 2

[…]
However when looking for any discontinuities for the thread 5476 we see this gap of more than 7 minutes:
N    PID  TID  Time         Message

[...]

3395 2592 5476 08:17:19.608 OpenRegistry: Attempting to open [... Hive path ...]

3396 2592 5476 08:17:19.608 OpenRegistry: Failed: 2

3461 2592 5476 08:24:31.137 OpenRegistry: Attempting to open [… Hive path …]

3462 2592 5476 08:24:31.137 OpenRegistry: Failed: 2

[…]
Therefore we have 3 possibilities here:
1. The process twice did lengthy CPU spiking calculations involving registry access and was quiet between them.
2. Registry access belonged to some background activity and ceased for 7 minutes and during that time it had CPU spiking intensive calculation.
3. This discontinuity is irrelevant because either the calculation module was not selected for tracing or it simply doesn’t have relevant tracing statement coverage for the code that does calculation.
Stay tuned because this story will be unfolded in other patterns and in the final case study.
- Dmitry Vostokov @ TraceAnalysis.org -
Posted in CDF Analysis Tips and Tricks, Debugging, Software Trace Analysis, Trace Analysis Patterns | 2 Comments »
Monday, August 3rd, 2009
When we have software traces that record process identifiers (PID) and thread identifiers (TID) it is important to differentiate between trace statements sorted by time and by Thread of Activity. The latter is simply the flow of trace messages sorted by TID and it is very helpful in cases with dense traces coming from hundreds of processes and components. Here is an example from MessageHistory bulk trace fragment showing different threads of activity in different colors:
Start time: 21:5:36:651

Format time: 21:5:43:133

Number of messages sent: 24736

Number of messages posted: 905
[...]

21:5:41:990 S PID: a7c TID: 554 HWND: 0×0000000000010E62  Class: “ToolbarWindow32″ Title: “” WM_USER+4b (0×44b) wParam: 0×14 lParam: 0×749e300

21:5:41:990 S PID: a7c TID: 554 HWND: 0×00010E4A  Class: “CtrlNotifySink” Title: “” WM_NOTIFY (0×4e) wParam: 0×0 lParam: 0×749efa8

21:5:41:990 S PID: a7c TID: 554 HWND: 0×00010E62  Class: “ToolbarWindow32″ Title: “” WM_USER+3f (0×43f) wParam: 0×14 lParam: 0×749e1e0

21:5:41:990 S PID: a7c TID: 554 HWND: 0×00010E62  Class: “ToolbarWindow32″ Title: “” WM_USER+4b (0×44b) wParam: 0×14 lParam: 0×749e300

21:5:41:990 S PID: a7c TID: 554 HWND: 0×00010E62  Class: “ToolbarWindow32″ Title: “” WM_USER+19 (0×419) wParam: 0×14 lParam: 0×0

21:5:41:990 S PID: a7c TID: 554 HWND: 0×00010E62  Class: “ToolbarWindow32″ Title: “” WM_USER+61 (0×461) wParam: 0×6 lParam: 0×0

21:5:41:990 S PID: a7c TID: 554 HWND: 0×00010E62  Class: “ToolbarWindow32″ Title: “” WM_USER+56 (0×456) wParam: 0×0 lParam: 0×0

21:5:41:990 S PID: a7c TID: 554 HWND: 0×00010E4A  Class: “CtrlNotifySink” Title: “” WM_NOTIFY (0×4e) wParam: 0×0 lParam: 0×749f290

21:5:41:990 S PID: a7c TID: 554 HWND: 0×000E04A8  Class: “CtrlNotifySink” Title: “” WM_NCPAINT (0×85) wParam: 0xffffffffcc043bdb lParam: 0×0

21:5:41:990 P PID: a7c TID: 554 HWND: 0×000E04A8  Class: “CtrlNotifySink” Title: “” WM_PAINT (0xf) wParam: 0×0 lParam: 0×0

21:5:42:007 S PID: 1a8 TID: 660 HWND: 0×0001003C  Class: “CiceroUIWndFrame” Title: “TF_FloatingLangBar_WndTitle” WM_WINDOWPOSCHANGING (0×46) wParam: 0×0 lParam: 0×29af030

21:5:42:007 P PID: a7c TID: 9b4 HWND: 0×00010084  Class: “CiceroUIWndFrame” Title: “TF_FloatingLangBar_WndTitle” WM_TIMER (0×113) wParam: 0×6 lParam: 0×0

21:5:42:007 P PID: 1a8 TID: 660 HWND: 0×0001003C  Class: “CiceroUIWndFrame” Title: “TF_FloatingLangBar_WndTitle” WM_TIMER (0×113) wParam: 0×8 lParam: 0×0

21:5:42:007 P PID: a7c TID: 9b4 HWND: 0×00010084  Class: “CiceroUIWndFrame” Title: “TF_FloatingLangBar_WndTitle” WM_TIMER (0×113) wParam: 0×9 lParam: 0×0

21:5:42:022 P PID: a7c TID: a28 HWND: 0×0001061A  Class: “WPDShServiceObject” Title: “WPDShServiceObject_WND” WM_TIMER (0×113) wParam: 0xd lParam: 0×0

21:5:42:022 P PID: a7c TID: 9b4 HWND: 0×00010084  Class: “CiceroUIWndFrame” Title: “TF_FloatingLangBar_WndTitle” WM_TIMER (0×113) wParam: 0×8 lParam: 0×0

21:5:42:022 P PID: a7c TID: 9b4 HWND: 0×00010084  Class: “CiceroUIWndFrame” Title: “TF_FloatingLangBar_WndTitle” WM_PAINT (0xf) wParam: 0×0 lParam: 0×0

21:5:42:036 P PID: 1a8 TID: 660 HWND: 0×0001003C  Class: “CiceroUIWndFrame” Title: “TF_FloatingLangBar_WndTitle” WM_TIMER (0×113) wParam: 0×5 lParam: 0×0

21:5:42:054 S PID: a7c TID: 9b4 HWND: 0×0001006C  Class: “ReBarWindow32″ Title: “” WM_USER+10 (0×410) wParam: 0×2 lParam: 0×0

21:5:42:054 S PID: a7c TID: 9b4 HWND: 0×0001006C  Class: “ReBarWindow32″ Title: “” WM_USER+18 (0×418) wParam: 0×2 lParam: 0×1041a

21:5:42:054 S PID: a7c TID: 9b4 HWND: 0×0001006C  Class: “ReBarWindow32″ Title: “” WM_USER+1a (0×41a) wParam: 0×0 lParam: 0×1041c

21:5:42:054 S PID: a7c TID: 9b4 HWND: 0×0001006C  Class: “ReBarWindow32″ Title: “” WM_USER+19 (0×419) wParam: 0×0 lParam: 0×0

21:5:42:054 S PID: a7c TID: 9b4 HWND: 0×00010084  Class: “CiceroUIWndFrame” Title: “TF_FloatingLangBar_WndTitle” WM_WINDOWPOSCHANGING (0×46) wParam: 0×0 lParam: 0×2bef960

21:5:42:054 P PID: a7c TID: 9b4 HWND: 0×00010084  Class: “CiceroUIWndFrame” Title: “TF_FloatingLangBar_WndTitle” WM_TIMER (0×113) wParam: 0×10 lParam: 0×0

21:5:42:054 P PID: a7c TID: 9b4 HWND: 0×00010084  Class: “CiceroUIWndFrame” Title: “TF_FloatingLangBar_WndTitle” WM_TIMER (0×113) wParam: 0×5 lParam: 0×0

21:5:42:074 S PID: a7c TID: 554 HWND: 0×00010E32  Class: “DirectUIHWND” Title: “” WM_NCHITTEST (0×84) wParam: 0×0 lParam: 0×640406

21:5:42:074 S PID: a7c TID: 554 HWND: 0×00010E30  Class: “DUIViewWndClassName” Title: “” WM_NCHITTEST (0×84) wParam: 0×0 lParam: 0×640406

21:5:42:074 S PID: a7c TID: 554 HWND: 0×00010E32  Class: “DirectUIHWND” Title: “” WM_SETCURSOR (0×20) wParam: 0×10e32 lParam: 0×2000001

21:5:42:074 S PID: a7c TID: 554 HWND: 0×00010E30  Class: “DUIViewWndClassName” Title: “” WM_SETCURSOR (0×20) wParam: 0×10e32 lParam: 0×2000001

21:5:42:074 S PID: a7c TID: 554 HWND: 0×00010E20  Class: “ShellTabWindowClass” Title: “Release” WM_SETCURSOR

[…]
Ususally when we see an error indication we select its current thread of activity and investigate what happened in this process and thread before. Here is a synthesised example from real CDF traces:
No     PID  TID  Time         Message

[...]

165797 4280 5696 07:07:23.709 FreeToken Handle 00000000

165798 4660 7948 07:07:23.709 EnumProcesses failed. Error=-2144534527

165799 7984 6216 07:07:23.749 GetData threw exception

165800 7984 6216 07:07:23.750 === Begin Exception Dump ===

[…]
We see the error and sort by TID 7948 to see what happened before and get additional information like server name:
No     PID  TID  Time         Message

[...]

165223 4660 7948 07:07:23.704 GetServerName: Exit. ServerName = SERVER02

165224 4660 7948 07:07:23.704 GetServerProcesses: ServerName is SERVER02

165798 4660 7948 07:07:23.709 EnumProcesses failed. Error=-2144534527

[…]
- Dmitry Vostokov @ TraceAnalysis.org -
Posted in CDF Analysis Tips and Tricks, Debugging, Software Trace Analysis, Trace Analysis Patterns | 3 Comments »
Wednesday, July 29th, 2009
Often analysis of software traces starts with searching for short textual patterns, like a failure or an exception code or simply the word “exception”. And indeed, some software components are able to record their own exceptions or exceptions that were propagated to them including full stack traces. This is all common in .NET and Java environments. Here is a synthetic and beautified example based on real software traces:
N      PID  TID  Message

[...]

265799 8984 4216 ComponentA.Store.GetData threw exception: ‘System.Reflection.TargetInvocationException: DCOM connection to server failed with error: ‘Exception from HRESULT: 0×842D0001′ —> System.Runtime.InteropServices.COMException (0×842D0001): Exception from HRESULT: 0×842D0001

   at ComponentA.GetData(Byte[] pKey)

   at System.RuntimeMethodHandle._InvokeMethodFast(Object target, Object[] arguments, SignatureStruct& sig, MethodAttributes methodAttributes, RuntimeTypeHandle typeOwner)

   at System.RuntimeMethodHandle.InvokeMethodFast(Object target, Object[] arguments, Signature sig, MethodAttributes methodAttributes, RuntimeTypeHandle typeOwner)

   at System.Reflection.RuntimeMethodInfo.Invoke(Object obj, BindingFlags invokeAttr, Binder binder, Object[] parameters, CultureInfo culture, Boolean skipVisibilityChecks)

   at System.Reflection.RuntimeMethodInfo.Invoke(Object obj, BindingFlags invokeAttr, Binder binder, Object[] parameters, CultureInfo culture)

   at ComponentB.Connections.ComInterfaceProxy.Invoke(IMessage message)’

265800 8984 4216 === Begin Exception Dump ===

265801 8984 4216 ComponentB.Exceptions.ConnectionException: DCOM connection to server failed with error: ‘Exception from HRESULT: 0×842D0001′ —> System.Runtime.InteropServices.COMException (0×842D0001): Exception from HRESULT: 0×842D0001

265802 8984 4216 at ComponentA.Store.GetData(Byte[] pKey)

[…]

265808 8984 4216 Exception rethrown at [0]:

265809 8984 4216 at System.Runtime.Remoting.Proxies.RealProxy.HandleReturnMessage(IMessage reqMsg, IMessage retMsg)

265810 8984 4216 at System.Runtime.Remoting.Proxies.RealProxy.PrivateInvoke(MessageData& msgData, Int32 type)

265811 8984 4216 at ComponentA.Store.GetData(Byte[] pKey)

265812 8984 4216 at ComponentA.App.EnumBusinessObjects()

[…]

265816 8984 4216 ===> InnerException:

265817 8984 4216 ** COM Exception Error Code: 0×842d0001

265818 8984 4216 System.Runtime.InteropServices.COMException (0×842D0001): Exception from HRESULT: 0×842D0001

265819 8984 4216 at ComponentA.Store.GetData(Byte[] pKey)

265820 8984 4216 === End Exception Dump ===

[…]
In the embedded stack trace we see that App object was trying to enumerate business objects and asked Store object to get some data and the latter object was probably trying to communicate to the real data store via DCOM. The communication attempt failed with HRESULT.
- Dmitry Vostokov @ TraceAnalysis.org -
Posted in .NET Debugging, CDF Analysis Tips and Tricks, Citrix, Debugging, Software Trace Analysis, Trace Analysis Patterns | 2 Comments »
Wednesday, July 22nd, 2009
Sometimes we have several disjoint Periodic Errors and possible false positives. We wonder where should we start or assign relative priorities for troubleshooting suggestions. Here Statement Density and Current pattern can help. The statement or message density is simply the ratio of the number of occurrences of the specific trace statement (message) in the trace to the total number of all different recorded messages.
Consider this software trace with two frequent messages:
N     PID  TID

21    5928 8092 LookupAccountSid failed. Result = -2146238462

[...]

1013  5928 1340 SQL execution needs a retry. Result = 0
We have approx. 7,500 statements for the former and approx. 1,250 statements for the latter. The total number of trace statements is 185,700, so we have the corresponding approx. trace densities: 0.04 and 0.0067. Their relative ratio 7,500 / 1,250 is 6.
Another trace for the same problem was collected at a different time with the same errors. It has 71,100 statements and only 160 and 27 statements counted for messages above. We have a ratio 160 / 27 approx. the same, 5.93, that suggests that messages are correlated. However statement density is much lower, 0,002 and 0.00038 approx. and this suggests the closer look at the second trace to see whether these problems started at some time later after the start of the recording.
We can also check the statement current as the number of messages per unit of time. The first trace was recorded over the period of 195 seconds and the second over the period of 650 seconds. Therefore, we have 952 msg/s and 109 msg/s respectively. This suggests that the problem might have started at some time during the second trace or there were more modules selected for the first trace. To make sure, we adjust the total number of messages for these two traces. We find the first occurrence of the error and subtract its message number from the total number of messages. For our first trace we see that messages start from the very beginning, and in our second trace they also almost start from the beginning. So such adjustment shouldn’t give much better results here. Also these statements continue to be recorded till the very end of these traces.
To avoid being lost in this discusssion I repeat main results:
           Density             Relative Density   Current,

                                                  all msg/s

Trace 1    0.04 / 0.0067       6                  952

Trace 2    0.002 / 0.00038     5.93               109
The possibility that much more was traced that resulted in lower density for the second trace should be discarded because we have much lower current. Perhaps environment was not quite the same for the second tracing. However the same relative density for two different errors suggest that they are correlated and the higher density of the first error suggests that we should start our investigation from it.
The reason why I came up with this statistical trace analysis pattern is because 2 different engineers analyzed the same trace and both were suggesting different troubleshooting paths based on selected error messages from software traces. So I did a statistical analysis to prioritize their suggestions.
- Dmitry Vostokov @ TraceAnalysis.org -
Posted in Debugging, Software Trace Analysis, Trace Analysis Patterns, Troubleshooting Methodology | 6 Comments »