 Multiple Exceptions (user mode) - Modeling Example
 Multiple Exceptions (kernel mode)
 Multiple Exceptions (managed space)
- Multiple Exceptions (stowed)
 Dynamic Memory Corruption (process heap)
 Dynamic Memory Corruption (kernel pool)
- Dynamic Memory Corruption (managed heap)
 False Positive Dump
 Lateral Damage (general)
- Lateral Damage (CPU mode)
 Optimized Code (function parameter reuse)
 Invalid Pointer (general)
- Invalid Pointer (objects)
 NULL Pointer (code)
 NULL Pointer (data)
 Inconsistent Dump
 Hidden Exception (user space)
- Hidden Exception (kernel space)
- Hidden Exception (managed space)
 Deadlock (critical sections)
 Deadlock (executive resources)
 Deadlock (mixed objects, user space)
 Deadlock (LPC)
 Deadlock (mixed objects, kernel space)
 Deadlock (self)
- Deadlock (managed space)
- Deadlock (.NET Finalizer)
 Changed Environment
 Incorrect Stack Trace
 OMAP Code Optimization
 No Component Symbols
 Insufficient Memory (committed memory)
 Insufficient Memory (handle leak)
 Insufficient Memory (kernel pool)
 Insufficient Memory (PTE)
 Insufficient Memory (module fragmentation)
 Insufficient Memory (physical memory)
 Insufficient Memory (control blocks)
- Insufficient Memory (reserved virtual memory)
- Insufficient Memory (session pool)
- Insufficient Memory (stack trace database)
- Insufficient Memory (region)
- Insufficient Memory (stack)
 Spiking Thread
 Module Variety
 Stack Overflow (kernel mode)
 Stack Overflow (user mode)
 Stack Overflow (software implementation)
- Stack Overflow (insufficient memory)
- Stack Overflow (managed space)
 Managed Code Exception
- Managed Code Exception (Scala)
- Managed Code Exception (Python)
 Truncated Dump
 Waiting Thread Time (kernel dumps)
 Waiting Thread Time (user dumps)
 Memory Leak (process heap) - Modeling Example
 Memory Leak (.NET heap)
- Memory Leak (page tables)
- Memory Leak (I/O completion packets)
- Memory Leak (regions)
 Missing Thread (user space)
- Missing Thread (kernel space)
 Unknown Component
 Double Free (process heap)
 Double Free (kernel pool)
 Coincidental Symbolic Information
 Stack Trace
- Stack Trace (I/O request)
- Stack Trace (file system filters)
- Stack Trace (database)
- Stack Trace (I/O devices)
 Virtualized Process (WOW64)
- Virtualized Process (ARM64EC and CHPE)
 Stack Trace Collection (unmanaged space)
- Stack Trace Collection (managed space)
- Stack Trace Collection (predicate)
- Stack Trace Collection (I/O requests)
- Stack Trace Collection (CPUs)
 Coupled Processes (strong)
 Coupled Processes (weak)
 Coupled Processes (semantics)
 High Contention (executive resources)
 High Contention (critical sections)
 High Contention (processors)
- High Contention (.NET CLR monitors)
- High Contention (.NET heap)
- High Contention (sockets)
 Accidental Lock
 Passive Thread (user space)
 Passive System Thread (kernel space)
 Main Thread
 Busy System
 Historical Information
 Object Distribution Anomaly (IRP)
- Object Distribution Anomaly (.NET heap)
 Local Buffer Overflow (user space)
- Local Buffer Overflow (kernel space)
 Early Crash Dump
 Hooked Functions (user space)
 Hooked Functions (kernel space)
- Hooked Modules
 Custom Exception Handler (user space)
 Custom Exception Handler (kernel space)
 Special Stack Trace
 Manual Dump (kernel)
 Manual Dump (process)
 Wait Chain (general)
 Wait Chain (critical sections)
 Wait Chain (executive resources)
 Wait Chain (thread objects)
 Wait Chain (LPC/ALPC)
 Wait Chain (process objects)
 Wait Chain (RPC)
 Wait Chain (window messaging)
 Wait Chain (named pipes)
- Wait Chain (mutex objects)
- Wait Chain (pushlocks)
- Wait Chain (CLR monitors)
- Wait Chain (RTL_RESOURCE)
- Wait Chain (modules)
- Wait Chain (nonstandard synchronization)
- Wait Chain (C++11, condition variable)
- Wait Chain (SRW lock)
 Corrupt Dump
 Dispatch Level Spin
 No Process Dumps
 No System Dumps
 Suspended Thread
 Special Process
 Frame Pointer Omission
 False Function Parameters
 Message Box
 Self-Dump
 Blocked Thread (software)
 Blocked Thread (hardware)
- Blocked Thread (timeout)
 Zombie Processes
 Wild Pointer
 Wild Code
 Hardware Error
 Handle Limit (GDI, kernel space)
- Handle Limit (GDI, user space)
 Missing Component (general)
 Missing Component (static linking, user mode)
 Execution Residue (unmanaged space, user)
- Execution Residue (unmanaged space, kernel)
- Execution Residue (managed space)
 Optimized VM Layout
- Invalid Handle (general)
- Invalid Handle (managed space)
- Overaged System
- Thread Starvation (realtime priority)
- Thread Starvation (normal priority)
- Duplicated Module
- Not My Version (software)
- Not My Version (hardware)
- Data Contents Locality
- Nested Exceptions (unmanaged code)
- Nested Exceptions (managed code)
- Affine Thread
- Self-Diagnosis (user mode)
- Self-Diagnosis (kernel mode)
- Self-Diagnosis (registry)
- Inline Function Optimization (unmanaged code)
- Inline Function Optimization (managed code)
- Critical Section Corruption
- Lost Opportunity
- Young System
- Last Error Collection
- Hidden Module
- Data Alignment (page boundary)
- C++ Exception
- Divide by Zero (user mode)
- Divide by Zero (kernel mode)
- Swarm of Shared Locks
- Process Factory
- Paged Out Data
- Semantic Split
- Pass Through Function
- JIT Code (.NET)
- JIT Code (Java)
- Ubiquitous Component (user space)
- Ubiquitous Component (kernel space)
- Nested Offender
- Virtualized System
- Effect Component
- Well-Tested Function
- Mixed Exception
- Random Object
- Missing Process
- Platform-Specific Debugger
- Value Deviation (stack trace)
- Value Deviation (structure field)
- Runtime Thread (CLR)
- Runtime Thread (Python, Linux)
- Coincidental Frames
- Fault Context
- Hardware Activity
- Incorrect Symbolic Information
- Message Hooks - Modeling Example
- Coupled Machines
- Abridged Dump
- Exception Stack Trace
- Distributed Spike
- Instrumentation Information
- Template Module
- Invalid Exception Information
- Shared Buffer Overwrite
- Pervasive System
- Problem Exception Handler
- Same Vendor
- Crash Signature
- Blocked Queue (LPC/ALPC)
- Fat Process Dump
- Invalid Parameter (process heap)
- Invalid Parameter (runtime function)
- String Parameter
- Well-Tested Module
- Embedded Comment
- Hooking Level
- Blocking Module
- Dual Stack Trace
- Environment Hint
- Top Module
- Livelock
- Technology-Specific Subtrace (COM interface invocation)
- Technology-Specific Subtrace (dynamic memory)
- Technology-Specific Subtrace (JIT .NET code)
- Technology-Specific Subtrace (COM client call)
- Dialog Box
- Instrumentation Side Effect
- Semantic Structure (PID.TID)
- Directing Module
- Least Common Frame
- Truncated Stack Trace
- Data Correlation (function parameters)
- Data Correlation (CPU times)
- Module Hint
- Version-Specific Extension
- Cloud Environment
- No Data Types
- Managed Stack Trace
- Managed Stack Trace (Scala)
- Managed Stack Trace (Python)
- Coupled Modules
- Thread Age
- Unsynchronized Dumps
- Pleiades
- Quiet Dump
- Blocking File
- Problem Vocabulary
- Activation Context
- Stack Trace Set
- Double IRP Completion
- Caller-n-Callee
- Annotated Disassembly (JIT .NET code)
- Annotated Disassembly (unmanaged code)
- Handled Exception (user space)
- Handled Exception (.NET CLR)
- Handled Exception (kernel space)
- Duplicate Extension
- Special Thread (.NET CLR)
- Hidden Parameter
- FPU Exception
- Module Variable
- System Object
- Value References
- Debugger Bug
- Empty Stack Trace
- Problem Module
- Disconnected Network Adapter
- Network Packet Buildup
- Unrecognizable Symbolic Information
- Translated Exception
- Regular Data
- Late Crash Dump
- Blocked DPC
- Coincidental Error Code
- Punctuated Memory Leak
- No Current Thread
- Value Adding Process
- Activity Resonance
- Stored Exception
- Spike Interval
- Stack Trace Change
- Unloaded Module
- Deviant Module
- Paratext
- Incomplete Session
- Error Reporting Fault
- First Fault Stack Trace
- Frozen Process
- Disk Packet Buildup
- Hidden Process
- Active Thread (Mac OS X)
- Active Thread (Windows)
- Critical Stack Trace
- Handle Leak
- Module Collection
- Module Collection (predicate)
- Deviant Token
- Step Dumps
- Broken Link
- Debugger Omission
- Glued Stack Trace
- Reduced Symbolic Information
- Injected Symbols
- Distributed Wait Chain
- One-Thread Process
- Module Product Process
- Crash Signature Invariant
- Small Value
- Shared Structure
- Thread Cluster
- False Effective Address
- Screwbolt Wait Chain
- Design Value
- Hidden IRP
- Tampered Dump
- Memory Fluctuation (process heap)
- Last Object
- Rough Stack Trace (unmanaged space)
- Rough Stack Trace (managed space)
- Past Stack Trace
- Ghost Thread
- Dry Weight
- Exception Module
- Reference Leak
- Origin Module
- Hidden Call
- Corrupt Structure
- Software Exception
- Crashed Process
- Variable Subtrace
- User Space Evidence
- Internal Stack Trace
- Distributed Exception (managed code)
- Thread Poset
- Stack Trace Surface
- Hidden Stack Trace
- Evental Dumps
- Clone Dump
- Parameter Flow
- Critical Region
- Diachronic Module
- Constant Subtrace
- Not My Thread
- Window Hint
- Place Trace
- Stack Trace Signature
- Relative Memory Leak
- Quotient Stack Trace
- Module Stack Trace
- Foreign Module Frame
- Unified Stack Trace
- Mirror Dump Set
- Memory Fibration
- Aggregated Frames
- Frame Regularity
- Stack Trace Motif
- System Call
- Stack Trace Race
- Hyperdump
- Disassembly Ambiguity
- Exception Reporting Thread
- Active Space
- Subsystem Modules
- Region Profile
- Region Clusters
- Source Stack Trace
- Hidden Stack
- Interrupt Stack
- False Memory
- Frame Trace
- Pointer Cone
- Context Pointer
- Pointer Class
- False Frame
- Procedure Call Chain
- C++ Object
- COM Exception
- Structure Sheaf
- Saved Exception Context (.NET)
- Shared Thread
- Spiking Interrupts
- Structure Field Collection
- Black Box
- Rough Stack Trace Collection (unmanaged space)
- COM Object
- Shared Page
- Exception Collection
- Dereference Nearpoint
- Address Representations
- Near Exception
- Shadow Stack Trace
- Past Process
- Foreign Stack
- Annotated Stack Trace
- Disassembly Summary
- Region Summary
- Analysis Summary
- Region Spectrum
- Normalized Region
- Function Pointer
- Interrupt Stack Collection
- DPC Stack Collection
- Dump Context
- False Local Address
- Encoded Pointer
- Latent Structure
- ISA-Specific Code
Pattern-Oriented Software Diagnostics and Anomaly Detection Reference
Click on an individual book to see its description and table of contents:


Pattern-oriented software diagnostics, uniquely systematic and multidisciplinary, is the new approach in a long time. Described as the unified field theory of software diagnostics, It encompasses and expands the whole field, offers a wider range of software diagnostic possibilities, gives a novel lens to software diagnosis including specific guidelines for the dauntingly complex world of software problems. This 2,500-page reference set should be on the desk of every software engineer and software support problem solver. It includes:
- Encyclopedia of Crash Dump Analysis Patterns, Third Edition
- Trace, Log, Text, Narrative: An Analysis Pattern Reference for Data Mining, Diagnostics, Anomaly Detection, Fourth Edition
- Theoretical Software Diagnostics: Collected Articles, Third Edition
- Software Diagnostics: The Collected Seminars
- Fundamentals of Physical Memory Analysis: Anniversary Edition
- Principles of Memory Dump Analysis: The Collected Seminars
You can buy this reference set from Software Diagnostics Services with a discount.
General Architecture of Analysis Pattern Networks
The system of diagnostic analysis patterns from Software Diagnostic Institute was created for humans and may appear too complicated for machines, although AI, machine learning, and data processing techniques may be used in individual computer-assisted pattern implementations. Fortunately, in theory, deep learning allows functional processing units of arbitrary complexity, and we can reuse its metaphors to propose a similar architecture but where all neurons in a layer perform different complex functions and use the same complex input. The output includes unmodified input plus the result of each neuron computation (enrichment). Some neurons may not produce any output given the set of data.
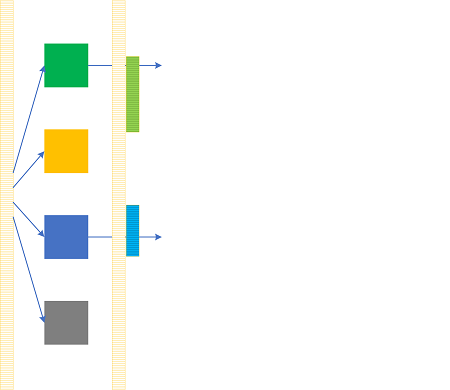
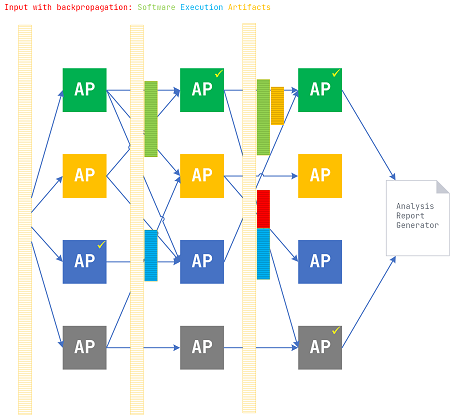
Concrete analysis patterns as techniques (algorithms) to uncover diagnostic indicators can be represented as generalized complex data processing “neurons” interconnected like artificial neural networks. Input data is a software execution artifact (or a set of them) such as a software trace and log, network trace, or memory snapshot. Each analysis pattern (AP) accesses the whole artifact data (no input neurons encoding data vector elements). Each AP processing enriches input data by adding another derivative artifact, artifact transformation, and the list of found diagnostic indicators (signs). Each AP from the next iteration processes the updated input data. Stateful AP may also store some other information for the next iterations (with or without data enrichment), and stateless AP may serve the role of pure transformation functions (operators). In summary, AP layers are identical but are fed with enriched artifacts for each iteration (backpropagation metaphor).
Links between AP from consecutive layers correspond to analysis and problem pattern sequences (schemas) known in advance (they may be the same between each consecutive pair of layers) and may also be built dynamically during iterations if correlations are discovered. Such links may also correspond to interfaces between AP components that query information from the previous iteration or ask for analysis services. The analysis report generator (“output neuron”) may use the link “weight” matrix of discovered AP dependencies for further insight. Flagged AP “neurons” in the diagram below represent found diagnostic indicators and concrete problem patterns to be used either in subsequent iterations or during analysis report generation. We call this method and its corresponding architecture Analysis Pattern Network (APN).
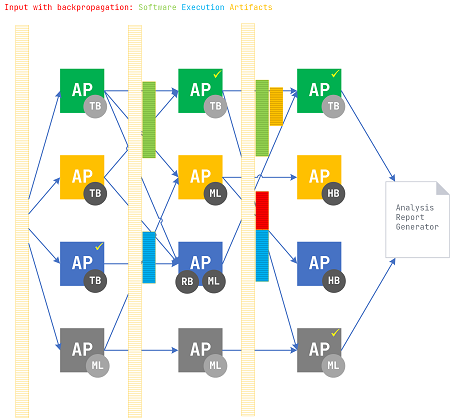
AP may be implemented using machine learning (ML), rule-based (RB), human-based (HB), and transformation-based (TB) techniques.
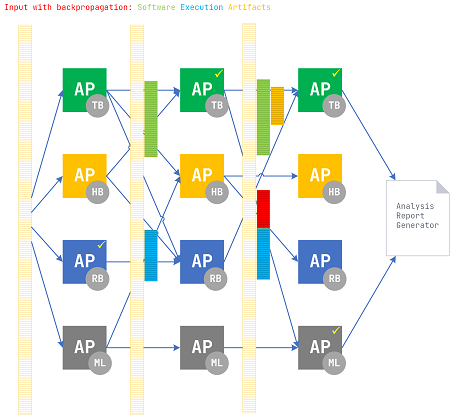
Different iterations may strategically use different implementation techniques based on pattern interconnections and enriched artifacts; for example, an AP during the first iteration used artifact transformation, during the second iteration used rule-based machine learning algorithm, and the third iteration required human introspection.
APN is an architectural pattern itself and is now added to our catalog of software diagnostics architecture patterns.
The Fractal Nature of Software Traces and Logs
Self-similarity of Trace Shapes across sequences of trace runs, Activity Regions, trace messages, and parts of Multidimensional Messages with the later adding fractional dimensions suggests analogies with fractals.
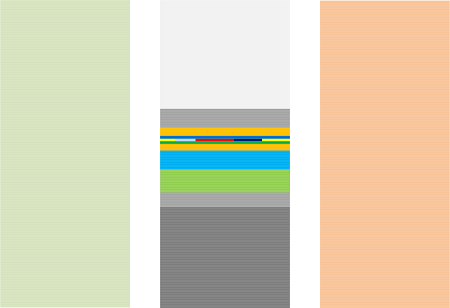
Streaming Architecture of Pattern-Oriented Software Diagnostics Publications
1. Producers: Software Diagnostics Institute, Library, and various artifacts from humans and software.
2. The one-thread writer to the distributed append-only log of analysis patterns and other topics: Memory Dump Analysis Anthology Volumes.
3. Consumers: Encyclopedia of Crash Dump Analysis Patterns, Trace and Log Analysis, Theoretical Software Diagnostics.
Memory Dump Analysis Anthology, Volume 13
Available in PDF format from Software Diagnostics Services
This reference volume consists of revised, edited, cross-referenced, and thematically organized selected articles from Software Diagnostics Institute (DumpAnalysis.org + TraceAnalysis.org) and Software Diagnostics Library (former Crash Dump Analysis blog, DumpAnalysis.org/blog) about software diagnostics, root cause analysis, debugging, crash and hang dump analysis, software trace and log analysis written in December 2019 - July 2020 for software engineers developing and maintaining products on Windows and Linux platforms, quality assurance engineers testing software, technical support, escalation and site reliability engineers dealing with complex software issues, security and vulnerability researchers, reverse engineers, malware and memory forensics analysts. This volume is fully cross-referenced with volumes 1 – 12 and features:
- 9 new crash dump analysis patterns with selected downloadable example memory dumps
- 15 new software trace and log analysis patterns
- Introduction to diagnostic analysis gestures
- Introduction to the category-theoretic view of debugging
- Lists of recommended category theory, number theory, and cybersecurity books
Product information:
- Title: Memory Dump Analysis Anthology, Volume 13
- Authors: Dmitry Vostokov, Software Diagnostics Institute
- Language: English
- Product Dimensions: 22.86 x 15.24
- Paperback: 197 pages
- Publisher: OpenTask (August 2020)
- ISBN-13: 978-1-912636-13-6
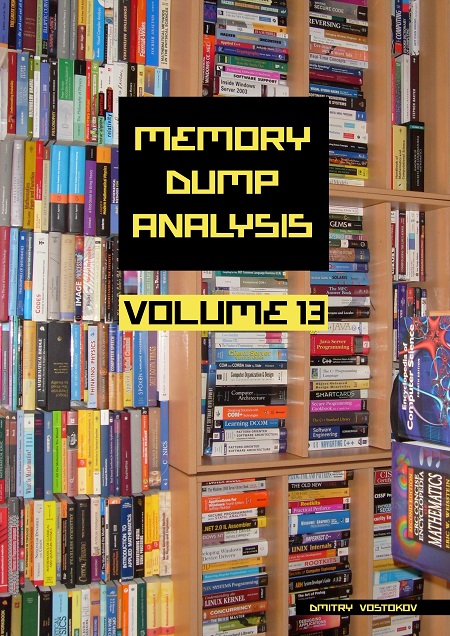
Programming Paradigms and Software Execution Artifacts
Sat, 08/08/2020 - 16:23 — Dmitry VostokovImperative vs. functional programming:
Memory Dump Analysis Anthology, Volume 3, Revised Edition
The new Revised Edition is available!
Available in PDF and EPUB formats from Software Diagnostics Services
This reference volume consists of revised, edited, cross-referenced, and thematically organized articles from Software Diagnostics Institute and Software Diagnostics Library (former Crash Dump Analysis blog) written in October 2008 - June 2009. In addition to various corrections, this major revision updates relevant links and removes obsolete references. Some articles are preserved for historical reasons. Most of the content, especially memory analysis and trace and log analysis pattern languages, is still relevant today and for the foreseeable future. The output of WinDbg commands is also remastered to include color highlighting. Crash dump analysis pattern names are also corrected to reflect the continued expansion of the catalog.
Compared to the second revised volume, the third revised volume features:
- 15 new crash dump analysis patterns
- 29 new pattern interaction case studies
- Trace analysis patterns
- Fully cross-referenced with Volume 1 and Volume 2
- New appendixes
The primary audience for Memory Dump Analysis Anthology reference volumes is: software engineers developing and maintaining products on Windows platforms, technical support, escalation, and site reliability engineers dealing with complex software issues, quality assurance engineers testing software on Windows platforms, security and vulnerability researchers, reverse engineers, malware and memory forensics analysts. Trace and log analysis articles may be of interest to users of other platforms.
- Title: Memory Dump Analysis Anthology, Volume 3, Revised Edition
- Authors: Dmitry Vostokov, Software Diagnostics Institute
- Publisher: OpenTask (July 2020)
- Language: English
- Product Dimensions: 22.86 x 15.24
- PDF + EPUB: 394 pages
- ISBN-13: 978-1912636235


Introducing Diags: Diagnostic Analysis Gestures and Logues

First, we introduce some definitions:
A diagnostic analysis action is a user interface action, a command, a technique, a diagnostic algorithm, a diagnostic analysis pattern.
A space of tools is a collection of physical and virtual (mental, imaginary) tools at some physical or virtual (mathematical) distance from each other.
A configuration of diagnostic analysis actions is a directed graph (digraph) in a topological space of tools or a diagram in a category theory sense (Visual Category Theory Brick by Brick, Part 3).
A diagnostic analysis gesture (diag) is a configuration of diagnostic actions across the space of tools and time, resulting in a workflow of diagnostic analysis actions.
A diagnostic analysis hypergesture is a gesture of diagnostic analysis gestures, a transformation of one gesture into another, between sets of tools, similar to porting diagnostic analysis patterns from one platform to another, for example, from Windows to Linux, or from one domain to another, for example, from logs to texts. We can view diagnostic hypergestures as diagnostic gesture patterns.
The “gesture” metaphor stems from the fact that despite recent automation efforts, the diagnostic analysis process is still manual when it requires substantial domain expertise. We still use various tools, graphical and command line (hand movements), and move in cyberspace. So, it is natural to combine all these physical and virtual movements into some abstract space path. There’s also a question of diagnostic performance (in terms of achieving diagnostic goals) and repertoire. Diagnostic gestures also include tool improvisation, data exploration, action experimentation, and aesthetics as well (coolness, for example). Some gestures can be used to discover analysis patterns.
Different mathematical approaches can be used to formalize Diags and HyperDiags; for example, category theory like it was done for musical gestures and homotopy theory for hypergestures (see The Topos of Music III: Gestures: Musical Multiverse Ontologies, Second Edition). For various perspectives on general gestures, please also refer to the opening chapters of The Topos of Music III.
Initially, years ago, we proposed thinking of diagnostic tools as arrows in a category of troubleshooting where objects are diagnostic artifact states (Category Theory and Troubleshooting, Theoretical Software Diagnostics, Second Edition, p. 105). Diags approach considers tools as objects.
Second, diagnostic gestures (and gestures in general) may be described using narrative forms, and we propose some new terminology here.
A logue is a narrative of diagnostic actions which that can be viewed as a langue from theoretical linguistics. It is similar to logs in their structure and allows the application of the whole apparatus of software narratology and trace analysis patterns similar to higher-order pattern narratives.
The idea stems from viewing catalogs of analysis patterns as cat-a-logs, a category of logs (and other categories of diagnostic artifacts and their analysis patterns in general), and the difference in catalog and catalogue spellings.
Finally, we also have dia-logs (dia-logues), dialogic actions between diagnostic analysis actors and logs (logues).
Fundamentals of Physical Memory Analysis
New Anniversary Edition is now available.
The following direct links can be used to order the book now:
Buy Kindle Print Replica from Amazon
Buy PDF and EPUB from Leanpub
This short book is a full transcript of the Software Diagnostics Services seminar about physical memory analysis on desktop and server Windows platforms (a revised version of the previous seminars on complete crash and hang memory dump analysis). Topics include memory acquisition and its tricks, user vs. kernel vs. physical memory space, fiber bundle space, challenges of physical memory analysis, common WinDbg commands, memory analysis patterns and their classification, common mistakes, a hands-on WinDbg analysis example with logs, and a guide to further study. For this new edition, slides and their transcript text have been significantly revised, links and references have been checked and updated, and the whole WinDbg analysis session has been redone for Windows 10.
- Title: Fundamentals of Physical Memory Analysis: Anniversary Edition
- Author: Dmitry Vostokov, Software Diagnostics Services
- Publisher: OpenTask (June 2020)
- Language: English
- Product Dimensions: 28.0 x 21.6
- Paperback: 58 pages
- ISBN-13: 978-1912636808
Memory Dump Analysis Anthology, Volume 2, Revised Edition
The new Revised Edition is available!
The following direct links can be used to order the English edition now:
Buy PDF and EPUB from Leanpub
Buy Kindle Print Replica from Amazon
Also available in PDF and EPUB formats from Software Diagnostics Services.
This reference volume consists of revised, edited, cross-referenced, and thematically organized articles from Software Diagnostics Institute and Software Diagnostics Library (former Crash Dump Analysis blog) written in January - September 2008. In addition to various corrections, this major revision updates relevant links and removes obsolete references. Some articles are preserved for historical reasons. Most of the content, especially memory analysis pattern language, is still relevant today and for the foreseeable future. The output of WinDbg commands is also remastered to include color highlighting. Crash dump analysis pattern names are also corrected to reflect the continued expansion of the catalog.
Compared to the first revised volume, the second revised volume features:
- 44 more crash dump analysis patterns
- Pattern interaction and case studies
- Fully cross-referenced with Volume 1
- New appendixes
The primary audience for Memory Dump Analysis Anthology reference volumes is: software engineers developing and maintaining products on Windows platforms, technical support, escalation, and site reliability engineers dealing with complex software issues, quality assurance engineers testing software on Windows platforms, security and vulnerability researchers, reverse engineers, malware and memory forensics analysts.
- Title: Memory Dump Analysis Anthology, Volume 2, Revised Edition
- Authors: Dmitry Vostokov, Software Diagnostics Institute
- Publisher: OpenTask (May 2020)
- Language: English
- Product Dimensions: 22.86 x 15.24
- PDF: 463 pages
- ISBN-13: 978-1912636228


Debugging and Category Theory
What is debugging? There are many definitions out there, including analogies with forensic science, victimology, and criminology. There are also definitions involving set theory. They focus on the content of debugging artifacts such as source code and its execution paths and values. We give a different definition based on debugging actions and using category theory. We also do not use mathematical notation in what follows.
What is the category theory? We do not give a precise mathematical definition based on axioms but provide a conceptual one as a worldview while omitting many details. A category is a collection of objects and associated arrows between them. Every pair of objects has a collection of arrows between them, which can be empty. So an arrow must have a source and a target object. Several sequential arrows can be composed into one arrow. We can even consider arrows as objects themselves, but this is another category with its new arrows between arrows as objects. If we consider categories as objects and arrows between these categories as objects, we have another category. So we can quickly build complex models out of that.
Can we build a conceptual model of debugging using objects and arrows? Yes, and it even has a particular name in category theory: a presheaf. So, debugging is a presheaf. To answer a question, what is a presheaf, we start constructing our debugging model focusing on objects and arrows. To avoid using mathematical language that may obscure debugging concepts, we use LEGO® bricks because we can feel the objects and arrows, and most importantly, arrows as objects (see visual category theory for more details). This hands-on activity also reminds us that debugging is a construction process.
Debugging activity involves time. We, therefore, construct a time arrow that represents software execution:

We pick two Time objects representing different execution times:

In our Time category, an arrow means the flow of time. It can also be some indexing scheme for time events or other objects (a different category) that represents some repeated activity. Please note that an arrow has specific object indicators assigned to it. Different object pairs have different arrows. It is not apparent when we use black and white mathematical notation and diagrams.

We can associate with Time objects some external objects, for example, memory snapshots, or some other software execution states, variables, execution artifacts, or even parts of the same artifact:

Therefore, we have a possible mapping from the Time category to a possible category of software execution artifacts that we name DA+TA (abbreviated [memory] dump artifacts + trace [log] artifacts). DA+TA objects are simply some sets useful for debugging. The mapping between different categories is usually called a functor in category theory. It maps objects from the source category to objects in the target category. It is itself an arrow in the category that includes source and target categories as objects:

However, we forgot to designate arrows in the target DA+TA category. Of course, a different choice of arrows makes different categories. We choose arrows that represent debugging activities such as going back in time when trying to find the root cause, such as walking a stack trace. It is a reverse activity:

A functor that maps arrows to reversed arrows is called a contravariant functor in category theory:

Such a contravariant functor from a category to the category of some sets is called a presheaf. Now we look at debugging using software traces and logs as another target category of sets. With our Time category objects, we associate different log messages:

When we use log and trace files for debugging we also go back in time trying to find the root cause message (or a set of messages) or some other clues:

Again, we have a presheaf, a contravariant functor that maps our Time category objects to sets of messages:

So, we see again, that debugging is a presheaf, a contravariant functor that maps software execution categories such as a category of time instants to sets of software execution artifacts.
Trace and log analysis pattern catalog includes another example of the source and target categories candidates for a debugging presheaf, Trace Presheaf analysis pattern that maps trace messages to memory snapshots (sets of memory cells or some other state information).
Presheaves can be mapped to each other, for example, from a presheaf of logs to a presheaf of associated source code fragments or stack traces, and this is called a natural transformation in category theory. It also fits with natural debugging when we go back in logs and, at the same time, browse source code or some other associated information sets.
This article is also available in PDF format.
Software Construction Brick by Brick
In the past, we used LEGO® bricks to represent some simple data structures and software logs, and recently, more complex data structures and algorithms, so all that transformed into a series of manageable short books (increments) to facilitate earlier adoption and feedback. Software diagnostics is an integral part of software construction and software post-construction problem-solving, and we aim to provide real hands-on training from general concepts and architecture to low-level details.
Increment 1 (ISBN-13: 978-1912636709) is currently available on Leanpub and Amazon Kindle Store. It covers memory, memory addresses, pointers, program loading, kernel and user spaces, virtual process space, memory isolation, virtual and physical memory, memory paging, memory dump types.

Machine Learning Brick by Brick
In the past, we used LEGO® bricks to represent some simple data structures and software logs, so all that transformed into a series of manageable short books (epochs) to facilitate earlier adoption and feedback. Machine learning is now an integral part of pattern-oriented software diagnostics, and we aim to provide real hands-on training from general concepts and architecture to low-level details and mathematics.
Epoch 1 (ISBN-13: 978-1912636501) is currently available on Leanpub and Amazon Kindle Store. It covers the simplest linear associative network, proposes a brick notation for algebraic expressions, shows required calculus derivations, and illustrates gradient descent.

Memory Dump Analysis Anthology, Volume 1, Revised Edition
The new Revised Edition is available!
The following direct links can be used to order the English edition now:
Buy PDF and EPUB from Leanpub
Buy Kindle Print Replica from Amazon
Also available in PDF and EPUB formats from Software Diagnostics Services.
This reference volume consists of revised, edited, cross-referenced, and thematically organized articles from Software Diagnostics Institute and Software Diagnostics Library (former Crash Dump Analysis blog) written in August 2006 - December 2007. This major revision updates tool information and links with ones relevant for Windows 10 and removes obsolete references. Some articles are preserved for historical reasons, and some are updated to reflect the debugger engine changes. The output of WinDbg commands is also remastered to include color highlighting. Most of the content, especially memory analysis pattern language, is still relevant today and for the foreseeable future. Crash dump analysis pattern names are also corrected to reflect the continued expansion of the catalog.
The primary audience for Memory Dump Analysis Anthology reference volumes is: software engineers developing and maintaining products on Windows platforms, technical support, escalation, and site reliability engineers dealing with complex software issues, quality assurance engineers testing software on Windows platforms, security and vulnerability researchers, reverse engineers, malware and memory forensics analysts.
- Title: Memory Dump Analysis Anthology, Volume 1, Revised Edition
- Authors: Dmitry Vostokov, Software Diagnostics Institute
- Publisher: OpenTask (April 2020)
- Language: English
- Product Dimensions: 22.86 x 15.24
- PDF: 713 pages
- ISBN-13: 978-1912636211


The original Korean edition is also available:

The following direct links can be used to order the Korean edition now:
Acorn (The Korean translation publisher) or Kyobo book or Yes24.com
Memory Dump Analysis Anthology, Volume 12
The following direct links can be used to order the book:
Buy Kindle print replica edition from Amazon
Also available in PDF format from Software Diagnostics Services
This reference volume consists of revised, edited, cross-referenced, and thematically organized selected articles from Software Diagnostics Institute (DumpAnalysis.org + TraceAnalysis.org) and Software Diagnostics Library (former Crash Dump Analysis blog, DumpAnalysis.org/blog) about software diagnostics, root cause analysis, debugging, crash and hang dump analysis, software trace and log analysis written in December 2018 - November 2019 for software engineers developing and maintaining products on Windows and Linux platforms, quality assurance engineers testing software, technical support, escalation and site reliability engineers dealing with complex software issues, security researchers, reverse engineers, malware and memory forensics analysts. This volume is fully cross-referenced with volumes 1 – 11 and features:
- 6 new crash dump analysis patterns with selected downloadable example memory dumps
- 2 pattern interaction case studies including Python crash dump analysis
- 16 new software trace and log analysis patterns
- Introduction to software pathology
- Introduction to graphical representation of software traces and logs
- Introduction to space-like narratology as application of trace and log analysis patterns to image analysis
- Introduction to analysis pattern duality
- Introduction to machine learning square and its relationship with the state of the art of pattern-oriented diagnostics
- Historical reminiscences on 10 years of trace and log analysis patterns and software narratology
- Introduction to baseplate representation of chemical structures
- WinDbg notes
- Using C++ as a scripting tool
- List of recommended Linux kernel space books
- Volume index of memory dump analysis patterns
- Volume index of trace and log analysis patterns
Product information:
- Title: Memory Dump Analysis Anthology, Volume 12
- Authors: Dmitry Vostokov, Software Diagnostics Institute
- Language: English
- Product Dimensions: 22.86 x 15.24
- Paperback: 179 pages
- Publisher: OpenTask (December 2019)
- ISBN-13: 978-1-912636-12-9

Writing Bad Code: Software Defect Construction, Simulation and Modeling of Software Bugs
This book is planned for early 2020 (ISBN: 978-1906717759).
Python Crash Dump Analysis Case Study
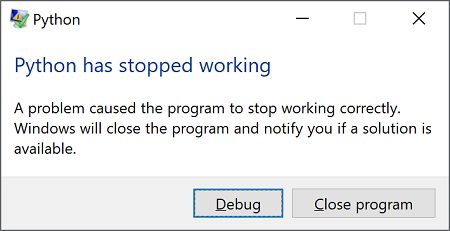
When working on Region Profile memory analysis pattern, we decided to combine two separate Pandas profiling scripts into one:
import pandas as pd

import pandas_profiling
df = pd.read_csv("stack.csv")
html_file = open("stack.html", "w")
html_file.write (pandas_profiling.ProfileReport(df).to_html())
html_file.close()
df = pd.read_csv("stack4columns.csv")
html_file = open("stack4columns.html", "w")
html_file.write (pandas_profiling.ProfileReport(df).to_html())
html_file.close()
Unfortunately, python.exe crashed. Since we always configure LocalDumps to catch interesting crashes we got python.exe.2140.dmp. We promptly loaded it into Microsoft WinDbg Debugger (or WinDbg Preview, see quick download links) and saw Self-Diagnosis from Top Module in Exception Stack Trace (if we ignore exception processing function calls):
0:020> k

 # Child-SP          RetAddr           Call Site

00 00000064`007bbb08 00007ffd`3cac7ff7 ntdll!NtWaitForMultipleObjects+0x14

01 00000064`007bbb10 00007ffd`3cac7ede KERNELBASE!WaitForMultipleObjectsEx+0x107

02 00000064`007bbe10 00007ffd`3f6871fb KERNELBASE!WaitForMultipleObjects+0xe

03 00000064`007bbe50 00007ffd`3f686ca8 kernel32!WerpReportFaultInternal+0x51b

04 00000064`007bbf70 00007ffd`3cb6f848 kernel32!WerpReportFault+0xac

05 00000064`007bbfb0 00007ffd`3f7c4af2 KERNELBASE!UnhandledExceptionFilter+0x3b8

06 00000064`007bc0d0 00007ffd`3f7ac6e6 ntdll!RtlUserThreadStart$filt$0+0xa2

07 00000064`007bc110 00007ffd`3f7c120f ntdll!_C_specific_handler+0x96

08 00000064`007bc180 00007ffd`3f78a299 ntdll!RtlpExecuteHandlerForException+0xf

09 00000064`007bc1b0 00007ffd`3f7bfe7e ntdll!RtlDispatchException+0x219

0a 00000064`007bc8c0 00007ffd`01f5735d ntdll!KiUserExceptionDispatch+0x2e

0b 00000064`007bd070 00007ffd`01f57392 tcl86t!Tcl_PanicVA+0x13d

0c 00000064`007bd0f0 00007ffd`01e83884 tcl86t!Tcl_Panic+0x22

0d 00000064`007bd120 00007ffd`01e86393 tcl86t!Tcl_AsyncDelete+0x114

0e 00000064`007bd150 00007ffd`234c414c tcl86t!Tcl_DeleteInterp+0xf3

0f 00000064`007bd1a0 00007ffc`ef4f728d _tkinter!PyInit__tkinter+0x14bc

10 00000064`007bd1d0 00007ffc`ef4f5706 python37!PyObject_Hash+0x349

11 00000064`007bd210 00007ffc`ef4f71ed python37!PyDict_GetItem+0x4a6

12 00000064`007bd260 00007ffc`ef53c803 python37!PyObject_Hash+0x2a9

13 00000064`007bd2a0 00007ffc`ef4e0673 python37!PyErr_NoMemory+0xe49f

14 00000064`007bd2d0 00007ffc`ef514ee4 python37!PyCFunction_NewEx+0x137

15 00000064`007bd300 00007ffc`ef514b20 python37!PyMethod_ClearFreeList+0x568

16 00000064`007bd3a0 00007ffc`ef514add python37!PyMethod_ClearFreeList+0x1a4

17 00000064`007bd3d0 00007ffc`ef538500 python37!PyMethod_ClearFreeList+0x161

18 00000064`007bd400 00007ffc`ef4da197 python37!PyErr_NoMemory+0xa19c

19 00000064`007bd430 00007ffc`ef50e77d python37!PyObject_GetIter+0x1f

1a 00000064`007bd460 00007ffc`ef50b146 python37!PyEval_EvalFrameDefault+0xa4d

1b 00000064`007bd5a0 00007ffc`ef50dbcc python37!PyEval_EvalCodeWithName+0x1a6

1c 00000064`007bd640 00007ffc`ef50e1df python37!PyMethodDef_RawFastCallKeywords+0xccc

1d 00000064`007bd700 00007ffc`ef50b146 python37!PyEval_EvalFrameDefault+0x4af

1e 00000064`007bd840 00007ffc`ef4d358b python37!PyEval_EvalCodeWithName+0x1a6

*** WARNING: Unable to verify checksum for lib.cp37-win_amd64.pyd

1f 00000064`007bd8e0 00007ffd`02bb9163 python37!PyEval_EvalCodeEx+0x9b

20 00000064`007bd970 00007ffd`02bb8c82 lib_cp37_win_amd64+0x9163

21 00000064`007bd9f0 00007ffd`02bda552 lib_cp37_win_amd64+0x8c82

22 00000064`007bda20 00007ffd`02bdaeed lib_cp37_win_amd64!PyInit_lib+0x1c542

23 00000064`007bdb50 00007ffc`ef50d255 lib_cp37_win_amd64!PyInit_lib+0x1cedd

24 00000064`007bdbe0 00007ffc`ef50db17 python37!PyMethodDef_RawFastCallKeywords+0x355

25 00000064`007bdc60 00007ffc`ef50ed2a python37!PyMethodDef_RawFastCallKeywords+0xc17

26 00000064`007bdd20 00007ffc`ef50b146 python37!PyEval_EvalFrameDefault+0xffa

27 00000064`007bde60 00007ffc`ef50dbcc python37!PyEval_EvalCodeWithName+0x1a6

28 00000064`007bdf00 00007ffc`ef50e5e2 python37!PyMethodDef_RawFastCallKeywords+0xccc

29 00000064`007bdfc0 00007ffc`ef50dab3 python37!PyEval_EvalFrameDefault+0x8b2

2a 00000064`007be100 00007ffc`ef50e1df python37!PyMethodDef_RawFastCallKeywords+0xbb3

2b 00000064`007be1c0 00007ffc`ef50dab3 python37!PyEval_EvalFrameDefault+0x4af

2c 00000064`007be300 00007ffc`ef50e5e2 python37!PyMethodDef_RawFastCallKeywords+0xbb3

2d 00000064`007be3c0 00007ffc`ef50dab3 python37!PyEval_EvalFrameDefault+0x8b2

2e 00000064`007be500 00007ffc`ef50e1df python37!PyMethodDef_RawFastCallKeywords+0xbb3

2f 00000064`007be5c0 00007ffc`ef50a3bd python37!PyEval_EvalFrameDefault+0x4af

30 00000064`007be700 00007ffc`ef4dc53b python37!PyFunction_FastCallDict+0xdd

31 00000064`007be7d0 00007ffc`ef5be47b python37!PyObject_Call+0xd3

32 00000064`007be800 00007ffc`ef5029cd python37!Py_hashtable_size+0x3e63

33 00000064`007be830 00007ffc`ef520b7b python37!PyList_Extend+0x1f1

34 00000064`007be870 00007ffc`ef520b3f python37!PyBuiltin_Init+0x587

35 00000064`007be8a0 00007ffc`ef4f78a7 python37!PyBuiltin_Init+0x54b

36 00000064`007be8e0 00007ffc`ef4f763a python37!PyObject_FastCallKeywords+0x3e7

37 00000064`007be910 00007ffc`ef50dbfe python37!PyObject_FastCallKeywords+0x17a

38 00000064`007be970 00007ffc`ef50e1df python37!PyMethodDef_RawFastCallKeywords+0xcfe

39 00000064`007bea30 00007ffc`ef50a3bd python37!PyEval_EvalFrameDefault+0x4af

3a 00000064`007beb70 00007ffc`ef4de47d python37!PyFunction_FastCallDict+0xdd

3b 00000064`007bec40 00007ffc`ef50eea5 python37!PyObject_IsAbstract+0x1b1

3c 00000064`007bec80 00007ffc`ef50b146 python37!PyEval_EvalFrameDefault+0x1175

3d 00000064`007bedc0 00007ffc`ef50a49a python37!PyEval_EvalCodeWithName+0x1a6

3e 00000064`007bee60 00007ffc`ef4de47d python37!PyFunction_FastCallDict+0x1ba

3f 00000064`007bef30 00007ffc`ef50eea5 python37!PyObject_IsAbstract+0x1b1

40 00000064`007bef70 00007ffc`ef50dab3 python37!PyEval_EvalFrameDefault+0x1175

41 00000064`007bf0b0 00007ffc`ef50e133 python37!PyMethodDef_RawFastCallKeywords+0xbb3

42 00000064`007bf170 00007ffc`ef50dab3 python37!PyEval_EvalFrameDefault+0x403

43 00000064`007bf2b0 00007ffc`ef50e133 python37!PyMethodDef_RawFastCallKeywords+0xbb3

44 00000064`007bf370 00007ffc`ef50a3bd python37!PyEval_EvalFrameDefault+0x403

45 00000064`007bf4b0 00007ffc`ef50a1de python37!PyFunction_FastCallDict+0xdd

46 00000064`007bf580 00007ffc`ef4de3f4 python37!PyMember_GetOne+0x732

47 00000064`007bf610 00007ffc`ef50eea5 python37!PyObject_IsAbstract+0x128

48 00000064`007bf650 00007ffc`ef50a3bd python37!PyEval_EvalFrameDefault+0x1175

49 00000064`007bf790 00007ffc`ef51e834 python37!PyFunction_FastCallDict+0xdd

4a 00000064`007bf860 00007ffc`ef51e7a1 python37!PyObject_Call_Prepend+0x6c

4b 00000064`007bf8f0 00007ffc`ef4dc4dd python37!PyDict_Contains+0x6d5

4c 00000064`007bf920 00007ffc`ef5d7a4e python37!PyObject_Call+0x75

4d 00000064`007bf950 00007ffc`ef67894a python37!PySignal_AfterFork+0x157a

4e 00000064`007bf980 00007ffd`3cd6d9f2 python37!PyThread_tss_is_created+0xde

4f 00000064`007bf9b0 00007ffd`3f637bd4 ucrtbase!thread_start<unsigned int (__cdecl*)(void *),1>+0x42

50 00000064`007bf9e0 00007ffd`3f78cee1 kernel32!BaseThreadInitThunk+0x14

51 00000064`007bfa10 00000000`00000000 ntdll!RtlUserThreadStart+0x21
We noticed PyErr_NoMemory function calls, but the offset was too big (0xe49f) that we considered that Incorrect Symbolic Information. Indeed, there were only export symbols available:
0:020> lmv m python37

Browse full module list

start             end                 module name

00007ffc`ef4d0000 00007ffc`ef88f000   python37   (export symbols)       python37.dll

    Loaded symbol image file: python37.dll

    Image path: C:\Program Files (x86)\Microsoft Visual Studio\Shared\Python37_64\python37.dll

    Image name: python37.dll

    Browse all global symbols  functions  data

    Timestamp:        Mon Mar 25 22:22:41 2019 (5C9954B1)

    CheckSum:         00396A11

    ImageSize:        003BF000

    File version:     3.7.3150.1013

    Product version:  3.7.3150.1013

    File flags:       0 (Mask 3F)

    File OS:          4 Unknown Win32

    File type:        2.0 Dll

    File date:        00000000.00000000

    Translations:     0000.04b0

    Information from resource tables:

        CompanyName:      Python Software Foundation

        ProductName:      Python

        InternalName:     Python DLL

        OriginalFilename: python37.dll

        ProductVersion:   3.7.3

        FileVersion:      3.7.3

        FileDescription:  Python Core

        LegalCopyright:   Copyright © 2001-2016 Python Software Foundation. Copyright © 2000 BeOpen.com. Copyright © 1995-2001 CNRI. Copyright © 1991-1995 SMC.
Fortunately, this Python installation came with PDB files, so we provided a path to them:
0:020> .sympath+ C:\Program Files (x86)\Microsoft Visual Studio\Shared\Python37_64

Symbol search path is: srv*;C:\Program Files (x86)\Microsoft Visual Studio\Shared\Python37_64

Expanded Symbol search path is: cache*;SRV*https://msdl.microsoft.com/download/symbols;

c:\program files (x86)\microsoft visual studio\shared\python37_64
************* Path validation summary **************
Response Time (ms) Location
Deferred srv*
OK C:\Program Files (x86)\Microsoft Visual Studio\Shared\Python37_64
Then we got the better stack trace:
0:020> .ecxr

rax=0000000000000000 rbx=00007ffd01fd0e60 rcx=0000000000002402

rdx=00007ffd3ce3b770 rsi=00007ffd02000200 rdi=000001b38a51d9c0

rip=00007ffd01f5735d rsp=00000064007bd070 rbp=0000000000000002

 r8=00000064007bc828  r9=00000064007bc920 r10=0000000000000000

r11=00000064007bcf70 r12=000001b38a51d9c0 r13=000001b38a51d8c0

r14=000001b38a51d9c0 r15=00007ffd01e86393

iopl=0         nv up ei pl nz na pe nc

cs=0033  ss=002b  ds=002b  es=002b  fs=0053  gs=002b             efl=00000202

tcl86t!Tcl_PanicVA+0x13d:

00007ffd`01f5735d cc              int     3
0:020> kL
*** Stack trace for last set context - .thread/.cxr resets it
# Child-SP RetAddr Call Site
00 00000064`007bd070 00007ffd`01f57392 tcl86t!Tcl_PanicVA+0x13d
01 00000064`007bd0f0 00007ffd`01e83884 tcl86t!Tcl_Panic+0x22
02 00000064`007bd120 00007ffd`01e86393 tcl86t!Tcl_AsyncDelete+0x114
03 00000064`007bd150 00007ffd`234c414c tcl86t!Tcl_DeleteInterp+0xf3
04 00000064`007bd1a0 00007ffc`ef4f728d _tkinter!PyInit__tkinter+0x14bc
05 00000064`007bd1d0 00007ffc`ef4f5706 python37!dict_dealloc+0x22d
06 00000064`007bd210 00007ffc`ef4f71ed python37!subtype_dealloc+0x176
07 (Inline Function) --------`-------- python37!free_keys_object+0xf5
08 00000064`007bd260 00007ffc`ef53c803 python37!dict_dealloc+0x18d
09 00000064`007bd2a0 00007ffc`ef4e0673 python37!subtype_clear+0x5b967
0a 00000064`007bd2d0 00007ffc`ef514ee4 python37!delete_garbage+0x4b
0b 00000064`007bd300 00007ffc`ef514b20 python37!collect+0x184
0c 00000064`007bd3a0 00007ffc`ef514add python37!collect_with_callback+0x34
0d 00000064`007bd3d0 00007ffc`ef538500 python37!collect_generations+0x4d
0e (Inline Function) --------`-------- python37!_PyObject_GC_Alloc+0x5e2ec
0f (Inline Function) --------`-------- python37!_PyObject_GC_Malloc+0x5e2ec
10 (Inline Function) --------`-------- python37!_PyObject_GC_New+0x5e2f3
11 00000064`007bd400 00007ffc`ef4da197 python37!tuple_iter+0x5e310
12 00000064`007bd430 00007ffc`ef50e77d python37!PyObject_GetIter+0x1f
13 00000064`007bd460 00007ffc`ef50b146 python37!_PyEval_EvalFrameDefault+0xa4d
14 (Inline Function) --------`-------- python37!PyEval_EvalFrameEx+0x17
15 00000064`007bd5a0 00007ffc`ef50dbcc python37!_PyEval_EvalCodeWithName+0x1a6
16 (Inline Function) --------`-------- python37!_PyFunction_FastCallKeywords+0x1ca
17 00000064`007bd640 00007ffc`ef50e1df python37!call_function+0x3ac
18 00000064`007bd700 00007ffc`ef50b146 python37!_PyEval_EvalFrameDefault+0x4af
19 (Inline Function) --------`-------- python37!PyEval_EvalFrameEx+0x17
1a 00000064`007bd840 00007ffc`ef4d358b python37!_PyEval_EvalCodeWithName+0x1a6
1b 00000064`007bd8e0 00007ffd`02bb9163 python37!PyEval_EvalCodeEx+0x9b
1c 00000064`007bd970 00007ffd`02bb8c82 lib_cp37_win_amd64+0x9163
1d 00000064`007bd9f0 00007ffd`02bda552 lib_cp37_win_amd64+0x8c82
1e 00000064`007bda20 00007ffd`02bdaeed lib_cp37_win_amd64!PyInit_lib+0x1c542
1f 00000064`007bdb50 00007ffc`ef50d255 lib_cp37_win_amd64!PyInit_lib+0x1cedd
20 00000064`007bdbe0 00007ffc`ef50db17 python37!_PyMethodDef_RawFastCallKeywords+0x355
21 (Inline Function) --------`-------- python37!_PyCFunction_FastCallKeywords+0x22
22 00000064`007bdc60 00007ffc`ef50ed2a python37!call_function+0x2f7
23 00000064`007bdd20 00007ffc`ef50b146 python37!_PyEval_EvalFrameDefault+0xffa
24 (Inline Function) --------`-------- python37!PyEval_EvalFrameEx+0x17
25 00000064`007bde60 00007ffc`ef50dbcc python37!_PyEval_EvalCodeWithName+0x1a6
26 (Inline Function) --------`-------- python37!_PyFunction_FastCallKeywords+0x1ca
27 00000064`007bdf00 00007ffc`ef50e5e2 python37!call_function+0x3ac
28 00000064`007bdfc0 00007ffc`ef50dab3 python37!_PyEval_EvalFrameDefault+0x8b2
29 (Inline Function) --------`-------- python37!PyEval_EvalFrameEx+0x17
2a (Inline Function) --------`-------- python37!function_code_fastcall+0x5e
2b (Inline Function) --------`-------- python37!_PyFunction_FastCallKeywords+0xb1
2c 00000064`007be100 00007ffc`ef50e1df python37!call_function+0x293
2d 00000064`007be1c0 00007ffc`ef50dab3 python37!_PyEval_EvalFrameDefault+0x4af
2e (Inline Function) --------`-------- python37!PyEval_EvalFrameEx+0x17
2f (Inline Function) --------`-------- python37!function_code_fastcall+0x5e
30 (Inline Function) --------`-------- python37!_PyFunction_FastCallKeywords+0xb1
31 00000064`007be300 00007ffc`ef50e5e2 python37!call_function+0x293
32 00000064`007be3c0 00007ffc`ef50dab3 python37!_PyEval_EvalFrameDefault+0x8b2
33 (Inline Function) --------`-------- python37!PyEval_EvalFrameEx+0x17
34 (Inline Function) --------`-------- python37!function_code_fastcall+0x5e
35 (Inline Function) --------`-------- python37!_PyFunction_FastCallKeywords+0xb1
36 00000064`007be500 00007ffc`ef50e1df python37!call_function+0x293
37 00000064`007be5c0 00007ffc`ef50a3bd python37!_PyEval_EvalFrameDefault+0x4af
38 (Inline Function) --------`-------- python37!PyEval_EvalFrameEx+0x17
39 (Inline Function) --------`-------- python37!function_code_fastcall+0x5c
3a 00000064`007be700 00007ffc`ef4dc53b python37!_PyFunction_FastCallDict+0xdd
3b 00000064`007be7d0 00007ffc`ef5be47b python37!PyObject_Call+0xd3
3c 00000064`007be800 00007ffc`ef5029cd python37!starmap_next+0x67
3d 00000064`007be830 00007ffc`ef520b7b python37!list_extend+0x1e9
3e 00000064`007be870 00007ffc`ef520b3f python37!list___init___impl+0x27
3f 00000064`007be8a0 00007ffc`ef4f78a7 python37!list___init__+0x67
40 00000064`007be8e0 00007ffc`ef4f763a python37!type_call+0xa7
41 00000064`007be910 00007ffc`ef50dbfe python37!_PyObject_FastCallKeywords+0x17a
42 00000064`007be970 00007ffc`ef50e1df python37!call_function+0x3de
43 00000064`007bea30 00007ffc`ef50a3bd python37!_PyEval_EvalFrameDefault+0x4af
44 (Inline Function) --------`-------- python37!PyEval_EvalFrameEx+0x17
45 (Inline Function) --------`-------- python37!function_code_fastcall+0x5c
46 00000064`007beb70 00007ffc`ef4de47d python37!_PyFunction_FastCallDict+0xdd
47 (Inline Function) --------`-------- python37!PyObject_Call+0xcf
48 00000064`007bec40 00007ffc`ef50eea5 python37!do_call_core+0x14d
49 00000064`007bec80 00007ffc`ef50b146 python37!_PyEval_EvalFrameDefault+0x1175
4a (Inline Function) --------`-------- python37!PyEval_EvalFrameEx+0x17
4b 00000064`007bedc0 00007ffc`ef50a49a python37!_PyEval_EvalCodeWithName+0x1a6
4c 00000064`007bee60 00007ffc`ef4de47d python37!_PyFunction_FastCallDict+0x1ba
4d (Inline Function) --------`-------- python37!PyObject_Call+0xcf
4e 00000064`007bef30 00007ffc`ef50eea5 python37!do_call_core+0x14d
4f 00000064`007bef70 00007ffc`ef50dab3 python37!_PyEval_EvalFrameDefault+0x1175
50 (Inline Function) --------`-------- python37!PyEval_EvalFrameEx+0x17
51 (Inline Function) --------`-------- python37!function_code_fastcall+0x5e
52 (Inline Function) --------`-------- python37!_PyFunction_FastCallKeywords+0xb1
53 00000064`007bf0b0 00007ffc`ef50e133 python37!call_function+0x293
54 00000064`007bf170 00007ffc`ef50dab3 python37!_PyEval_EvalFrameDefault+0x403
55 (Inline Function) --------`-------- python37!PyEval_EvalFrameEx+0x17
56 (Inline Function) --------`-------- python37!function_code_fastcall+0x5e
57 (Inline Function) --------`-------- python37!_PyFunction_FastCallKeywords+0xb1
58 00000064`007bf2b0 00007ffc`ef50e133 python37!call_function+0x293
59 00000064`007bf370 00007ffc`ef50a3bd python37!_PyEval_EvalFrameDefault+0x403
5a (Inline Function) --------`-------- python37!PyEval_EvalFrameEx+0x17
5b (Inline Function) --------`-------- python37!function_code_fastcall+0x5c
5c 00000064`007bf4b0 00007ffc`ef50a1de python37!_PyFunction_FastCallDict+0xdd
5d (Inline Function) --------`-------- python37!_PyObject_FastCallDict+0x25
5e (Inline Function) --------`-------- python37!_PyObject_Call_Prepend+0x5a
5f 00000064`007bf580 00007ffc`ef4de3f4 python37!method_call+0x92
60 (Inline Function) --------`-------- python37!PyObject_Call+0x46
61 00000064`007bf610 00007ffc`ef50eea5 python37!do_call_core+0xc4
62 00000064`007bf650 00007ffc`ef50a3bd python37!_PyEval_EvalFrameDefault+0x1175
63 (Inline Function) --------`-------- python37!PyEval_EvalFrameEx+0x17
64 (Inline Function) --------`-------- python37!function_code_fastcall+0x5c
65 00000064`007bf790 00007ffc`ef51e834 python37!_PyFunction_FastCallDict+0xdd
66 00000064`007bf860 00007ffc`ef51e7a1 python37!_PyObject_Call_Prepend+0x6c
67 00000064`007bf8f0 00007ffc`ef4dc4dd python37!slot_tp_call+0x51
68 00000064`007bf920 00007ffc`ef5d7a4e python37!PyObject_Call+0x75
69 00000064`007bf950 00007ffc`ef67894a python37!t_bootstrap+0x6a
6a 00000064`007bf980 00007ffd`3cd6d9f2 python37!bootstrap+0x32
6b 00000064`007bf9b0 00007ffd`3f637bd4 ucrtbase!thread_start<unsigned int (__cdecl*)(void *),1>+0x42
6c 00000064`007bf9e0 00007ffd`3f78cee1 kernel32!BaseThreadInitThunk+0x14
6d 00000064`007bfa10 00000000`00000000 ntdll!RtlUserThreadStart+0x21
We noticed that something wasn’t quite right during Python garbage collection processing, so we disabled GC in our script and the problem was gone for the duration of its execution:
import gc
gc.disable()
Of course, we consider this as a temporary workaround and should add it to our Workaround Patterns catalog.
Pattern-Oriented Anomaly Detection and Analysis
We are preparing an outline of our consistent approach across domains that will be published as a booklet soon (ISBN: 978-1912636068).
Machine Learning Square and Software Diagnostics Institute Roadmap
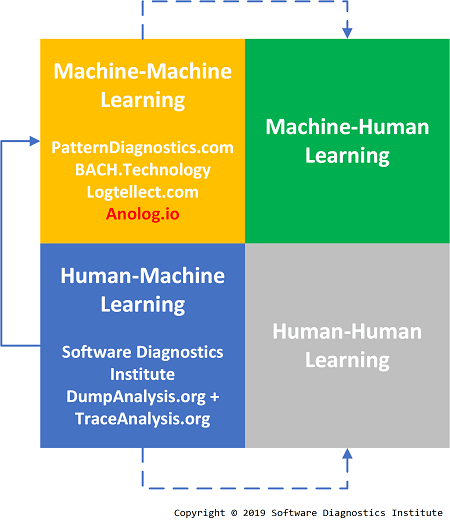
When researching ML from the point of view of sociology and humanities*, we came upon an idea of Machine Learning Machine Learning … sequence. Then we realised that there is a distinction between Machine-Machine Learning (Machine Learning of Machine structure and behaviour) and Machine-Human Learning (Machine Learning of Human state and behaviour, ML approaches to medical diagnostics). This naturally extends to a learning square where we add Human-Machine Learning (Human Learning of machine diagnostics) and Human-Human learning (Human Learning of Human state and behaviour, medicine, humanities, and sociology):
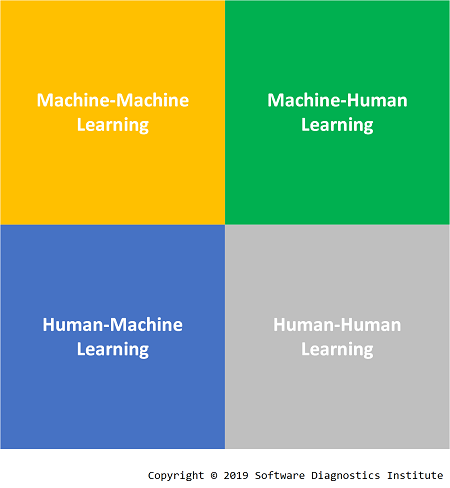
What we were mainly doing before 2018 is devising a set of Human-Machine Learning pattern languages. Recently we moved towards ML approaches, and this activity occupies Machine-Machine Learning quadrant. Since analysis patterns developed for Human-Machine Learning are sufficiently rich to be used in other domains than software results can be applied to Human-Human Learning (for example, narratology), and together with additional results from Machine-Machine Learning can be applied to Machine-Human Learning (for example, space-like narratology for image analysis):
* Machine Learners: Archaeology of a Data Practice, by Adrian Mackenzie (ISBN: 978-0262036825)
Application of Trace and Log Analysis Patterns to Image Analysis: Introducing Space-like Narratology
A while ago, we introduced Special and General trace and log analysis with the emphasis on causality. However, both types are still time-like, based on explicit or implicit time ordering. We now extend the same pattern-oriented analysis approach to image analysis where the ordering of “messages,” “events” or simply some “data” is space-like, or even metric-like (with the additional direction if necessary). In the initial step, we replace Time coordinate with some metric based on the nature of data, for example, the case of Periodic Error is shown in this simplified spatial picture:
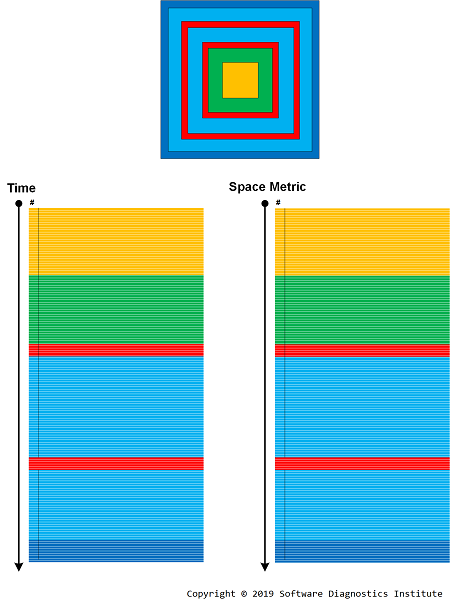
Similar replacement can be done in case of Time Delta -> Space Delta -> Metric Delta and Discontinuity. We are now assessing the current 170 analysis patterns* (where most of them are time-like) in terms of their applicability to image analysis and submit analysis pattern extensions.
* Trace and Log Analysis: A Pattern Reference for Diagnostics and Anomaly Detection, Third Edition, forthcoming (ISBN: 978-1912636044)
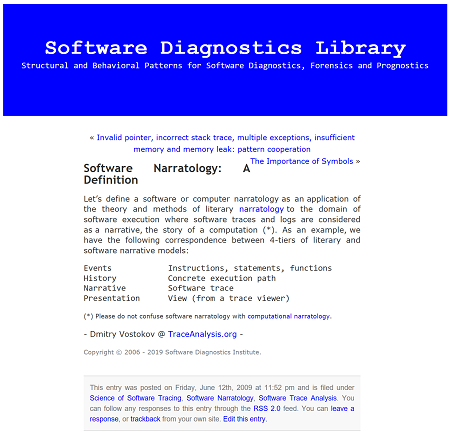
10 Years of Software Narratology
On 12 June, 10 years ago, we were looking for a fruitful foundation for software trace and log analysis beyond a sequence of memory fragments. Coincidently and unconnectedly, at that time, we were learning about narratology from some literary theory textbooks. Then we got an insight about similarities between storytelling and logging. Structures of traditional narrative and their narrative analysis could also guide in devising new trace and log analysis patterns. Thus, Software Narratology was born. Here we reproduce the original blog post screenshot from Software Diagnostics Library:
In a couple of years after that we were contacted by people who were writing software for narratology, so we promptly (in February 2012) decided to organize a webinar to clear the confusion between Software Narratology and narratology software. Here is the webinar logo we designed at that time (colors symbolize kernel, user, and managed memory spaces):

The recording of this webinar is available on YouTube, and slides are available for download. The transcript of that webinar was later published as a short book which is available in various formats. Volume 7 of Memory Dump Analysis Anthology has a section devoted to diverse topics in Software Narratology partially covered in that webinar. Additional Software Narratology articles are available in subsequent volumes. Reflecting on that history, we think the glimpses of Software Narratology also originated with our earlier thinking about historical narratives in the context of memory dump analysis (March 2009).
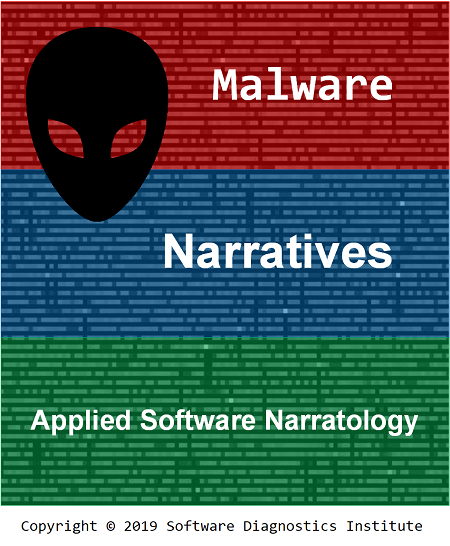
After a year, we applied software narratological thinking to malware analysis (March 2013): Malware Narratives, with available slides, recording, and published transcript in various formats.
In subsequent years the following ideas were further discovered, invented, and elaborated:
- Generalized Software Narratives (March 2013)
- Hardware Narratology (April 2013)
- Software Narratology of Things (December 2013)
- Higher-order pattern narratives (August 2014)
- Malnarratives (October 2014)
- Articoding (June 2015)
- Graph-theoretic approach (October 2016)
- Narrachain (October 2017)
Despite the move to contemporary mathematics as a source of new trace and log analysis patterns in the recent years, Software Narratology experiences its second revolution through the application of Future Narratives* to diagnostic analysis and debugging processes (Bifurcation Point, Polytrace) and the following forthcoming developments:
- Software Narratives as software "autobiographies."
- Cartesian Software Narratives (Cartesian Trace).
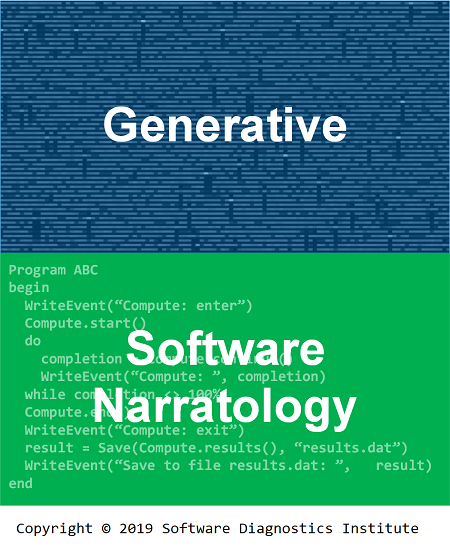
- Incorporation of source code into trace analysis via Moduli Traces. We called this originally (June 2013) Generative Software Narratology.
*Future Narratives: Theory, Poetics, and Media-Historical Moment, by Christoph Bode, Rainer Dietrich (ISBN: 978-3110272123)
Analysis Pattern Duality
Some of our memory analysis patterns are parameterized by structural constraints (such as a particular type of space or dump, or a memory region) or objects (for example, synchronization). We recently worked on a few analysis patterns and discovered the type of duality between them when the parameter itself could have related problems:
ProblemPattern(Parameter) <-> ParameterProblem(ProblemPattern)
For example, Insufficient Memory (Stack) vs. Stack Overflow (Insufficient Memory). In the first analysis pattern variant, insufficient memory may be reported because of full stack region and in the second analysis pattern variant, stack overflow is reported because there is not enough memory to expand stack region.
This duality can aid in new pattern discoveries and especially in analyzing possible root causes and their causal mechanisms (software pathology) given the multiplicity of diagnostic indicators when we consider parameters as analysis patterns themselves. Let’s look at another example: Invalid Pointer (Insufficient Memory). It is a common sequence when a memory leak fails memory allocation, and then certain pointers remain uninitialized or NULL. Consider its dual Insufficient Memory (Invalid Pointer) when, for example, memory is not released because some pointer becomes invalid. The latter can happen when memory is overwritten with NULL values, or access violation is handled and ignored.
The closest mathematical analogy here is order duality. It is different from the duality of software artifacts, such as logs and memory dumps, and memory space dualities.
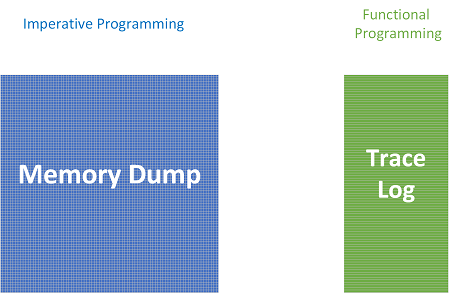
Log’s Loxels and Trace Message’s Mexels Graphical Representation of Software Traces and Logs
Our system and method stem from texels, voxels, and pixels as elements of textures, 3D and 2D picture representation grids and the way we depict traces and logs in Dia|gram graphical diagnostic analysis language:
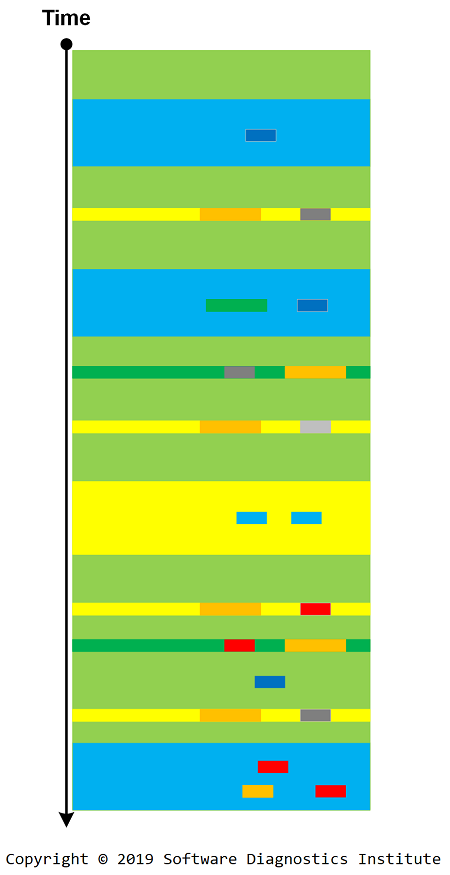
Loxel is an element of a log or software trace. It is usually a log or trace message. Usually, such messages are generated from specific code points, and, therefore, may have unique identifiers. Such UIDs can be mapped to specific colors:
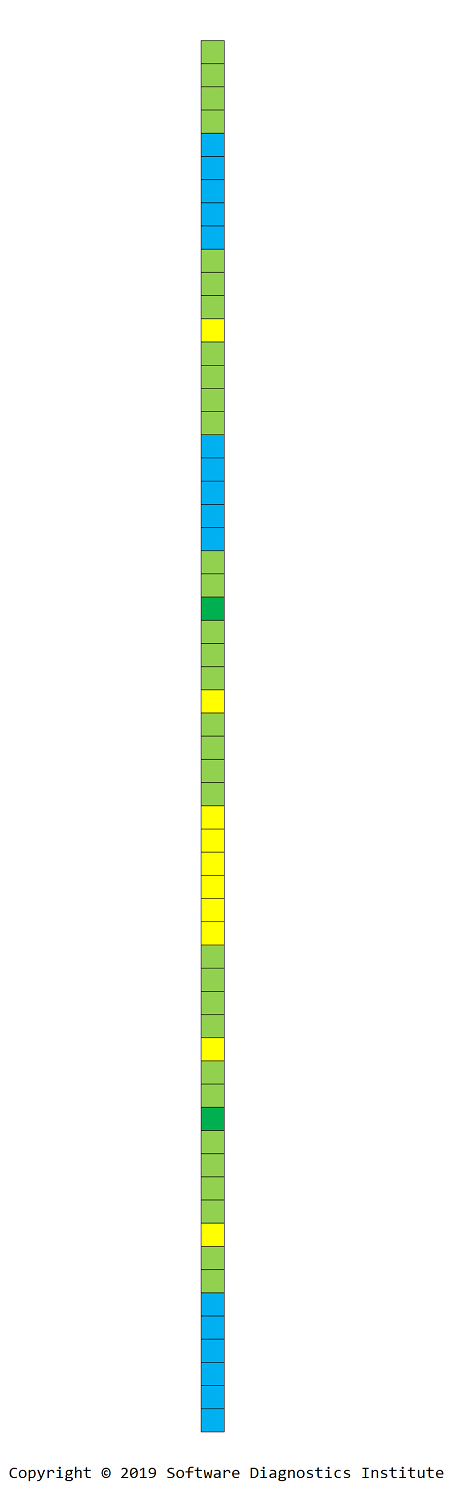
For visualization purposes and 2D processing, we can collapse 1D picture into a 2D loxel image using top-to-down and left-to-right direction:
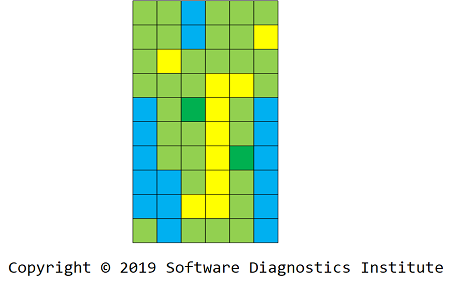
We can also include Silent Messages in the picture by imposing fixed time resolution grid:
We apply the same procedure to get 1D and 2D images:
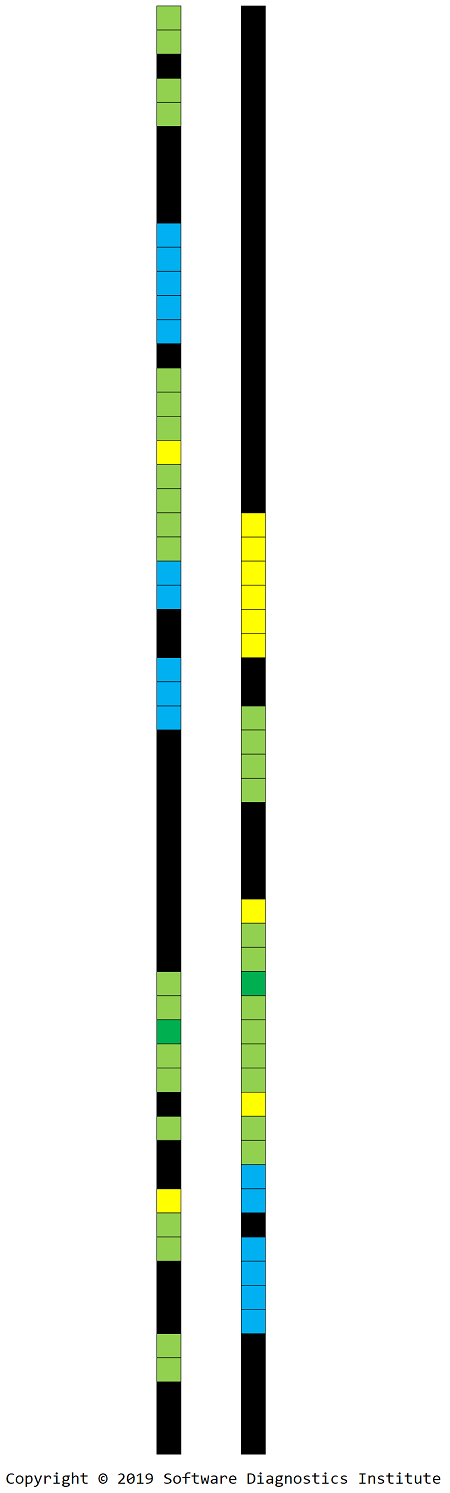
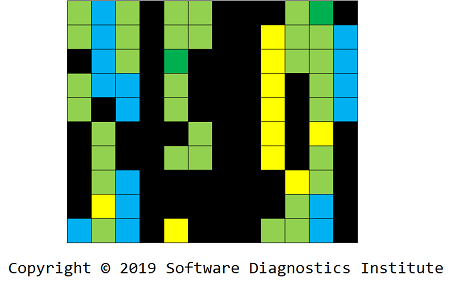
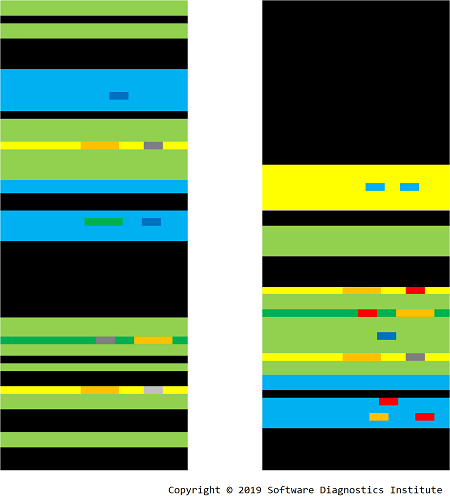
Each loxel may contain Message Invariant and variable parts such as Message Constants and other data values such as handles, pointers, Counter Values, and other Random Data in general. We call a variable parts mexel, and mexels form layers in order of their appearance in loxels:
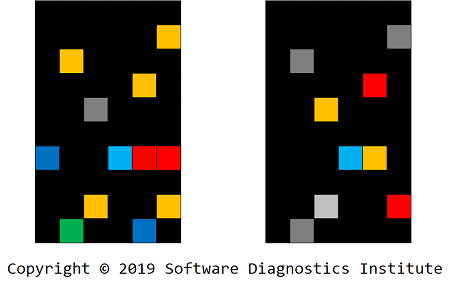
Therefore, for this modeling example, after loxelation and mexelation, we got 3 layers that we can use for anomaly detection via digital image processing and machine learning:
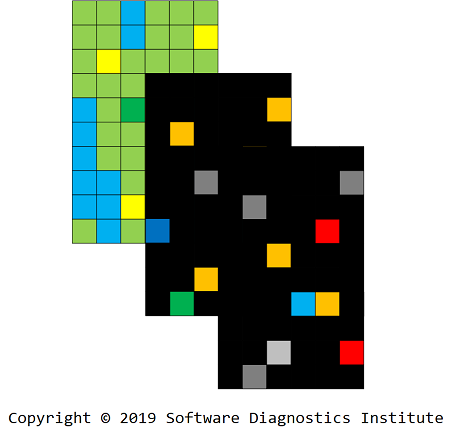
In conclusion, we would like to note that this is an artificial representation compared with the natural representation where trace memory content is used for pixel data.
10 Years of Trace and Log Analysis Patterns

In 2009, on April 28 we introduced the new category of diagnostic analysis patterns. We reproduce the picture of that original post because it was later edited and split into an introduction and separate Periodic Error analysis pattern:
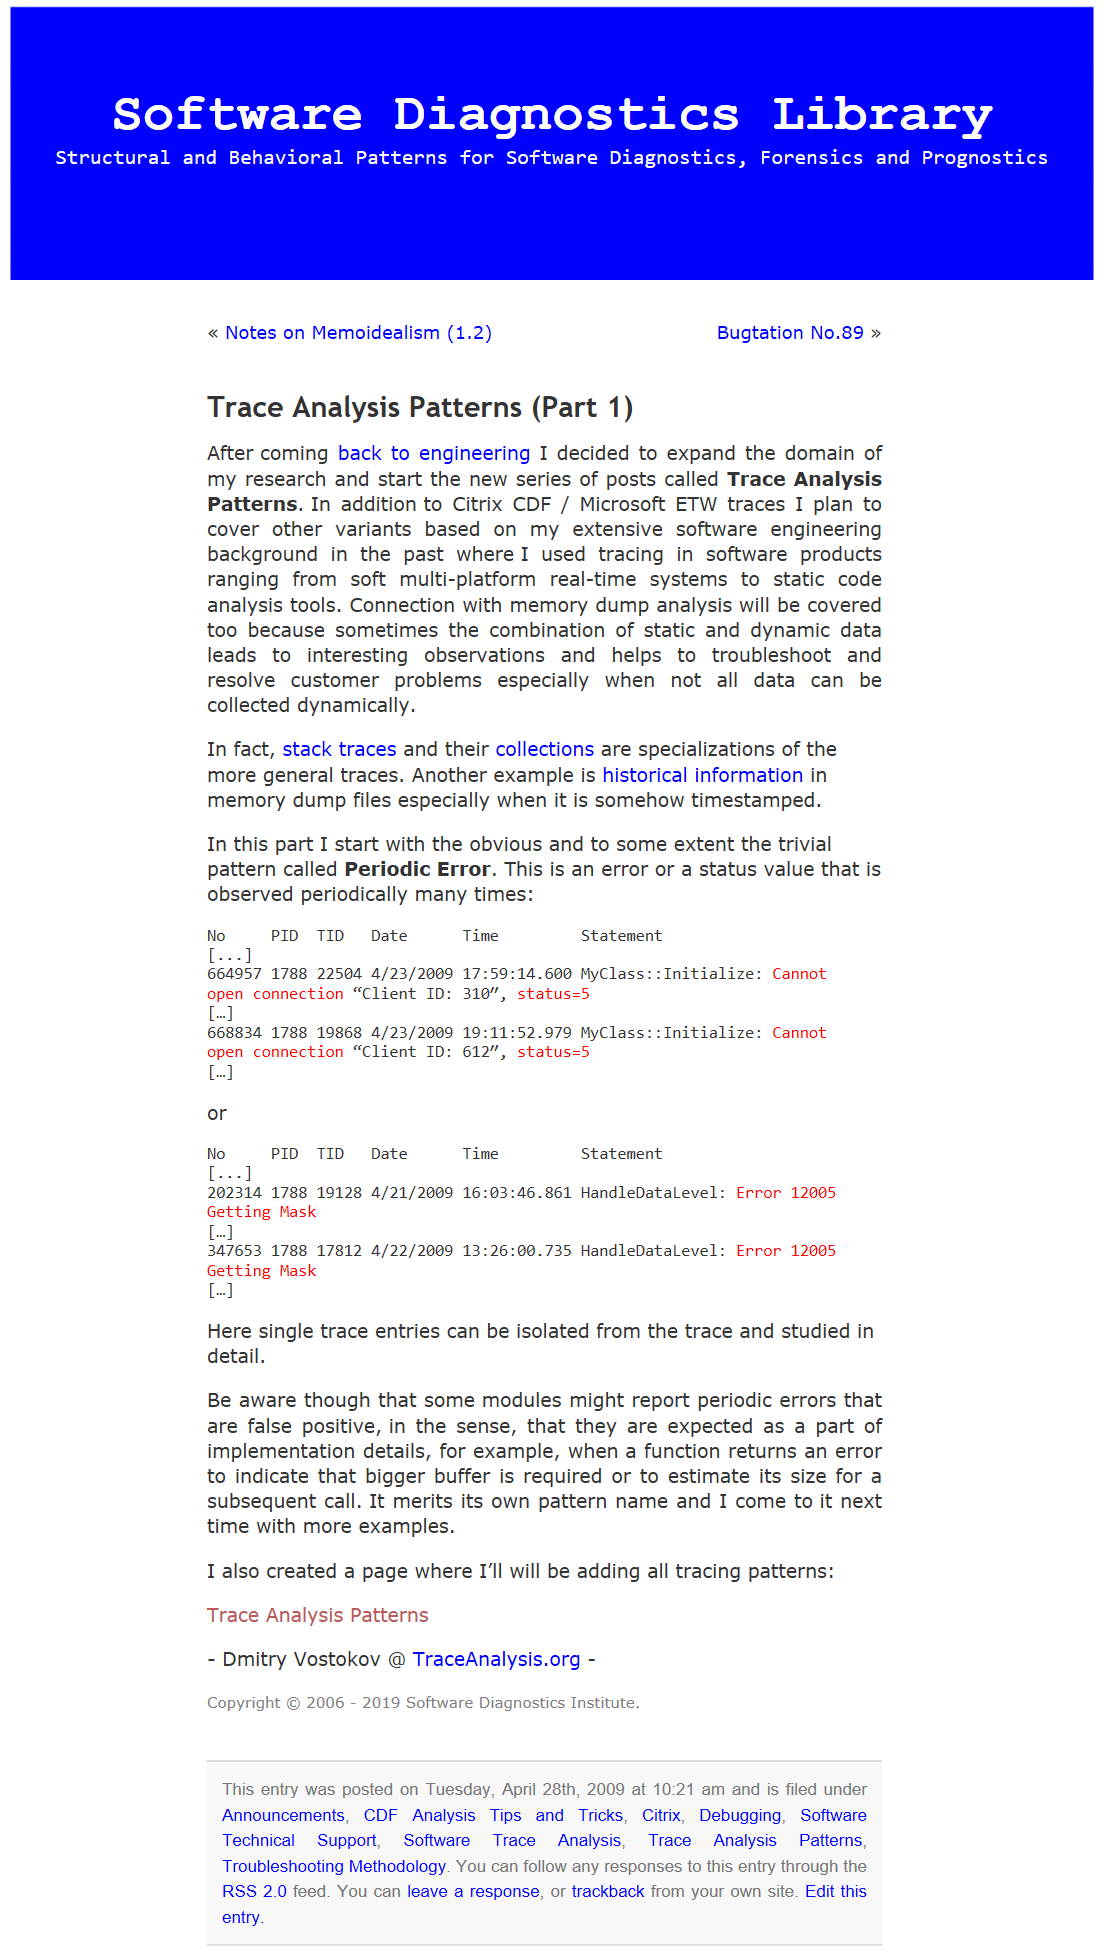
Upon the inception and its first publication, the first pattern wasn’t illustrated graphically. Such illustrations were only added later starting with the bird’s eye view in Characteristic Message Block and then taking its current shape in Activity Region analysis patterns finally culminating in Software Trace Diagrams and Dia|gram graphical diagnostic analysis language. The pictures missing in the first pattern descriptions were later added to the training course which initially served as a reference for the first 60 patterns:
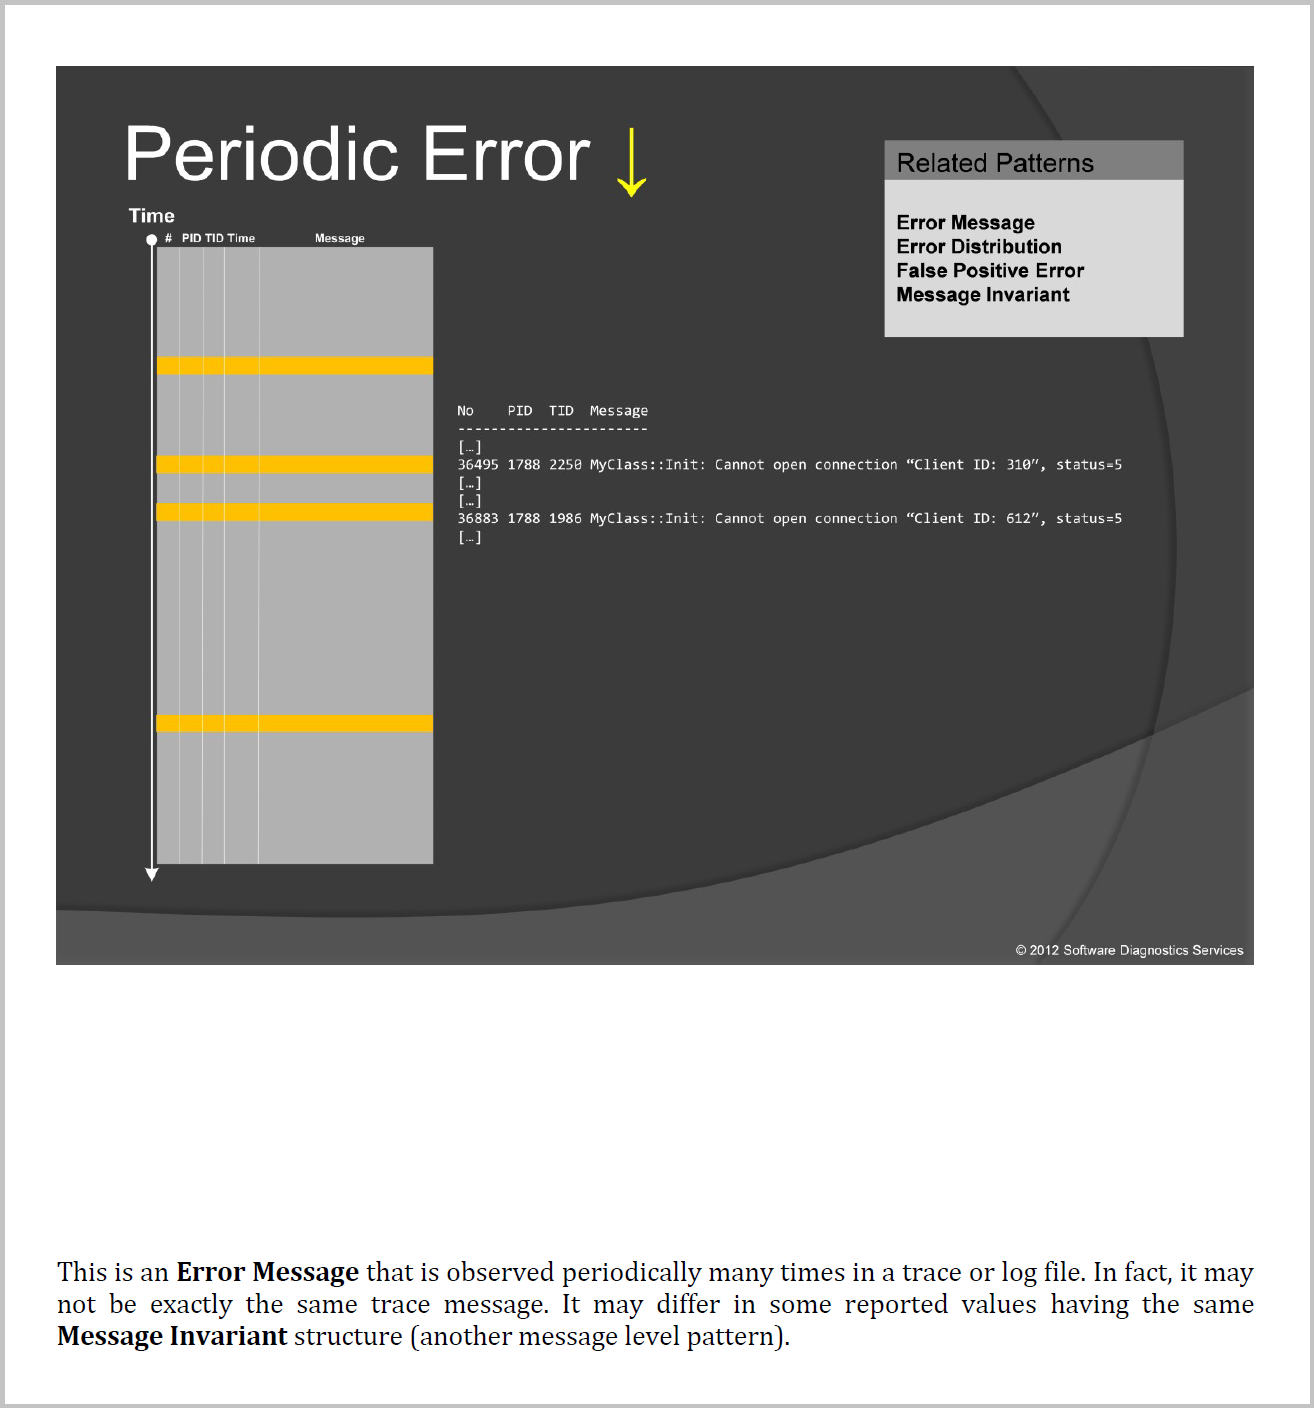
When more and more patterns were added to the pattern catalog, we published an updated reference, which is now in the second edition and covers more than 130 patterns. Now there are almost 170 patterns at the time of this writing, and the new edition is forthcoming (Software Trace and Log Analysis: A Pattern Reference, Third Edition, ISBN: 978-1912636044).
Initially, trace analysis patterns lacked theoretical foundation but in less than two months Software Narratology was born (we track its history in a separate anniversary post). Later, both trace analysis and memory dump analysis were combined in a unified diagnostic analysis process, log analysis patterns became the part of pattern-driven software problem solving, and finally culminated with the birth of pattern-oriented software diagnostics. Both trace analysis patterns and Software Narratology became the foundation of malware narrative approach (malnarratives) to malware analysis. Also, the same pattern-oriented trace and analysis approach was applied to network trace analysis (see also the book) and became the foundation for pattern-oriented software forensics and Diagnostics of Things (DoT, the term that we coined). Trace analysis pattern language was proposed for performance analysis.
In addition to biochemical metaphors and artificial chemistry approaches, in the last few years we also extensively explored mathematical foundations of software trace and log analysis including topological, graph-theoretical, and category theory.
Software trace and log analysis was generalized to arbitrary event traces including memory analysis, and it became a part of pattern-oriented software data analysis.
The current frontier of research in Software Diagnostics Institute is exploration and incorporation of mechanisms and novel visualization approaches.
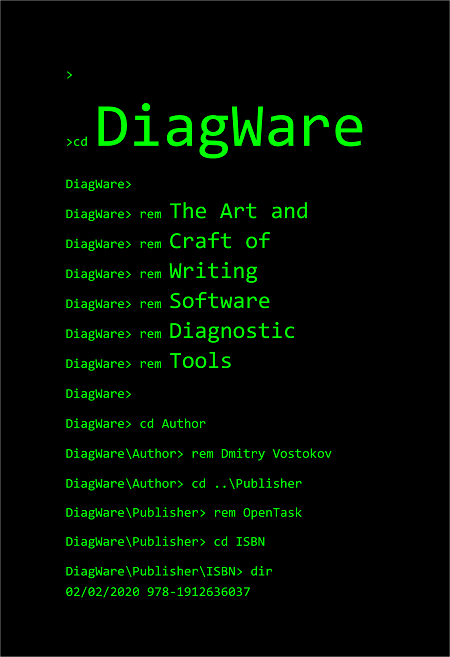
DiagWare: The Art and Craft of Writing Software Diagnostic Tools
The forthcoming book about designing and implementing software diagnostic tools (ISBN: 978-1912636037) has the following draft cover:
Introducing Software Pathology
Some time ago we introduced Iterative Pattern-Oriented Root Cause Analysis where we added mechanisms in addition to diagnostic checklists. Such mechanisms became the additional feature of Pattern-Oriented Software Data Analysis principles. Since medical diagnostics influenced some features of pattern-oriented software diagnostics, we found further extending medical metaphors useful. Since Pathology is the study of causes and effects, we introduce its systemic software correspondence as Software Pathology. The parts of the name “path-o-log-y” incorporate logs as artifacts and paths as certain trace and log analysis patterns such as Back Trace. We depict this relationship in the following logo:

Please also note a possible alternative category theory interpretation of “path-olog-y” using an olog approach to paths.
We, therefore, are happy to add Software Pathology as a discipline that studies mechanisms of abnormal software structure and behavior. It uses software traces and logs (and other types of software narratives) and memory snapshots (as generalized software narrative) as investigation media. Regarding the traditional computer graphics and visualization part of medical pathology, there is certain correspondence with software pathology as we demonstrated earlier that certain software defects could be visualized using native computer memory visualization techniques (the details can be found in several Memory Dump Analysis Anthology volumes).
The software pathology logo also prompted us to introduce a similar logo for Software Narratology as a “narration to log” metaphor:

Moving “y” from “Narratology” results in a true interpretation of software tracing: N-array-to-log.
Please note that the log icon in “narratology” logo part doesn’t have any abnormality indicator because a software log can be perfectly normal.
The last note to mention is that Software Pathology is different from pathology software, the same distinction applies to Software Narratology vs. narratology software, Software Diagnostics vs. diagnostics software, Software Forensics vs. forensics software, and Software Prognostics vs. prognostics software.
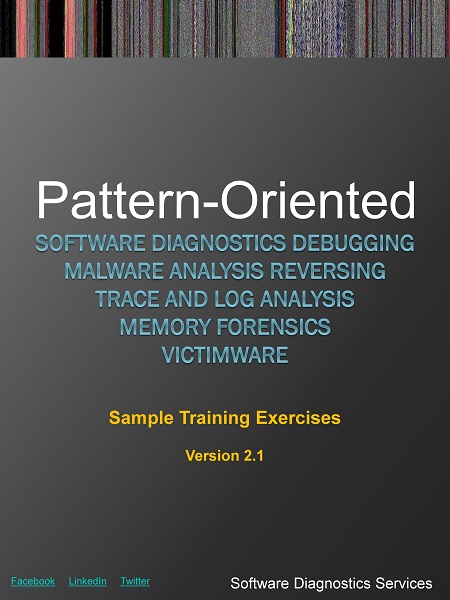
Pattern-Oriented Software Diagnostics, Debugging, Malware Analysis, Reversing, Log Analysis, Memory Forensics
This free eBook contains 9 sample exercises from 10 training courses developed by Software Diagnostics Services covering Windows WinDbg, Linux GDB, and Mac OS X GDB / LLDB debuggers and utilizing pattern-oriented methodology developed by Software Diagnostics Institute. The second edition was updated with the new sample exercises based on Windows 10.
Download the eBook
Memory Dump Analysis Anthology, Volume 11
The following direct links can be used to order the book:
Buy Paperback or Kindle print replica edition from Amazon
Buy Paperback from Barnes & Noble
Buy Paperback from Book Depository
Also available in PDF format from Software Diagnostics Services
This reference volume consists of revised, edited, cross-referenced, and thematically organized selected articles from Software Diagnostics Institute (DumpAnalysis.org + TraceAnalysis.org) and Software Diagnostics Library (former Crash Dump Analysis blog, DumpAnalysis.org/blog) about software diagnostics, root cause analysis, debugging, crash and hang dump analysis, software trace and log analysis written in June 2017 - November 2018 for software engineers developing and maintaining products on Windows platforms, quality assurance engineers testing software, technical support and escalation engineers dealing with complex software issues, security researchers, reverse engineers, malware and memory forensics analysts. This volume is fully cross-referenced with volumes 1 – 10 and features:
- 8 new crash dump analysis patterns with selected downloadable example memory dumps
- 15 new software trace and log analysis patterns
- Introduction to diagnostic operads
- Summary of mathematical concepts in software diagnostics and software data analysis
- Introduction to software diagnostics engineering
- Introduction to narrachain
- Introduction to diagnostics-driven development
- Principles of integral diamathics
- Introduction to meso-problem solving using meso-patterns
- Introduction to lego log analysis
- Introduction to artificial chemistry approach to software trace and log analysis
- WinDbg notes
- Updated C++17 source code of some previously published tools
- Selected entries from debugging dictionary
- List of recommended modern C++ books
- List of recommended books about algorithms
- Author's current CV
- Author's past resume written in WinDbg and GDB styles
This volume also includes articles from the former Crash Dump Analysis blog not previously available in print form.
Product information:
- Title: Memory Dump Analysis Anthology, Volume 11
- Authors: Dmitry Vostokov, Software Diagnostics Institute
- Language: English
- Product Dimensions: 22.86 x 15.24
- Paperback: 273 pages
- Publisher: OpenTask (November 2018)
- ISBN-13: 978-1-912636-11-2
Artificial Chemistry Approach to Software Trace and Log Analysis
In the past we proposed two metaphors regarding software trace and log analysis patterns (we abbreviate them as TAP):
- TAP as “genes” of software structure and behavior.
- Logs as “proteins” generated by code with TAP as patterns of “protein” structure.
We now introduce a third metaphor with strong modeling and implementation potential we are currently working on: Artificial Chemistry (AC) approach* where logs are “DNA” and log analysis is a set of reactions between logs and TAP which are individual “molecules”.
In addition to trace and logs as “macro-molecules”, we also have different molecule families of general patterns (P) and concrete patterns (C). General patterns, general analysis (L) and concrete analysis (A) patterns are also molecules (that may also be composed of patterns and analysis patterns) that may serve the role of enzymes. Here we follow the division of patterns into four types. During the reaction, a trace T is usually transformed into T’ (having a different “energy”) molecule (with a marked site to necessitate further elastic collisions to avoid duplicate analysis).
T + Pi -> T’ + Pi + Ck
T + Ci -> T’ + 2Ci
T + Li -> T’ + Li + Ck
T + Li -> T’ + Li + Ak
T + Ai -> T’ + Ai + Ak
Ci + Ck -> Ci-Ck
Cl + Cm -> Ck
Ai + Ak -> Ai-Ak
T + Ai-Ak -> T’ + Ai-Ak + Ci
…
Different reactions can be dynamically specified according to a reactor algorithm. The following diagram shows a few elementary reactions:
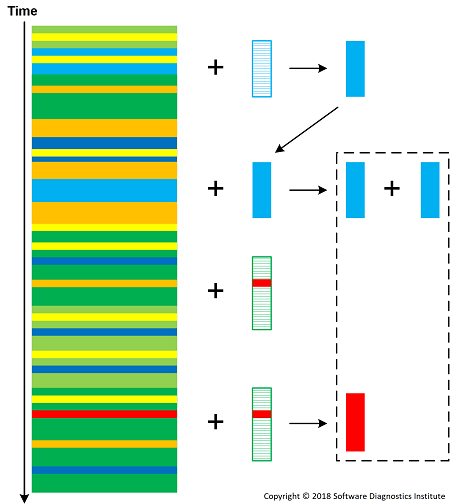
Concentrations of patterns (reaction educts) increases the chances of producing reaction products according to corresponding reaction "mass action". We can also introduce pattern consuming reactions such as T + Li -> T' + Ck but this requires the constant supply of analysis pattern molecules. Intermediate molecules may react with a log as well and be a part of analysis construction (second order trace and log).
Since traces and logs can be enormous, such reactions can occur randomly according to the Brownian motion of molecules. The reactor algorithm can also use Trace Sharding.
Some reactions may catalyze log transformation into a secondary structure with certain TAP molecules now binding to log sites. Alternatively, we can use different types of reactors, for example, well stirred or topologically arranged. We visualize a reactor for the reactions shown in the diagram above:
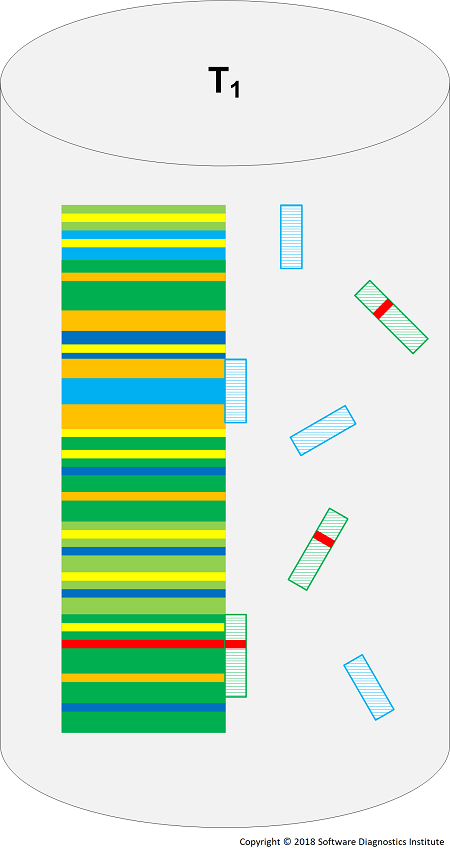

We can also add reactions that split and concatenate traces based on collision with certain patterns and reactions between different logs.
Many AC reactions are unpredictable and may uncover emergent novelty that can be missed during the traditional pattern matching and rule-based techniques.
The AC approach also allows simulations of various pattern and reaction sets independently of concrete traces and logs to find the best analysis approaches.
In addition to software trace and log analysis of traditional software execution artifacts, the same AC approach can be applied to malware analysis, network trace analysis and pattern-oriented software data analysis in general.
* Artificial Chemistries by Wolfgang Banzhaf and Lidia Yamamoto (ISBN: 978-0262029438)