Crash Dump Analysis Patterns (Part 7)
We have to live with tools that produce inconsistent dumps. For example, LiveKd.exe from sysinternals.com which is widely used by Microsoft and Citrix technical support to save complete memory dumps without server reboot. I even wrote an article for Citrix customers:
Using LiveKD to Save a Complete Memory Dump for Session or System Hangs
If you read it you will find an important note which is reproduced here:
LiveKd.exe-generated dumps are always inconsistent and cannot be a reliable source for certain types of dump analysis, for example, looking at resource contention. This is because it takes a considerable amount of time to save a dump on a live system and the system is being changed during that process. The instantaneous traditional CrashOnCtrlScroll method or SystemDump tool always save a reliable and consistent dump because the system is frozen first (any process or kernel activity is disabled), then a dump is saved to a page file.
If you look at such inconsistent dump you will find that many useful kernel structures such as ERESOURCE list (!locks) are broken and even circular referenced and therefore WinDbg commands display “strange” output.
Easy and painless (for customers) dump generation using such “Live” tools means that it is widely used and we have to analyze dumps saved by these tools and sent from customers. This brings us to the next crash dump analysis pattern called “Inconsistent Dump”.
If you have such dump you should look at it in order to extract maximum useful information that helps in identifying the root cause or give you further directions. Not all information is inconsistent in such dumps. For example, drivers, processes, thread stacks and IRP lists can give you some clues about activities. Even some information not visible in consistent dump can surface in inconsistent dump (subject to commands used).
For example, I had a LiveKd dump where I looked at process stacks by running the script I created earlier:
and I found that for some processes in addition to their own threads the script lists additional terminated threads that belong to a completely different process (have never seen it in consistent dump):

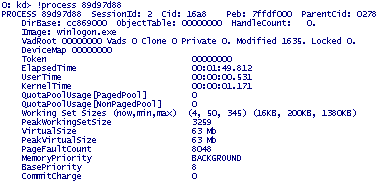
Process 89d97d88 is not visible in the active process list (script mentioned above or !process 0 0 command). However, if we feed this memory address to !process command (or explore it as _EPROCESS structure, dt command) we get its contents:

What might have happened there: terminated process 89d97d88 was excluded from active processes list but its structure was left in memory and due to inconsistency thread lists were also broken and therefore terminated threads surfaced when listing other processes and their threads.
I suspected here that winlogon.exe died in session 2 and left empty desktop window which a customer saw and complained about. The only left and visible process from session 2 was csrss.exe. The conclusion was to enable NTSD as a default postmortem debugger to catch winlogon.exe crash when it happens next time.
- Dmitry Vostokov @ DumpAnalysis.org -
September 18th, 2008 at 3:29 am
[…] http://www.dumpanalysis.org/blog/index.php/2007/01/24/crash-dump-analysis-patterns-part-7/ […]
February 23rd, 2009 at 11:47 am
[…] memory dumpers only and do not save kernel memory dump files. These dumps are known to be inconsistent and I elaborated on different schemes to save memory consistently, for example, 1) to partition […]
June 9th, 2009 at 11:10 pm
[…] more busy the system is, the more inconsistent are complete memory dumps produced by external physical memory dumpers. On the contrary, quiet […]
October 20th, 2009 at 11:41 pm
[…] of not looking at all stack traces. This is important when the dump is partially truncated or inconsistent. For example, in one complete memory dump from one hang system WinDbg !locks command is not able […]
November 8th, 2009 at 10:48 pm
[…] check paged pool usage but the output is inconsistent (shown in magenta […]
February 27th, 2010 at 2:06 am
[…] case study to show various wait chain patterns. The complete memory dump from a frozen system is inconsistent, saved by LiveKd. Stack trace collection shows many threads waiting for LPC […]
March 24th, 2010 at 2:56 pm
[…] Today we introduce an icon for Inconsistent Dump pattern: […]
June 7th, 2010 at 11:46 pm
[…] WinDbg reports another current thread running on the same processor so we obviously have an inconsistent dump and should exercise […]
September 22nd, 2010 at 9:57 pm
[…] Debugging Experts Magazine Online 100% CPU consumption was reported for one system and a complete memory dump was generated. Unfortunately, it was very inconsistent: […]
September 24th, 2010 at 10:52 am
[…] Inconsistent Dump […]
February 23rd, 2012 at 5:37 pm
The new version of LiveKd pauses a VM while saving a memory dump: http://technet.microsoft.com/en-ie/sysinternals/bb897415
December 29th, 2013 at 11:20 am
More options for consistency from LiveKd: http://technet.microsoft.com/en-us/sysinternals/bb897415.aspx
January 27th, 2016 at 10:18 am
An example of Mirror Dump in LiveKd: LiveKd and mirror dump example: http://blogs.msdn.com/b/ntdebugging/archive/2016/01/22/virtual-machine-managment-hangs-on-windows-server-2012-r2-hyper-v-host.aspx
April 25th, 2016 at 12:44 pm
If using LiveKd for child Hyper-V partitions (-hv) we should use -p option to pause the partition.