Multiple Exceptions (user mode) - Modeling Example
 Multiple Exceptions (kernel mode)
 Multiple Exceptions (managed space)
- Multiple Exceptions (stowed)
 Dynamic Memory Corruption (process heap)
 Dynamic Memory Corruption (kernel pool)
- Dynamic Memory Corruption (managed heap)
 False Positive Dump
 Lateral Damage (general)
- Lateral Damage (CPU mode)
 Optimized Code (function parameter reuse)
 Invalid Pointer (general)
- Invalid Pointer (objects)
 NULL Pointer (code)
 NULL Pointer (data)
 Inconsistent Dump
 Hidden Exception (user space)
- Hidden Exception (kernel space)
- Hidden Exception (managed space)
 Deadlock (critical sections)
 Deadlock (executive resources)
 Deadlock (mixed objects, user space)
 Deadlock (LPC)
 Deadlock (mixed objects, kernel space)
 Deadlock (self)
- Deadlock (managed space)
- Deadlock (.NET Finalizer)
 Changed Environment
 Incorrect Stack Trace
 OMAP Code Optimization
 No Component Symbols
 Insufficient Memory (committed memory)
 Insufficient Memory (handle leak)
 Insufficient Memory (kernel pool)
 Insufficient Memory (PTE)
 Insufficient Memory (module fragmentation)
 Insufficient Memory (physical memory)
 Insufficient Memory (control blocks)
- Insufficient Memory (reserved virtual memory)
- Insufficient Memory (session pool)
- Insufficient Memory (stack trace database)
- Insufficient Memory (region)
- Insufficient Memory (stack)
 Spiking Thread
 Module Variety
 Stack Overflow (kernel mode)
 Stack Overflow (user mode)
 Stack Overflow (software implementation)
- Stack Overflow (insufficient memory)
- Stack Overflow (managed space)
 Managed Code Exception
- Managed Code Exception (Scala)
- Managed Code Exception (Python)
 Truncated Dump
 Waiting Thread Time (kernel dumps)
 Waiting Thread Time (user dumps)
 Memory Leak (process heap) - Modeling Example
 Memory Leak (.NET heap)
- Memory Leak (page tables)
- Memory Leak (I/O completion packets)
- Memory Leak (regions)
 Missing Thread (user space)
- Missing Thread (kernel space)
 Unknown Component
 Double Free (process heap)
 Double Free (kernel pool)
 Coincidental Symbolic Information
 Stack Trace
- Stack Trace (I/O request)
- Stack Trace (file system filters)
- Stack Trace (database)
- Stack Trace (I/O devices)
 Virtualized Process (WOW64)
- Virtualized Process (ARM64EC and CHPE)
 Stack Trace Collection (unmanaged space)
- Stack Trace Collection (managed space)
- Stack Trace Collection (predicate)
- Stack Trace Collection (I/O requests)
- Stack Trace Collection (CPUs)
 Coupled Processes (strong)
 Coupled Processes (weak)
 Coupled Processes (semantics)
 High Contention (executive resources)
 High Contention (critical sections)
 High Contention (processors)
- High Contention (.NET CLR monitors)
- High Contention (.NET heap)
- High Contention (sockets)
 Accidental Lock
 Passive Thread (user space)
 Passive System Thread (kernel space)
 Main Thread
 Busy System
 Historical Information
 Object Distribution Anomaly (IRP)
- Object Distribution Anomaly (.NET heap)
 Local Buffer Overflow (user space)
- Local Buffer Overflow (kernel space)
 Early Crash Dump
 Hooked Functions (user space)
 Hooked Functions (kernel space)
- Hooked Modules
 Custom Exception Handler (user space)
 Custom Exception Handler (kernel space)
 Special Stack Trace
 Manual Dump (kernel)
 Manual Dump (process)
 Wait Chain (general)
 Wait Chain (critical sections)
 Wait Chain (executive resources)
 Wait Chain (thread objects)
 Wait Chain (LPC/ALPC)
 Wait Chain (process objects)
 Wait Chain (RPC)
 Wait Chain (window messaging)
 Wait Chain (named pipes)
- Wait Chain (mutex objects)
- Wait Chain (pushlocks)
- Wait Chain (CLR monitors)
- Wait Chain (RTL_RESOURCE)
- Wait Chain (modules)
- Wait Chain (nonstandard synchronization)
- Wait Chain (C++11, condition variable)
- Wait Chain (SRW lock)
 Corrupt Dump
 Dispatch Level Spin
 No Process Dumps
 No System Dumps
 Suspended Thread
 Special Process
 Frame Pointer Omission
 False Function Parameters
 Message Box
 Self-Dump
 Blocked Thread (software)
 Blocked Thread (hardware)
- Blocked Thread (timeout)
 Zombie Processes
 Wild Pointer
 Wild Code
 Hardware Error
 Handle Limit (GDI, kernel space)
- Handle Limit (GDI, user space)
 Missing Component (general)
 Missing Component (static linking, user mode)
 Execution Residue (unmanaged space, user)
- Execution Residue (unmanaged space, kernel)
- Execution Residue (managed space)
 Optimized VM Layout
- Invalid Handle (general)
- Invalid Handle (managed space)
- Overaged System
- Thread Starvation (realtime priority)
- Thread Starvation (normal priority)
- Duplicated Module
- Not My Version (software)
- Not My Version (hardware)
- Data Contents Locality
- Nested Exceptions (unmanaged code)
- Nested Exceptions (managed code)
- Affine Thread
- Self-Diagnosis (user mode)
- Self-Diagnosis (kernel mode)
- Self-Diagnosis (registry)
- Inline Function Optimization (unmanaged code)
- Inline Function Optimization (managed code)
- Critical Section Corruption
- Lost Opportunity
- Young System
- Last Error Collection
- Hidden Module
- Data Alignment (page boundary)
- C++ Exception
- Divide by Zero (user mode)
- Divide by Zero (kernel mode)
- Swarm of Shared Locks
- Process Factory
- Paged Out Data
- Semantic Split
- Pass Through Function
- JIT Code (.NET)
- JIT Code (Java)
- Ubiquitous Component (user space)
- Ubiquitous Component (kernel space)
- Nested Offender
- Virtualized System
- Effect Component
- Well-Tested Function
- Mixed Exception
- Random Object
- Missing Process
- Platform-Specific Debugger
- Value Deviation (stack trace)
- Value Deviation (structure field)
- Runtime Thread (CLR)
- Runtime Thread (Python, Linux)
- Coincidental Frames
- Fault Context
- Hardware Activity
- Incorrect Symbolic Information
- Message Hooks - Modeling Example
- Coupled Machines
- Abridged Dump
- Exception Stack Trace
- Distributed Spike
- Instrumentation Information
- Template Module
- Invalid Exception Information
- Shared Buffer Overwrite
- Pervasive System
- Problem Exception Handler
- Same Vendor
- Crash Signature
- Blocked Queue (LPC/ALPC)
- Fat Process Dump
- Invalid Parameter (process heap)
- Invalid Parameter (runtime function)
- String Parameter
- Well-Tested Module
- Embedded Comment
- Hooking Level
- Blocking Module
- Dual Stack Trace
- Environment Hint
- Top Module
- Livelock
- Technology-Specific Subtrace (COM interface invocation)
- Technology-Specific Subtrace (dynamic memory)
- Technology-Specific Subtrace (JIT .NET code)
- Technology-Specific Subtrace (COM client call)
- Dialog Box
- Instrumentation Side Effect
- Semantic Structure (PID.TID)
- Directing Module
- Least Common Frame
- Truncated Stack Trace
- Data Correlation (function parameters)
- Data Correlation (CPU times)
- Module Hint
- Version-Specific Extension
- Cloud Environment
- No Data Types
- Managed Stack Trace
- Managed Stack Trace (Scala)
- Managed Stack Trace (Python)
- Coupled Modules
- Thread Age
- Unsynchronized Dumps
- Pleiades
- Quiet Dump
- Blocking File
- Problem Vocabulary
- Activation Context
- Stack Trace Set
- Double IRP Completion
- Caller-n-Callee
- Annotated Disassembly (JIT .NET code)
- Annotated Disassembly (unmanaged code)
- Handled Exception (user space)
- Handled Exception (.NET CLR)
- Handled Exception (kernel space)
- Duplicate Extension
- Special Thread (.NET CLR)
- Hidden Parameter
- FPU Exception
- Module Variable
- System Object
- Value References
- Debugger Bug
- Empty Stack Trace
- Problem Module
- Disconnected Network Adapter
- Network Packet Buildup
- Unrecognizable Symbolic Information
- Translated Exception
- Regular Data
- Late Crash Dump
- Blocked DPC
- Coincidental Error Code
- Punctuated Memory Leak
- No Current Thread
- Value Adding Process
- Activity Resonance
- Stored Exception
- Spike Interval
- Stack Trace Change
- Unloaded Module
- Deviant Module
- Paratext
- Incomplete Session
- Error Reporting Fault
- First Fault Stack Trace
- Frozen Process
- Disk Packet Buildup
- Hidden Process
- Active Thread (Mac OS X)
- Active Thread (Windows)
- Critical Stack Trace
- Handle Leak
- Module Collection
- Module Collection (predicate)
- Deviant Token
- Step Dumps
- Broken Link
- Debugger Omission
- Glued Stack Trace
- Reduced Symbolic Information
- Injected Symbols
- Distributed Wait Chain
- One-Thread Process
- Module Product Process
- Crash Signature Invariant
- Small Value
- Shared Structure
- Thread Cluster
- False Effective Address
- Screwbolt Wait Chain
- Design Value
- Hidden IRP
- Tampered Dump
- Memory Fluctuation (process heap)
- Last Object
- Rough Stack Trace (unmanaged space)
- Rough Stack Trace (managed space)
- Past Stack Trace
- Ghost Thread
- Dry Weight
- Exception Module
- Reference Leak
- Origin Module
- Hidden Call
- Corrupt Structure
- Software Exception
- Crashed Process
- Variable Subtrace
- User Space Evidence
- Internal Stack Trace
- Distributed Exception (managed code)
- Thread Poset
- Stack Trace Surface
- Hidden Stack Trace
- Evental Dumps
- Clone Dump
- Parameter Flow
- Critical Region
- Diachronic Module
- Constant Subtrace
- Not My Thread
- Window Hint
- Place Trace
- Stack Trace Signature
- Relative Memory Leak
- Quotient Stack Trace
- Module Stack Trace
- Foreign Module Frame
- Unified Stack Trace
- Mirror Dump Set
- Memory Fibration
- Aggregated Frames
- Frame Regularity
- Stack Trace Motif
- System Call
- Stack Trace Race
- Hyperdump
- Disassembly Ambiguity
- Exception Reporting Thread
- Active Space
- Subsystem Modules
- Region Profile
- Region Clusters
- Source Stack Trace
- Hidden Stack
- Interrupt Stack
- False Memory
- Frame Trace
- Pointer Cone
- Context Pointer
- Pointer Class
- False Frame
- Procedure Call Chain
- C++ Object
- COM Exception
- Structure Sheaf
- Saved Exception Context (.NET)
- Shared Thread
- Spiking Interrupts
- Structure Field Collection
- Black Box
- Rough Stack Trace Collection (unmanaged space)
- COM Object
- Shared Page
- Exception Collection
- Dereference Nearpoint
- Address Representations
- Near Exception
- Shadow Stack Trace
- Past Process
- Foreign Stack
- Annotated Stack Trace
- Disassembly Summary
- Region Summary
- Analysis Summary
- Region Spectrum
- Normalized Region
- Function Pointer
- Interrupt Stack Collection
- DPC Stack Collection
- Dump Context
- False Local Address
- Encoded Pointer
- Latent Structure
- ISA-Specific Code
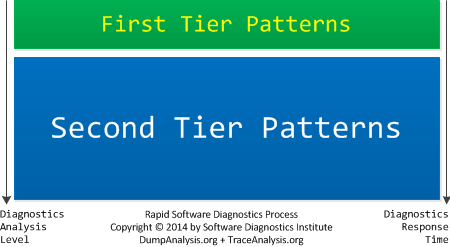
Rapid Software Diagnostics Process (RSDP)
Increased complexity of software incidents and their growing numbers require fast responses. We reviewed and partitioned our pattern catalogues into two tiers. The first tier requires less analysis efforts and provides faster response time than the second tier. The revised memory and trace analysis catalogues together with adjusted checklists will be published soon.
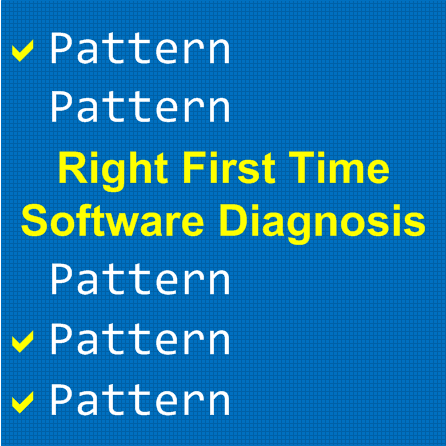
Right First Time Software Diagnosis
Right First Time Software Diagnostics is based on pattern-oriented diagnostics process and pattern catalogues.
Book: Advanced Windows RT Memory Dump Analysis, ARM Edition
The following direct links can be used to order the print version:
Buy Paperback from Amazon
Buy Paperback from Barnes & Noble
Buy Paperback from Book Depository
The full transcript of Software Diagnostics Services training with 9 step-by-step exercises. Learn how to navigate through memory dump space and Windows data structures to perform memory forensics, troubleshoot and debug complex software incidents. The training uses a unique and innovative pattern-driven analysis approach to speed up the learning curve. It consists of practical step-by-step exercises using WinDbg to diagnose structural and behavioural patterns in Windows RT kernel and complete (physical) memory dumps. Additional topics include memory search, kernel linked list navigation, practical WinDbg scripting, registry, system variables and objects, device drivers and I/O, memory mapped and cached files content.
Prerequisites: Basic and intermediate level Windows memory dump analysis: ability to list processors, processes, threads, modules, apply symbols, and walk through stack traces.
Audience: Software developers, software technical support and escalation engineers, reverse and security research engineers, digital forensic analysts.
- Title: Advanced Windows RT Memory Dump Analysis, ARM Edition: Training Course Transcript and WinDbg Practice Exercises
- Authors: Dmitry Vostokov, Software Diagnostics Services
- Publisher: OpenTask (March 2014)
- Language: English
- Product Dimensions: 28.0 x 21.6
- Paperback: 190 pages
- ISBN-13: 978-1908043733
Accelerated Mac OS X Core Dump Analysis: LLDB Exercises
Warning! Contains only exercises for LLDB debugger.
The following direct links can be used to order the print version:
Buy Paperback from Amazon
Buy Paperback from Barnes & Noble
Buy Paperback from Book Depository
This is an update for Accelerated Mac OS X Core Dump Analysis: Training Course Transcript and GDB Practice Exercises (ISBN: 978-1908043405) book. In Mac OS X Mavericks GDB was replaced by LLDB debugger. All GDB exercises were reworked and updated for LLDB. The original first edition also contains slide transcripts and selected memory analysis pattern descriptions which are missing in this update. This update contains only LLDB exercises. If you don't have the first edition of this course then Accelerated Mac OS X Core Dump Analysis, Second Edition: Training Course Transcript with GDB and LLDB Practice Exercises (ISBN: 978-1908043719) is recommended instead of this update.
- Title: Accelerated Mac OS X Core Dump Analysis: LLDB Exercises
- Authors: Dmitry Vostokov, Software Diagnostics Services
- Publisher: OpenTask (March 2014)
- Language: English
- Product Dimensions: 28.0 x 21.6
- Paperback: 146 pages
- ISBN-13: 978-1908043726
Table of Contents
Review
Amazon Reviews for the previous GDB edition
Detecting and Predicting the Unknown
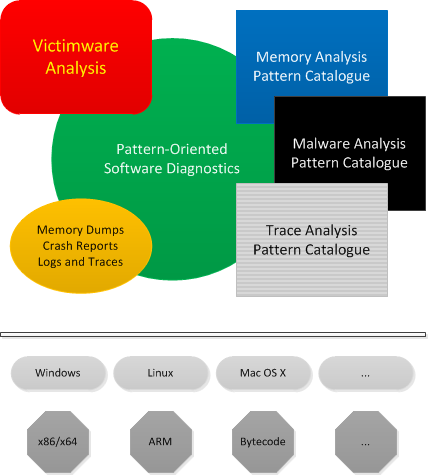
A. The approach of Victimware1 (which includes abnormal behaviour of Malware such as crashes, hangs, resource leaks, CPU spikes) together with memory, malware, and log analysis pattern catalogues allows to detect unknown malware in software diagnostics and digital forensics artefacts such as memory dumps, crash reports, and software traces and logs: pattern-driven software diagnostics2 and forensics4.
B. Structural and behavioural patterns found on one operating system and/or processor architecture can be predicted for another: pattern-based software diagnostics3 and forensics4.
References:
1 http://www.dumpanalysis.org/victimware-book
2 http://www.dumpanalysis.org/introduction-pattern-driven-diagnostics
3 http://www.dumpanalysis.org/introduction-pattern-based-software-diagnost...
4 http://www.dumpanalysis.org/pattern-oriented-memory-forensics
Pattern-Oriented Software Forensics
The following direct links can be used to order the book now:
Buy Kindle version
Buy Paperback from Amazon
Buy Paperback from Barnes & Noble
Buy Paperback from Book Depository
This is a transcript of Software Diagnostics Services seminar about a comprehensive theory behind software forensics based on systemic and pattern-oriented software diagnostics developed by Software Diagnostics Institute. It synthesises pattern-oriented memory analysis of malware and victimware with pattern-oriented software log and trace analysis based on software narratology.
- Title: Pattern-Oriented Software Forensics: A Foundation of Memory Forensics and Forensics of Things
- Author: Dmitry Vostokov, Software Diagnostics Services
- Publisher: OpenTask (February 2014)
- Language: English
- Product Dimensions: 28.0 x 21.6
- Paperback: 44 pages
- ISBN-13: 978-1908043696
Patterns of Software Diagnostics Architecture
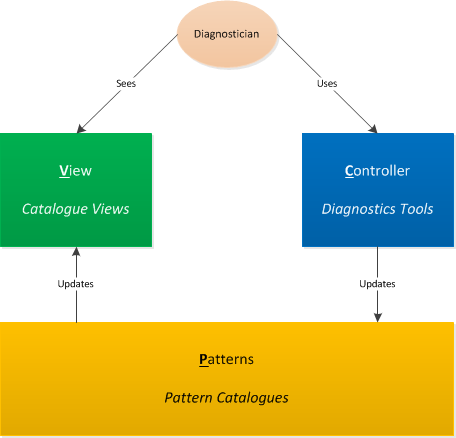
In the Debugging TV episode 0x1A we introduced a vision of software diagnostics architecture and its architectural patterns. The latter are usual patterns of software architecture if we design software diagnostics software. However, if we consider a software diagnostics system architecture in a wider context involving its users and human-assisted pattern-orientation there is a need to devise new patterns such as Patterns - View - Controller (PVC) where:
- Patterns - represent pattern catalogues from pattern-driven and pattern-based software diagnostics methodology. It corresponds to Model in traditional Model - View - Controller software architecture pattern.
- View - represents pattern catalogue(s) view which might include concrete pattern implementations such as OS and product specifics. A view can also be based on an intersection of several pattern catalogues, for example, memory analysis, malware analysis, and trace analysis. A user diagnostician sees such views. Any updates to underlying pattern catalogues are reflected in pattern views.
- Controller - represents software diagnostics tools architecture and designed using software construction patterns. Such tools may include automated diagnostics or human-assisted debuggers and problem analysis tools. A user diagnostician uses such controllers. Such use may result in updates to underlying pattern catalogues when a new pattern is discovered, for example.
This software diagnostics architecture pattern is illustrated on the following diagram:
Trace Acquisition Pattern Catalogue
In addition to existing pattern catalogues such as for trace analysis we introduce patterns of trace acquisition as general platform and product independent reusable solutions to commonly occurring tracing and logging problems applicable in specific contexts. Here's the current list applicable to both software and network tracing:
- Trace Placing Map
- Trace Timing Plan
- Use Case Coverage
- Supplemental System Tracing
- Supplemental Network Tracing
- Supplemental Memory Acquisition
- Full Capture Tracing
- Tuned Capture Tracing
- First Occurrence Tracing
- Differential Strategy Tracing
Software Diagnostics Services is updating its Accelerated Software Trace Analysis training with complete pattern descriptions, examples and pattern-oriented trace acquisition requirements, design and implementation labs. The initial list of trace acquisition patterns may be revised and extended if necessary.
Memory Acquisition Pattern Catalogue
Software: the parts of a computer that can be dumped.
In addition to existing pattern catalogues such as for memory analysis we introduce patterns of memory acquisition as general platform and product independent reusable solutions to commonly occurring memory acquisition problems applicable in specific contexts. Here's the current list with their classification:
Structural Space Patterns
General
- State Summary Dump
- Region Memory Dump
Volatile
- Process Memory Dump
- Kernel memory Dump
- Physical Memory Dump
- Hyper Memory Dump
- Fibre Bundle Dump
Persistent
- File Memory Dump
- Storage Memory Dump
Acquisition Strategy Patterns
- External Dump
- Self Dump
- Conditional Dump
- Dump Sequence
- Transactional Dump
Software Diagnostics Services is developing Accelerated Memory Acquisition training with complete pattern descriptions, examples and pattern-oriented memory acquisition requirements, design and implementation labs. The initial list of memory acquisition patterns may be revised and extended if necessary.
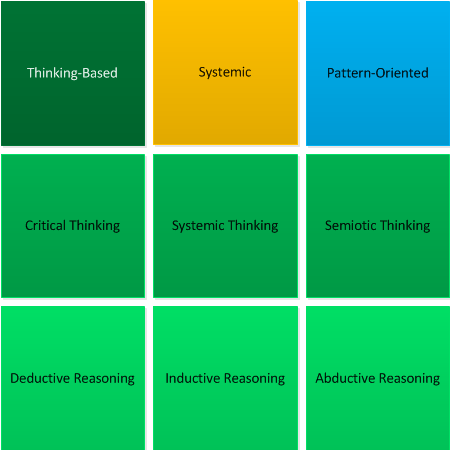
Thinking-Based Software Diagnostics
As The Year of Software Diagnostics is almost finished we unveil a new type of software diagnostics in addition to pattern-oriented and systemic.
It is based on:
- Critical thinking
- Systemic thinking
- Semiotic thinking
and uses:
- Inductive reasoning
- Deductive reasoning
- Abductive reasoning
Introducing Software Narratology of Things (Software NT)
This is the further development of Software Narratology (T -> M) and Generalized Software Narratives (M -> M -> M -> ...). Now it incorporates devices (things) and IoT. Whereas the general narrative space is 2M1T:
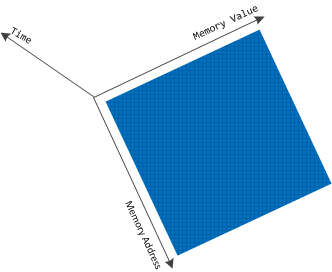
the narrative space of NT is "complex" 2M2T:
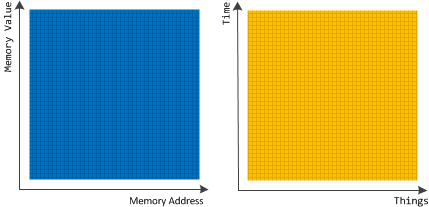
Narratology of Things also incorporates Hardware Narratology.
ADDR Pattern Catalogue
In addition to existing pattern catalogues we introduce patterns (and their schemas) of disassembly (decompilation), reversing and reconstruction (deconstruction). Here's the current list in the order of their appearance in Accelerated Disassembly, Reconstruction and Reversing training:
- Universal Pointer
- Symbolic Pointer S2
- Interpreted Pointer S3
- Context Pyramid
- Potential Functionality
- Function Skeleton
- Function Call
- Call Path
- Local Variable
- Static Variable
- Pointer Dereference
- Function Prologue
- Function Epilogue
- Variable Initialization
- Memory Copy
- Call Prologue
- Call Parameter
- Call Epilogue
- Call Result
- Control Path
- Function Parameter
- Structure Field
- Last Call
- Loop
- Separator Frames
- Virtual Call
- Component Dependencies
- API Trace
The Old New Crash: Cloud Memory Dump Analysis
The following direct links can be used to order the book now:
Buy Kindle or Paperback
 from Amazon
Buy Paperback from Barnes & Noble
Buy Paperback from Book Depository
Available for SkillSoft Books24x7 subscribers
![]()
This is a transcript of Software Diagnostics Services (former Memory Dump Analysis Services) seminar about a uniform methodology and tools for analysis of crashes, hangs, and other types of abnormal software behaviour in cloud environments.
- Title: The Old New Crash: Cloud Memory Dump Analysis
- Authors: Dmitry Vostokov, Software Diagnostics Services
- Publisher: OpenTask (August 2011)
- Language: English
- Product Dimensions: 28.0 x 21.6
- Paperback: 40 pages
- ISBN-13: 978-1908043283
An Introduction to Mobile Software Diagnostics
The following direct links can be used to order the book now:
Buy Kindle version
Buy Paperback from Amazon
Buy Paperback from Barnes & Noble
Buy Paperback from Book Depository
This is a transcript of Software Diagnostics Services seminar about the perspectives of pattern-oriented software diagnostics in mobile world with examples for Android and Java.
- Title: Mobile Software Diagnostics: An Introduction
- Authors: Dmitry Vostokov, Software Diagnostics Services
- Publisher: OpenTask (September 2013)
- Language: English
- Product Dimensions: 28.0 x 21.6
- Paperback: 28 pages
- ISBN-13: 978-1908043658
Pattern-Oriented Network Trace Analysis
The following direct links can be used to order the book now:
Buy Kindle version
Buy Paperback from Amazon
Software Narratology found its successful application in software diagnostics of abnormal software behaviour in software logs. This is a transcript of Software Diagnostics Services seminar on the new application of software narratology to network trace analysis with examples from Wireshark.
- Title: Pattern-Oriented Network Trace Analysis
- Authors: Dmitry Vostokov, Software Diagnostics Services
- Publisher: OpenTask (September 2013)
- Language: English
- Product Dimensions: 28.0 x 21.6
- Paperback: 52 pages
- ISBN-13: 978-1908043580
Introduction to Philosophy of Software Diagnostics, Part 1
The following direct links can be used to order the book now:
Buy Kindle version
Buy Paperback from Amazon
Buy Paperback from Barnes & Noble
Buy Paperback from Book Depository
This is a transcript of Software Diagnostics Services seminar about phenomenological, hermeneutical and analytical approaches to software diagnostics.
- Title: Philosophy of Software Diagnostics: An Introduction, Part 1
- Authors: Dmitry Vostokov, Software Diagnostics Services
- Publisher: OpenTask (September 2013)
- Language: English
- Product Dimensions: 28.0 x 21.6
- Paperback: 36 pages
- ISBN-13: 978-1908043571
Victimware: The Missing Part of the Equation
The following direct links can be used to order the book now:
Buy Kindle or Paperback
 from Amazon
Buy Paperback from Barnes & Noble
Buy Paperback from Book Depository
Available for SkillSoft Books24x7 subscribers
![]()
Some software components are innocent victims of other component coding mistakes or deliberate subversion and some start as a part of crimeware and malware but eventually become victims themselves (they crash, hang, spike, leak, are dumped, subverted, etc.) This is a transcript of Software Diagnostics Services seminar about unified malware and victimware analysis by using behavioural and structural patterns including a live memory dump analysis example.
- Title: Victimware: The Missing Part of the Equation
- Authors: Dmitry Vostokov, Software Diagnostics Services
- Publisher: OpenTask (August 2013)
- Language: English
- Product Dimensions: 28.0 x 21.6
- Paperback: 28 pages
- ISBN-13: 978-1908043634
Introduction to Pattern-Based Software Diagnostics
The following direct links can be used to order the book now:
Buy Kindle version
Buy Paperback from Amazon
Buy Paperback from Barnes & Noble
Buy Paperback from Book Depository
Available for SkillSoft Books24x7 subscribers
![]()
This is a transcript of Software Diagnostics Services seminar about how pattern-based software diagnostics, troubleshooting and debugging address software post-construction problem solving pattern life cycle: from the discovery of a new pattern through its integration into an existing pattern catalogue and pattern language, testing, packaging and delivering to pattern consumers with subsequent usage, refactoring and writing case studies.
- Title: Pattern-Based Software Diagnostics: An Introduction
- Authors: Dmitry Vostokov, Software Diagnostics Services
- Publisher: OpenTask (August 2013)
- Language: English
- Product Dimensions: 28.0 x 21.6
- Paperback: 28 pages
- ISBN-13: 978-1908043498
Agile Software Diagnostics
We introduce this method based on iterative and incremental pattern-oriented diagnostics we founded and developed during the last few years. It is currently based on 5 principles:
- Patterns are the principal measure of quality
- Attention to detail through checklists
- Analysis is done by motivated expertise-driven trusted individuals
- Customer satisfaction by useful analysis delivered in the shortest possible time
- Analysis audit as a pair diagnostics
Debugging TV
Welcome to Debugging TV and Frames series where each episode features some facet of debugging, memory dump, and software trace analysis on Windows, Mac OS X, and Android platforms in 8 slides in 8 minutes including live WinDbg (Windows) or GDB demonstration (Mac OS X, Linux) plus extra 8 minutes for you to ask questions.

All episodes are available on YouTube with descriptions: http://www.youtube.com/DebuggingTV
Debugging TV Frame 0x01
Slides: DebuggingTV_Frame_0x01.pdf
WinDbg log: DebuggingTV_Frame_0x01.txt
Debugging TV Frame 0x02
Slides: DebuggingTV_Frame_0x02.pdf
From Q&A session: DIA SDK to access PDB symbol files
Debugging TV Frame 0x03
Slides: DebuggingTV_Frame_0x03.pdf
WinDbg log: DebuggingTV_Frame_0x03.txt
Debugging TV Frame 0x04
Slides: DebuggingTV_Frame_0x04.pdf
WinDbg log: DebuggingTV_Frame_0x04.txt
Note on Q&A: There was a question about the difference between .symopt-4 and .reload /f and indeed for the exercise purpose there was no difference. However I understood the question incorrectly and when I mentioned about forcing mismatched symbols load I meant .reload /f /i that we covered in the previous Frame Episode 0x02.
Debugging TV Frame 0x05
Slides: DebuggingTV_Frame_0x05.pdf
WinDbg log: DebuggingTV_Frame_0x05.txt
Debugging TV Frame 0x06
Slides: DebuggingTV_Frame_0x06.pdf
WinDbg log: DebuggingTV_Frame_0x06.txt
Debugging TV Frame 0x07
Slides: DebuggingTV_Frame_0x07.pdf
WinDbg log: DebuggingTV_Frame_0x07.txt
Debugging TV Frame 0x08
Slides: DebuggingTV_Frame_0x08.pdf
WinDbg log: DebuggingTV_Frame_0x08.txt
API description: contexts.h
Debugging TV Frame 0x09
Slides: DebuggingTV_Frame_0x09.pdf
WinDbg log 1: DebuggingTV_Frame_0x09-1.txt
WinDbg log 2: DebuggingTV_Frame_0x09-2.txt
Debugging TV Frame 0x0A (Mac OS X)
Slides: DebuggingTV_Frame_0x0A.pdf
Debugging TV Frame 0x0B (Mac OS X)
Slides: DebuggingTV_Frame_0x0B.pdf
Debugging TV Frame 0x0C (Mac OS X)
Crash report: MultipleThreads_2012-04-06-092234_DumpAnalysis-MacBook-Air.crash
Slides: DebuggingTV_Frame_0x0C.pdf
Debugging TV Frame 0x0D (Mac OS X)
Crash report: SpikingThread_2012-05-04-174941_DumpAnalysis-MacBook-Air.crash
Slides: DebuggingTV_Frame_0x0D.pdf
Debugging TV Frame 0x0E (Mac OS X)
Crash report: HeapCorruption2_2012-05-24-111258_DumpAnalysis-MacBook-Air.crash
Crash report: DoubleFree_2012-05-24-130929_DumpAnalysis-MacBook-Air.crash
Slides: DebuggingTV_Frame_0x0E.pdf
Debugging TV Frame 0x0F (Mac OS X)
Slides: DebuggingTV_Frame_0x0F.pdf
Debugging TV Frame 0x10 (General Software Diagnostics)
Slides: DebuggingTV_Frame_0x10.pdf
Debugging TV Frame 0x11 (Windows, Mac OS X)
Slides: DebuggingTV_Frame_0x11.pdf
Debugging TV Frame 0x12 (Mac OS X)
Slides: DebuggingTV_Frame_0x12.pdf
Debugging TV Frame 0x13 (Mac OS X)
Slides: DebuggingTV_Frame_0x13.pdf
Debugging TV Frame 0x14 (Windows)
Slides: DebuggingTV_Frame_0x14.pdf
Debugging TV Frame 0x15 (Windows)
Slides: DebuggingTV_Frame_0x15.pdf
MessageHistory x86 log: messages32.txt
MessageHistory x64 log: messages64.txt
Debugging TV Frame 0x16 (Windows)
Slides: DebuggingTV_Frame_0x16.pdf
WinDbg log (process dump): windbg-old-hangs-on-windows8-dump.txt
WinDbg log (complete dump): memory-windows8.txt
Debugging TV Frame 0x17 (Windows)
Slides: DebuggingTV_Frame_0x17.pdf
Debugging TV Frame 0x18 (Windows)
Slides: DebuggingTV_Frame_0x18.pdf
WinDbg log: logfile.txt
Source code: FrameNavigation.txt
Debugging TV Frame 0x19 (Windows)
Slides: DebuggingTV_Frame_0x19.pdf
Debugging TV Frame 0x1A (Software Diagnostics Architecture)
Slides: DebuggingTV_Frame_0x1A.pdf
Debugging TV Frame 0x1B (Windows)
Slides: DebuggingTV_Frame_0x1B.pdf
WinDbg log (iexplore memory dump analysis): iexplore-dump-analysis.txt
WinDbg log (iexplore live analysis): iexplore-live-analysis.txt
Debugging TV Frame 0x1C (Windows)
Slides: DebuggingTV_Frame_0x1C.pdf
WinDbg log: Episode-0x1C-1-no-lsass.txt
WinDbg log: Episode-0x1C-2-fibre-bundle-user-space.txt
WinDbg log: Episode-0x1C-3-fibre-bundle-kernel-space.txt
WinDbg log: Episode-0x1C-4-file-copy-spike-wrl-symbols.txt
Debugging TV Frame 0x20 (Windows)
Slides: DebuggingTV_Frame_0x20.pdf
WinDbg log: InjectionResidue.txt
Debugging TV Frame 0x21 (Windows)
Slides: DebuggingTV_Frame_0x21.pdf
Debugging TV Frame 0x22 (Windows)
Slides: DebuggingTV_Frame_0x22.pdf
Debugging TV Frame 0x23 (Windows)
Slides: DebuggingTV_Frame_0x23.pdf
Debugging TV Frame 0x24 (Windows)
Slides: DebuggingTV_Frame_0x24.pdf
Source code: PastStackTrace.txt
WinDbg log (x86): PastStackTrace32.txt
WinDbg log (x64): PastStackTrace64.txt
Debugging TV Frame 0x25 (Windows)
Slides: DebuggingTV_Frame_0x25.pdf
WinDbg log: Episode-0x25-windbg-log.txt
Debugging TV Frame 0x26 (Windows)
Slides: DebuggingTV_Frame_0x26.pdf
Source code: BufferUnderwrite.cpp
WinDbg log 1: NormalHeap.txt
WinDbg log 2: FullPageHeap.txt
WinDbg log 3: FullPageHeapBackwards.txt
Debugging TV Frame 0x27 (Windows)
Slides: DebuggingTV_Frame_0x27.pdf
WinDbg log: Episode-0x27-windbg-log.txt
Debugging TV Frame 0x28 (Windows)
Slides: DebuggingTV_Frame_0x28.pdf
WinDbg log: Episode-0x28-windbg-log.txt
Debugging TV Frame 0x29 (Windows)
Slides: DebuggingTV_Frame_0x29.pdf
WinDbg log: Episode-0x29-windbg-log.txt
Debugging TV Frame 0x30 (Windows)
Slides: DebuggingTV_Frame_0x30.pdf
Debugging TV Frame 0x31 (Windows)
Slides: DebuggingTV_Frame_0x31.pdf
WinDbg log: Episode-0x31-WinDbg-log.txt
Debugging TV Frame 0x32 (Android)
Slides: DebuggingTV_Frame_0x32.pdf
Java code: FullscreenActivityJava.txt
Android log (fragments): StackTraceCollectionLog.txt
Debugging TV Frame 0x33 (Android)
Slides: DebuggingTV_Frame_0x33.pdf
Java code for SpikingThread app: FullscreenActivitySpikingThreadJava.txt
Java code for Deadlock app: FullscreenActivityDeadlockJava.txt
Android log (fragments) for SpikingThread app: SpikingThreadLog.txt
Android log (fragments) for Deadlock app: DeadlockLog.txt
The output of top command (ADB): top.txt
The output of ps -t command (ADB): ps-t.txt
Debugging TV Frame 0x34 (Android)
Slides: DebuggingTV_Frame_0x34.pdf
More frames are coming and www.debugging.tv hosts TV programme and recordings of past episodes.
Introduction to Systemic Software Diagnostics
The following direct links can be used to order the book now:
Buy Kindle version
Buy Paperback from Amazon
Buy Paperback from Barnes & Noble
Buy Paperback from Book Depository
Available for SkillSoft Books24x7 subscribers
![]()
This is a transcript of Software Diagnostics Services seminar about how to apply systems theory and systems thinking for effective and efficient abnormal software behaviour diagnostics: the foundation of software troubleshooting and debugging.
- Title: Systemic Software Diagnostics: An Introduction
- Authors: Dmitry Vostokov, Software Diagnostics Services
- Publisher: OpenTask (July 2013)
- Language: English
- Product Dimensions: 28.0 x 21.6
- Paperback: 32 pages
- ISBN-13: 978-1908043399
The Structure of Software Problem Solving Organization
Based on the separation of problem solving powers we propose the following software problem solving triangle with a separate software diagnostics department:
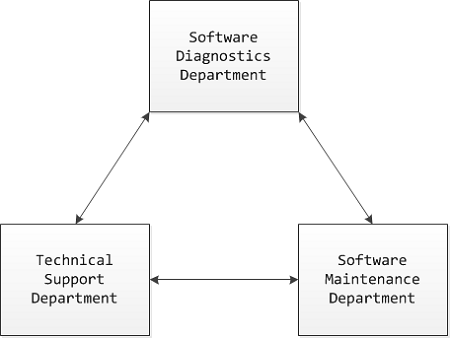
In the forthcoming Webinar we outline the benefits of this approach.
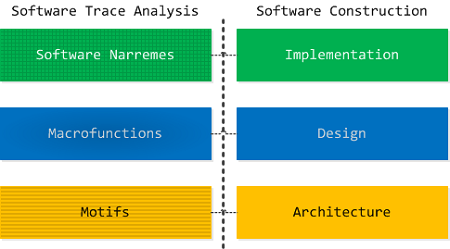
Bridging The Great Divide
In Pattern-Based Software Diagnostics seminar we proposed to use pattern catalogues to bridge the separation of software construction and memory dump software diagnostics. With an introduction of Motifs to trace and log analysis pattern catalogue it is now possible (at least conceptually) to bridge construction and trace analysis too:
Elementary Software Diagnostics Patterns
These are patterns of abnormal software behaviour that affect software users and trigger the application of pattern-oriented software diagnostics and debugging if necessary. The initial list of relevant elementary patterns include:
- Functional
- Use-case Deviation
- Non-functional
- Crash
- Hang (includes delays*)
- Counter Value (includes resource leaks, CPU spikes)
- Error Message
* In choosing the pattern vocabulary we decided to use ordinary names, for example, Hang was chosen instead of Response Delay.
Windows Memory Analysis Checklist
General:
- Symbol servers (.symfix)
- Internal database(s) search
- Google or Microsoft search for suspected components as this could be a known issue. Sometimes a simple search immediately points to the fix on a vendor’s site
- The tool used to save a dump (to flag false positive, incomplete or inconsistent dumps)
- OS/SP version (version)
- Language
- Debug time
- System uptime
- Computer name (dS srv!srvcomputername or !envvar COMPUTERNAME)
- List of loaded and unloaded modules (lmv or !dlls)
- Hardware configuration (!sysinfo)
- .kframes 1000
Application or service:
- Default analysis (!analyze -v or !analyze -v -hang for hangs)
- Critical sections (!cs -s -l -o, !locks) for both crashes and hangs
- Component timestamps, duplication and paths. DLL Hell? (lmv and !dlls)
- Do any newer components exist?
- Process threads (~*kv or !uniqstack) for multiple exceptions and blocking functions
- Process uptime
- Your components on the full raw stack of the problem thread
- Your components on the full raw stack of the main application thread
- Process size
- Number of threads
- Gflags value (!gflag)
- Time consumed by threads (!runaway)
- Environment (!peb)
- Import table (!dh)
- Hooked functions (!chkimg)
- Exception handlers (!exchain)
- Computer name (!envvar COMPUTERNAME)
- Process heap stats and validation (!heap -s, !heap -s -v)
- CLR threads? (mscorwks or clr modules on stack traces) Yes: use .NET checklist below
- Hidden (unhandled and handled) exceptions on thread raw stacks
System hang:
- Default analysis (!analyze -v -hang)
- ERESOURCE contention (!locks)
- Processes and virtual memory including session space (!vm 4)
- Important services are present and not hanging
- Pools (!poolused)
- Waiting threads (!stacks)
- Critical system queues (!exqueue f)
- I/O (!irpfind)
- The list of all thread stack traces (!process 0 3f)
- LPC/ALPC chain for suspected threads (!lpc message or !alpc /m after search for "Waiting for reply to LPC" or "Waiting for reply to ALPC" in !process 0 3f output)
- RPC threads (search for "RPCRT4!OSF" in !process 0 3f output)
- Mutants (search for "Mutant - owning thread" in !process 0 3f output)
- Critical sections for suspected processes (!cs -l -o -s)
- Sessions, session processes (!session, !sprocess)
- Processes (size, handle table size) (!process 0 0)
- Running threads (!running)
- Ready threads (!ready)
- DPC queues (!dpcs)
- The list of APCs (!apc)
- Internal queued spinlocks (!qlocks)
- Computer name (dS srv!srvcomputername)
- File cache, VACB (!filecache)
- File objects for blocked thread IRPs (!irp -> !fileobj)
- Network (!ndiskd.miniports and !ndiskd.pktpools)
- Disk (!scsikd.classext -> !scsikd.classext class_device 2)
- Modules rdbss, mrxdav, mup, mrxsmb in stack traces
- Functions Ntfs!Ntfs*, nt!Fs* and fltmgr!Flt* in stack traces
BSOD:
- Default analysis (!analyze -v)
- Pool address (!pool)
- Component timestamps (lmv)
- Processes and virtual memory (!vm 4)
- Current threads on other processors
- Raw stack
- Bugcheck description (including ln exception address for corrupt or truncated dumps)
- Bugcheck callback data (!bugdump for systems prior to Windows XP SP1)
- Bugcheck secondary callback data (.enumtag)
- Computer name (dS srv!srvcomputername)
- Hardware configuration (!sysinfo)
.NET application or service:
- CLR module and SOS extension versions (lmv and .chain)
- Managed exceptions (~*e !pe)
- Nested managed exceptions (!pe -nested)
- Managed threads (!Threads -special)
- Managed stack traces (~*e !CLRStack)
- Managed execution residue (~*e !DumpStackObjects and !DumpRuntimeTypes)
- Managed heap (!VerifyHeap, !DumpHeap -stat and !eeheap -gc)
- GC handles (!GCHandles, !GCHandleLeaks)
- Finalizer queue (!FinalizeQueue)
- Sync blocks (!syncblk)
Introduction to Pattern-Driven Software Diagnostics
The following direct links can be used to order the book now:
Buy Kindle or Paperback
 from Amazon
Buy Paperback from Barnes & Noble
Buy Paperback from Book Depository
This is a transcript of Software Diagnostics Services seminar about different pattern categories for effective and efficient abnormal software behaviour diagnostics: the foundation of scalable and cost-effective pattern-driven software support.
- Title: Pattern-Driven Software Diagnostics: An Introduction
- Authors: Dmitry Vostokov, Software Diagnostics Services
- Publisher: OpenTask (April 2013)
- Language: English
- Product Dimensions: 28.0 x 21.6
- Paperback: 32 pages
- ISBN-13: 978-1908043382
Unified Computer Diagnostics: Incorporating Hardware Narratology
Interpreting hardware signals as messages and messages as signals allows us to apply Software Narratology and software trace analysis patterns to the domain of hardware diagnostics:
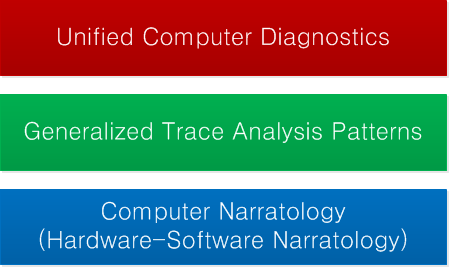
Generalized trace analysis patterns and narrative extends the view of hardware-software traces and logs as temporarily ordered event sequences. The time domain is generalized to any arbitrary set such as a list of indexes or pointers or even memory itself. This gives a unification of memory and log analysis and application of Computer Narratology (*) to memory dump analysis as well.
(*) We call the application of methods of literary narratology to computer trace and log analysis and computer-related stories in general as Hardware-Software Narratology or simply Computer Narratology as it was originally done in Memory Dump Analysis Anthology, Volume 3 when we first introduced Software Narratology.
Zero Fault Software Diagnostics
Software diagnostics is used whenever there is a fault that triggers some kind of an artefact such as a memory dump or a software trace. It is also used proactively in software and network monitoring. We combine all these uses with our pattern-oriented approach to anticipate faults before their occurrence:
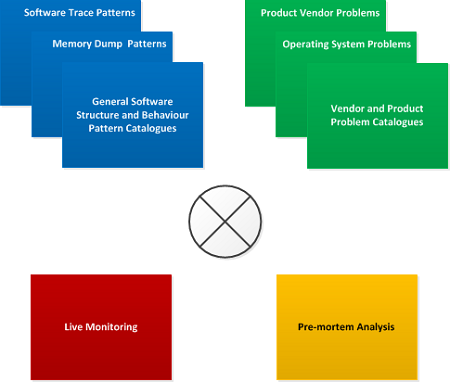
Such preventive software diagnostics consists from 4 interrelated parts:
- General software structure and behaviour pattern catalogues
- Domain, vendor and product specific problem catalogues
- Live monitoring
- Pre-mortem analysis
Pre-mortem here means preventive memory dump analysis. It is similar to post-mortem analysis but artefacts are collected and analysed proactively before any actual problem. In some sense pre-mortem analysis is a part of live monitoring but we confine the latter to software trace and log analysis.
Memory Dump Analysis Anthology, Volume 6
The following direct links can be used to order the book now:
Buy Kindle version
Buy Paperback or Hardcover
 from Amazon
Buy Paperback or Hardcover from Barnes & Noble
Buy Paperback or Hardcover from Book Depository
Also available in PDF format from Software Diagnostics Services
Contains revised, edited, cross-referenced, and thematically organized selected DumpAnalysis.org blog posts about memory dump and software trace analysis, software troubleshooting and debugging written in November 2010 - October 2011 for software engineers developing and maintaining products on Windows platforms, quality assurance engineers testing software on Windows platforms, technical support and escalation engineers dealing with complex software issues, and security researchers, malware analysts and reverse engineers. The sixth volume features:
- 56 new crash dump analysis patterns including 14 new .NET memory dump analysis patterns
- 4 new pattern interaction case studies
- 11 new trace analysis patterns
- New Debugware pattern
- Introduction to UI problem analysis patterns
- Introduction to intelligence analysis patterns
- Introduction to unified debugging pattern language
- Introduction to generative debugging, metadefect template library and DNA of software behavior
- The new school of debugging
- .NET memory dump analysis checklist
- Software trace analysis checklist
- Introduction to close and deconstructive readings of a software trace
- Memory dump analysis compass
- Computical and Stack Trace Art
- The abductive reasoning of Philip Marlowe
- Orbifold memory space and cloud computing
- Memory worldview
- Interpretation of cyberspace
- Relationship of memory dumps to religion
- Fully cross-referenced with Volume 1, Volume 2, Volume 3, Volume 4, and Volume 5
Product information:
- Title: Memory Dump Analysis Anthology, Volume 6
- Author: Dmitry Vostokov
- Language: English
- Product Dimensions: 22.86 x 15.24
- Paperback: 306 pages
- Publisher: Opentask (January 2013)
- ISBN-13: 978-1-908043-19-1
- Hardcover: 306 pages
- Publisher: Opentask (January 2013)
- ISBN-13: 978-1-908043-20-7

Back cover features 3d memory space visualization image created with ParaView.
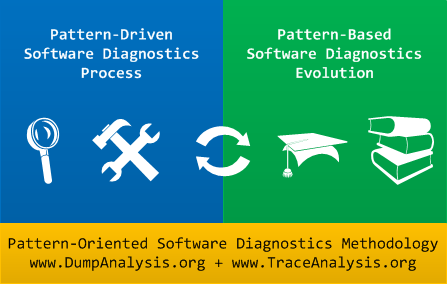
Pattern-Oriented Software Diagnostics
consists of two main parts:
- Pattern-Driven process of finding patterns from existing pattern catalogs
- Pattern-Based evolution of pattern catalogs and pattern relationships