Crash Dump Analysis Patterns (Part 152a)
If we don’t see exception codes from hidden exceptions when we inspect raw stack data we, nevertheless, in some cases might see execution residue left after calling exception handlers. For example, we can see that when we launch TestWER tool and select ‘Handled Exception’ checkbox:
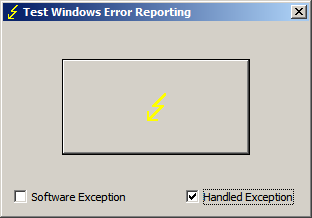
If we then click on a button and then save a process memory dump using Task Manager we find the following traces on a raw stack:
0:000> !teb

TEB at 7efdd000

ExceptionList:        0018fe20

StackBase:            00190000

StackLimit:           0018d000

SubSystemTib:         00000000

FiberData:            00001e00

ArbitraryUserPointer: 00000000

Self:                 7efdd000

EnvironmentPointer:   00000000

ClientId:             00000b38 . 00000f98

RpcHandle:            00000000

Tls Storage:          7efdd02c

PEB Address:          7efde000

LastErrorValue:       0

LastStatusValue:      c0000034

Count Owned Locks:    0

HardErrorMode:        0
0:000> dps 0018d000 00190000

[...]

0018f414  00000000

0018f418  0018f840

0018f41c  0018f4cc

0018f420  77726a9b ntdll!ExecuteHandler+0×24

0018f424  0018f4e4

0018f428  0018f840

0018f42c  0018f534

0018f430  0018f4b8

0018f434  00412600 TestWER!_except_handler4

0018f438  00000001

0018f43c  00000000

[…]
0:000> ub 77726a9b

ntdll!ExecuteHandler+0x7:

77726a7e 33f6            xor     esi,esi

77726a80 33ff            xor     edi,edi

77726a82 ff742420        push    dword ptr [esp+20h]

77726a86 ff742420        push    dword ptr [esp+20h]

77726a8a ff742420        push    dword ptr [esp+20h]

77726a8e ff742420        push    dword ptr [esp+20h]

77726a92 ff742420        push    dword ptr [esp+20h]

77726a96 e808000000      call    ntdll!ExecuteHandler2 (77726aa3)
If we compare the output above with the raw stack fragment from second chance exception memory dump (after we relaunch TestWER, don’t select ‘Handled Exception’ checkbox and click on the big lightning button) we would see the similar call fragment:
[...]

0018f3f4  00dd0aa7

0018f3f8  0018f41c

0018f3fc  77726ac9 ntdll!ExecuteHandler2+0x26

0018f400  fffffffe

0018f404  0018ffc4

0018f408  0018f534

0018f40c  0018f4b8

0018f410  0018f840

0018f414  77726add ntdll!ExecuteHandler2+0x3a

0018f418  0018ffc4

0018f41c  0018f4cc

0018f420  77726a9b ntdll!ExecuteHandler+0×24

0018f424  0018f4e4

0018f428  0018ffc4

0018f42c  0018f534

0018f430  0018f4b8

0018f434  77750ae5 ntdll!_except_handler4

0018f438  00000000

0018f43c  0018f4e4

0018f440  0018ffc4

0018f444  77726a3d ntdll!RtlDispatchException+0×127

0018f448  0018f4e4

0018f44c  0018ffc4

0018f450  0018f534

0018f454  0018f4b8

0018f458  77750ae5 ntdll!_except_handler4

0018f45c  00000111

0018f460  0018f4e4

[…]
Sometimes, we can also see “Unwind”, “StackWalk”, “WalkFrames”, ”EH”, “Catch” functions too. Sometimes we don’t see anything because such residue was overwritten by subsequent function calls after handled exceptions happened some time in the past.
- Dmitry Vostokov @ DumpAnalysis.org + TraceAnalysis.org -
September 20th, 2013 at 12:45 pm
If we get several the same first chance exception dumps for the same process it means that it was handled otherwise we wouldn’t see the subsequent dumps