Multiple Exceptions (user mode) - Modeling Example
 Multiple Exceptions (kernel mode)
 Multiple Exceptions (managed space)
- Multiple Exceptions (stowed)
 Dynamic Memory Corruption (process heap)
 Dynamic Memory Corruption (kernel pool)
- Dynamic Memory Corruption (managed heap)
 False Positive Dump
 Lateral Damage (general)
- Lateral Damage (CPU mode)
 Optimized Code (function parameter reuse)
 Invalid Pointer (general)
- Invalid Pointer (objects)
 NULL Pointer (code)
 NULL Pointer (data)
 Inconsistent Dump
 Hidden Exception (user space)
- Hidden Exception (kernel space)
- Hidden Exception (managed space)
 Deadlock (critical sections)
 Deadlock (executive resources)
 Deadlock (mixed objects, user space)
 Deadlock (LPC)
 Deadlock (mixed objects, kernel space)
 Deadlock (self)
- Deadlock (managed space)
- Deadlock (.NET Finalizer)
 Changed Environment
 Incorrect Stack Trace
 OMAP Code Optimization
 No Component Symbols
 Insufficient Memory (committed memory)
 Insufficient Memory (handle leak)
 Insufficient Memory (kernel pool)
 Insufficient Memory (PTE)
 Insufficient Memory (module fragmentation)
 Insufficient Memory (physical memory)
 Insufficient Memory (control blocks)
- Insufficient Memory (reserved virtual memory)
- Insufficient Memory (session pool)
- Insufficient Memory (stack trace database)
- Insufficient Memory (region)
- Insufficient Memory (stack)
 Spiking Thread
 Module Variety
 Stack Overflow (kernel mode)
 Stack Overflow (user mode)
 Stack Overflow (software implementation)
- Stack Overflow (insufficient memory)
- Stack Overflow (managed space)
 Managed Code Exception
- Managed Code Exception (Scala)
- Managed Code Exception (Python)
 Truncated Dump
 Waiting Thread Time (kernel dumps)
 Waiting Thread Time (user dumps)
 Memory Leak (process heap) - Modeling Example
 Memory Leak (.NET heap)
- Memory Leak (page tables)
- Memory Leak (I/O completion packets)
- Memory Leak (regions)
 Missing Thread (user space)
- Missing Thread (kernel space)
 Unknown Component
 Double Free (process heap)
 Double Free (kernel pool)
 Coincidental Symbolic Information
 Stack Trace
- Stack Trace (I/O request)
- Stack Trace (file system filters)
- Stack Trace (database)
- Stack Trace (I/O devices)
 Virtualized Process (WOW64)
- Virtualized Process (ARM64EC and CHPE)
 Stack Trace Collection (unmanaged space)
- Stack Trace Collection (managed space)
- Stack Trace Collection (predicate)
- Stack Trace Collection (I/O requests)
- Stack Trace Collection (CPUs)
 Coupled Processes (strong)
 Coupled Processes (weak)
 Coupled Processes (semantics)
 High Contention (executive resources)
 High Contention (critical sections)
 High Contention (processors)
- High Contention (.NET CLR monitors)
- High Contention (.NET heap)
- High Contention (sockets)
 Accidental Lock
 Passive Thread (user space)
 Passive System Thread (kernel space)
 Main Thread
 Busy System
 Historical Information
 Object Distribution Anomaly (IRP)
- Object Distribution Anomaly (.NET heap)
 Local Buffer Overflow (user space)
- Local Buffer Overflow (kernel space)
 Early Crash Dump
 Hooked Functions (user space)
 Hooked Functions (kernel space)
- Hooked Modules
 Custom Exception Handler (user space)
 Custom Exception Handler (kernel space)
 Special Stack Trace
 Manual Dump (kernel)
 Manual Dump (process)
 Wait Chain (general)
 Wait Chain (critical sections)
 Wait Chain (executive resources)
 Wait Chain (thread objects)
 Wait Chain (LPC/ALPC)
 Wait Chain (process objects)
 Wait Chain (RPC)
 Wait Chain (window messaging)
 Wait Chain (named pipes)
- Wait Chain (mutex objects)
- Wait Chain (pushlocks)
- Wait Chain (CLR monitors)
- Wait Chain (RTL_RESOURCE)
- Wait Chain (modules)
- Wait Chain (nonstandard synchronization)
- Wait Chain (C++11, condition variable)
- Wait Chain (SRW lock)
 Corrupt Dump
 Dispatch Level Spin
 No Process Dumps
 No System Dumps
 Suspended Thread
 Special Process
 Frame Pointer Omission
 False Function Parameters
 Message Box
 Self-Dump
 Blocked Thread (software)
 Blocked Thread (hardware)
- Blocked Thread (timeout)
 Zombie Processes
 Wild Pointer
 Wild Code
 Hardware Error
 Handle Limit (GDI, kernel space)
- Handle Limit (GDI, user space)
 Missing Component (general)
 Missing Component (static linking, user mode)
 Execution Residue (unmanaged space, user)
- Execution Residue (unmanaged space, kernel)
- Execution Residue (managed space)
 Optimized VM Layout
- Invalid Handle (general)
- Invalid Handle (managed space)
- Overaged System
- Thread Starvation (realtime priority)
- Thread Starvation (normal priority)
- Duplicated Module
- Not My Version (software)
- Not My Version (hardware)
- Data Contents Locality
- Nested Exceptions (unmanaged code)
- Nested Exceptions (managed code)
- Affine Thread
- Self-Diagnosis (user mode)
- Self-Diagnosis (kernel mode)
- Self-Diagnosis (registry)
- Inline Function Optimization (unmanaged code)
- Inline Function Optimization (managed code)
- Critical Section Corruption
- Lost Opportunity
- Young System
- Last Error Collection
- Hidden Module
- Data Alignment (page boundary)
- C++ Exception
- Divide by Zero (user mode)
- Divide by Zero (kernel mode)
- Swarm of Shared Locks
- Process Factory
- Paged Out Data
- Semantic Split
- Pass Through Function
- JIT Code (.NET)
- JIT Code (Java)
- Ubiquitous Component (user space)
- Ubiquitous Component (kernel space)
- Nested Offender
- Virtualized System
- Effect Component
- Well-Tested Function
- Mixed Exception
- Random Object
- Missing Process
- Platform-Specific Debugger
- Value Deviation (stack trace)
- Value Deviation (structure field)
- Runtime Thread (CLR)
- Runtime Thread (Python, Linux)
- Coincidental Frames
- Fault Context
- Hardware Activity
- Incorrect Symbolic Information
- Message Hooks - Modeling Example
- Coupled Machines
- Abridged Dump
- Exception Stack Trace
- Distributed Spike
- Instrumentation Information
- Template Module
- Invalid Exception Information
- Shared Buffer Overwrite
- Pervasive System
- Problem Exception Handler
- Same Vendor
- Crash Signature
- Blocked Queue (LPC/ALPC)
- Fat Process Dump
- Invalid Parameter (process heap)
- Invalid Parameter (runtime function)
- String Parameter
- Well-Tested Module
- Embedded Comment
- Hooking Level
- Blocking Module
- Dual Stack Trace
- Environment Hint
- Top Module
- Livelock
- Technology-Specific Subtrace (COM interface invocation)
- Technology-Specific Subtrace (dynamic memory)
- Technology-Specific Subtrace (JIT .NET code)
- Technology-Specific Subtrace (COM client call)
- Dialog Box
- Instrumentation Side Effect
- Semantic Structure (PID.TID)
- Directing Module
- Least Common Frame
- Truncated Stack Trace
- Data Correlation (function parameters)
- Data Correlation (CPU times)
- Module Hint
- Version-Specific Extension
- Cloud Environment
- No Data Types
- Managed Stack Trace
- Managed Stack Trace (Scala)
- Managed Stack Trace (Python)
- Coupled Modules
- Thread Age
- Unsynchronized Dumps
- Pleiades
- Quiet Dump
- Blocking File
- Problem Vocabulary
- Activation Context
- Stack Trace Set
- Double IRP Completion
- Caller-n-Callee
- Annotated Disassembly (JIT .NET code)
- Annotated Disassembly (unmanaged code)
- Handled Exception (user space)
- Handled Exception (.NET CLR)
- Handled Exception (kernel space)
- Duplicate Extension
- Special Thread (.NET CLR)
- Hidden Parameter
- FPU Exception
- Module Variable
- System Object
- Value References
- Debugger Bug
- Empty Stack Trace
- Problem Module
- Disconnected Network Adapter
- Network Packet Buildup
- Unrecognizable Symbolic Information
- Translated Exception
- Regular Data
- Late Crash Dump
- Blocked DPC
- Coincidental Error Code
- Punctuated Memory Leak
- No Current Thread
- Value Adding Process
- Activity Resonance
- Stored Exception
- Spike Interval
- Stack Trace Change
- Unloaded Module
- Deviant Module
- Paratext
- Incomplete Session
- Error Reporting Fault
- First Fault Stack Trace
- Frozen Process
- Disk Packet Buildup
- Hidden Process
- Active Thread (Mac OS X)
- Active Thread (Windows)
- Critical Stack Trace
- Handle Leak
- Module Collection
- Module Collection (predicate)
- Deviant Token
- Step Dumps
- Broken Link
- Debugger Omission
- Glued Stack Trace
- Reduced Symbolic Information
- Injected Symbols
- Distributed Wait Chain
- One-Thread Process
- Module Product Process
- Crash Signature Invariant
- Small Value
- Shared Structure
- Thread Cluster
- False Effective Address
- Screwbolt Wait Chain
- Design Value
- Hidden IRP
- Tampered Dump
- Memory Fluctuation (process heap)
- Last Object
- Rough Stack Trace (unmanaged space)
- Rough Stack Trace (managed space)
- Past Stack Trace
- Ghost Thread
- Dry Weight
- Exception Module
- Reference Leak
- Origin Module
- Hidden Call
- Corrupt Structure
- Software Exception
- Crashed Process
- Variable Subtrace
- User Space Evidence
- Internal Stack Trace
- Distributed Exception (managed code)
- Thread Poset
- Stack Trace Surface
- Hidden Stack Trace
- Evental Dumps
- Clone Dump
- Parameter Flow
- Critical Region
- Diachronic Module
- Constant Subtrace
- Not My Thread
- Window Hint
- Place Trace
- Stack Trace Signature
- Relative Memory Leak
- Quotient Stack Trace
- Module Stack Trace
- Foreign Module Frame
- Unified Stack Trace
- Mirror Dump Set
- Memory Fibration
- Aggregated Frames
- Frame Regularity
- Stack Trace Motif
- System Call
- Stack Trace Race
- Hyperdump
- Disassembly Ambiguity
- Exception Reporting Thread
- Active Space
- Subsystem Modules
- Region Profile
- Region Clusters
- Source Stack Trace
- Hidden Stack
- Interrupt Stack
- False Memory
- Frame Trace
- Pointer Cone
- Context Pointer
- Pointer Class
- False Frame
- Procedure Call Chain
- C++ Object
- COM Exception
- Structure Sheaf
- Saved Exception Context (.NET)
- Shared Thread
- Spiking Interrupts
- Structure Field Collection
- Black Box
- Rough Stack Trace Collection (unmanaged space)
- COM Object
- Shared Page
- Exception Collection
- Dereference Nearpoint
- Address Representations
- Near Exception
- Shadow Stack Trace
- Past Process
- Foreign Stack
- Annotated Stack Trace
- Disassembly Summary
- Region Summary
- Analysis Summary
- Region Spectrum
- Normalized Region
- Function Pointer
- Interrupt Stack Collection
- DPC Stack Collection
- Dump Context
- False Local Address
- Encoded Pointer
- Latent Structure
- ISA-Specific Code
Book: Accelerated Linux Core Dump Analysis, Fourth Edition
The following direct links can be used to order the book now:
Available in PDF and ultra-premium color paperback formats with recording from Software Diagnostics Technology and Services
Available in PDF format from Leanpub
Available in ultra-premium color paperback format from Amazon and Barnes & Noble
Available in Kindle print replica format from Amazon
The book is also included in the following training packs:
GDB Training Pack
WinDbg Training Pack
Pattern-Oriented Unix Memory Dump Analysis Training Pack
Pattern-Oriented Memory Dump Analysis Training Pack
Pattern-Oriented Linux Debugging Training Pack
Foundations of Linux Memory Dump Analysis Training Pack
Linux Memory Dump Analysis for Endpoint Security Training Pack
Pattern-Oriented Memory Dump Analysis Training Pack
Complete Pattern-Oriented Software Diagnostics Training Pack
The full transcript of Software Diagnostics Services training. Learn how to analyze Linux process and kernel crashes and hangs, navigate through core memory dump space, and diagnose corruption, memory leaks, CPU spikes, blocked threads, deadlocks, wait chains, and much more. This training uses a unique and innovative pattern-oriented diagnostic analysis approach to speed up the learning curve. The training consists of more than 70 practical step-by-step exercises using GDB and WinDbg debuggers, highlighting more than 50 memory analysis patterns diagnosed in 64-bit core memory dumps from x64 and ARM64 platforms. The training also includes source code of modeling applications, a catalog of relevant patterns from the Software Diagnostics Institute, and an overview of relevant similarities and differences between Windows and Linux memory dump analysis useful for engineers with a Wintel background. In addition to various improvements, the fully revised and updated fourth edition adds entirely new material, such as defect mechanism patterns and WinDbg Linux kernel dump analysis exercises.
- Title: Accelerated Linux Core Dump Analysis: Training Course Transcript with GDB and WinDbg Practice Exercises, Fourth Edition
- Authors: Dmitry Vostokov, Software Diagnostics Services, Dublin School of Security
- Publisher: OpenTask (January 2025)
- Language: English
- PDF/Paperback: 737 pages
- ISBN-13: 978-1912636495
Table of Contents and Sample Exercise
Slides from the training
Book: Accelerated Windows API for Software Diagnostics, Second Edition
The following direct links can be used to order the book now:
Available in PDF format with the optional recording and Memory Dump Analysis Anthology from Software Diagnostics Technology and Services
Available in PDF format from Leanpub
Available in ultra-premium color paperback format from Amazon and Barnes & Noble
Available in Kindle print replica format from Amazon
The book is also included in the following training courses and training packs:
WinDbg Training Pack
Foundations of Windows Memory Dump Analysis Training Pack
System API Patterns for Software Diagnostics Training Pack
Accelerated C & C++ for Windows Diagnostics
Accelerated Rust Windows Memory Dump Analysis
Memory Thinking for Rust
Complete Pattern-Oriented Software Diagnostics Training Pack
The book contains the full Software Diagnostics Services training transcript with 10 hands-on exercises.
Knowledge of Windows API is necessary for:
- Development
- Malware analysis
- Vulnerability analysis and exploitation
- Reversing
- Diagnostics
- Debugging
- Memory forensics
- Crash and hang analysis
- Secure coding
- Static code analysis
- Trace and log analysis
The training uses a unique and innovative pattern-oriented analysis approach and provides:
- Overview
- Classification
- Patterns
- Internals
- Development examples
- Analysis examples
The second edition includes the relevant x64 disassembly overview and additional topics.
- Title: Accelerated Windows API for Software Diagnostics: With Category Theory in View, Second Edition
- Authors: Dmitry Vostokov, Software Diagnostics Services, Dublin School of Security
- Publisher: OpenTask (December 2024)
- Language: English
- Product Dimensions: 28.0 x 21.6
- PDF: 329 pages
- ISBN-13: 978-1912636884
Table of Contents and sample exercise
Slides from the training
Book: Accelerated Rust Windows Memory Dump Analysis
The following direct links can be used to order the book now:
Available in PDF format with the optional recording and Windows API and Memory Thinking for Rust books from Software Diagnostics Technology and Services
Available in PDF format from Leanpub
Available in ultra-premium color paperback format from Amazon and Barnes & Noble
Available in Kindle print replica format from Amazon
The book is also included in the following training courses, training packs, and reference sets:
WinDbg Training Pack
Complete Pattern-Oriented Software Diagnostics Training Pack
The book contains the full Software Diagnostics Services training transcript and 10 step-by-step exercises and covers dozens of crash dump analysis patterns from the x64 process and complete (physical) memory dumps. Learn how to analyze Rust application crashes and freezes, navigate through memory dump space, and diagnose heap corruption, memory leaks, CPU spikes, blocked threads, deadlocks, wait chains, and much more with the WinDbg debugger. The training uses a unique and innovative pattern-oriented analysis approach developed by the Software Diagnostics Institute to speed up the learning curve, and it is structurally based on the latest 6th revised edition of the bestselling Accelerated Windows Memory Dump Analysis book with the focus on safe and unsafe Rust code and its interfacing with the Windows OS. The training is useful whether you come to Rust from C and C++ or interpreted languages like Python and facilitates memory thinking when programming in Rust.
Prerequisites: Basic Windows troubleshooting and working knowledge of Rust.
Audience: Software technical support and escalation engineers, system administrators, security and vulnerability researchers, reverse engineers, malware and memory forensics analysts, DevSecOps and SRE, software developers, system programmers, and quality assurance engineers.
- Title: Accelerated Rust Windows Memory Dump Analysis
- Authors: Dmitry Vostokov, Software Diagnostics Services, Dublin School of Security
- Publisher: OpenTask (December 2024)
- Language: English
- Product Dimensions: 28.0 x 21.6
- PDF: 233 pages
- ISBN-13: 978-1912636891

Table of Contents and sample exercise
Slides from the training
Book: Extended Windows Memory Dump Analysis, Second Edition
The following direct links can be used to order the book now:
Available in PDF format with the optional recording and Memory Dump Analysis Anthology from Software Diagnostics Technology and Services
Available in PDF format from Leanpub
Available in ultra-premium color paperback format from Amazon and Barnes & Noble
Available in Kindle print replica format from Amazon
The book is also included in the following training courses, training packs, and reference sets:
WinDbg Training Pack
Complete Pattern-Oriented Software Diagnostics Training Pack
The book contains the full transcript of Software Diagnostics Services training with 25 hands-on exercises. This training course extends pattern-oriented analysis introduced in Accelerated Windows Memory Dump Analysis, Accelerated .NET Core Memory Dump Analysis, and Advanced Windows Memory Dump Analysis with Data Structures courses with:
- Surveying the current landscape of WinDbg extensions with analysis pattern mappings
- Writing WinDbg extensions in C, C++, and Rust (new)
- Connecting WinDbg to NoSQL databases
- Connecting WinDbg to streaming and log processing platforms
- Querying and visualizing WinDbg output data
- Using Data Science, Machine Learning, and Gen AI for diagnostics and postmortem debugging (new)
The new edition of the training updates existing exercises and includes new ones.
Prerequisites: Working knowledge of WinDbg. Working knowledge of C, C++, or Rust is optional (required only for some exercises). Other concepts are explained when necessary.
Audience: Software developers, software maintenance engineers, escalation engineers, quality assurance engineers, security and vulnerability researchers, malware and memory forensics analysts who want to build memory analysis pipelines.
- Title: Extended Windows Memory Dump Analysis: Using and Writing WinDbg Extensions, Database and Event Stream Processing, Data Science and Visualization, Machine Learning and AI, Second Edition
- Authors: Dmitry Vostokov, Software Diagnostics Services
- Publisher: OpenTask (November 2024)
- Language: English
- Product Dimensions: 28.0 x 21.6
- PDF: 362 pages
- ISBN-13: 978-1912636518
Table of Contents and sample exercise
Slides from the training
Memory Thinking for C & C++ Linux Diagnostics, Second Edition
The following direct links can be used to order the book now:
Available in PDF format from Software Diagnostics Technology and Services
Available in PDF format from Leanpub
Available in ultra-premium color paperback format from Amazon and Barnes & Noble
Available in Kindle print replica format from Amazon
The book is also included in the following training courses, training packs, and reference sets:
Pattern-Oriented Software Diagnostics and Anomaly Detection Reference Set
Accelerated C & C++ for Linux Diagnostics
Memory Thinking for C and C++ Training Pack
Foundations of Linux Memory Dump Analysis Training Pack
GDB Training Pack
Complete Pattern-Oriented Software Diagnostics Training Pack
Solid C and C++ knowledge is a must to fully understand Linux diagnostic artifacts such as core memory dumps and perform diagnostic, forensic, and root cause analysis beyond listing backtraces. This full-color reference book is a part of the Accelerated C & C++ for Linux Diagnostics training course organized by Software Diagnostics Services. The text contains slides, brief notes highlighting particular points, and source code illustrations. In addition to new topics, the second edition adds 45 projects with more than 5,500 lines of code. The book's detailed Table of Contents makes the usual Index redundant. We hope this reference is helpful for the following audiences:
- C and C++ developers who want to deepen their knowledge
- Software engineers developing and maintaining products on Linux platforms
- Technical support, escalation, DevSecOps, cloud, and site reliability engineers dealing with complex software issues
- Quality assurance engineers who test software on Linux platforms
- Security and vulnerability researchers, reverse engineers, malware and memory forensics analysts
- Title: Memory Thinking for C & C++ Linux Diagnostics: Slides with Descriptions and Source Code Illustrations, Second Edition
- Authors: Dmitry Vostokov, Software Diagnostics Services, Dublin School of Security
- Language: English
- Product Dimensions: 25.4 x 20.3
- PDF: 292 pages
- Publisher: OpenTask (October 2024)
- ISBN-13: 978-1912636563
Table of Contents
The first 45 slides from the training (there are 297 slides in total)
Online Training: Writing Bad Code (Part 1)
Software Diagnostics Services organizes this online training course.

Why would you need to learn how to write bad code? Of course, not to write malicious code backdoors, but to understand software internals and diagnostics better. Writing "good" bad code is not easy, especially if you put specific requirements on it and are not satisfied with the accidental effects of "bad" bad code.
Topics include:
- Modeling abnormal software behavior
- Modeling memory analysis patterns
- Modeling trace and log analysis patterns
- Modeling defect mechanism patterns
- Simulation of complex software problems
- Software problem design patterns
- Fault injection
- Excellent bad code
- Portable bad code
- User and kernel code
- Avoiding compiler undefined behavior
- Debugging bad code to make it work as intended
The training also includes numerous hands-on coding projects using Visual C & C++ and GNU C & C++ compilers, x64 Windows, and x64 and ARM64 Linux platforms. Some parts will also use Python, C#, Rust, and Scala for modeling examples.
Before the training, you get:
- Practical Foundations of Windows Debugging, Disassembling, Reversing, Second Edition PDF book (+300 pages)
- Encyclopedia of Crash Dump Analysis Patterns, Third Edition (1,300 pages)
- Trace, Log, Text, Narrative, Data: An Analysis Pattern Reference for Information Mining, Diagnostics, Anomaly Detection, Fifth Edition (400 pages)
- Access to Software Diagnostics Library with more than 440 cross-referenced patterns of memory dump analysis, their classification, more than 70 case studies, and more than 240 general trace and log analysis patterns
After the training, you also get:
- The PDF book version of the training
- Personalized Certificate of Attendance with unique CID
- Recording
If you complete all parts, you will also get the fourth edition of the Encyclopedia of Crash Dump Analysis Patterns once it is available.
Audience:
C and C++ developers, Windows and Linux system programmers, software technical support and escalation engineers, system administrators, security and vulnerability researchers, reverse engineers, malware and memory forensics analysts, software developers, and quality assurance engineers.
Memory Thinking for C & C++ Windows Diagnostics, Second Edition
The following direct links can be used to order the book now:
Available in PDF format from Software Diagnostics Technology and Services
Available in PDF format from Leanpub
Available in ultra-premium color paperback format from Amazon and Barnes & Noble
Available in Kindle print replica format from Amazon
The book is also included in the following training courses, training packs, and reference sets:
Pattern-Oriented Software Diagnostics and Anomaly Detection Reference Set
Accelerated C & C++ for Windows Diagnostics
Memory Thinking for C and C++ Training Pack
Foundations of Windows Memory Dump Analysis Training Pack
WinDbg Training Pack
Complete Pattern-Oriented Software Diagnostics Training Pack
Solid C and C++ knowledge is a must to fully understand Windows diagnostic artifacts, such as memory dumps, and perform diagnostic, forensic, and root cause analysis beyond listing stack traces, DLLs, and driver information. This full-color reference book is a part of the Accelerated C & C++ for Windows Diagnostics training course organized by Software Diagnostics Services. The text contains slides, brief notes highlighting particular points, and illustrative source code fragments. The second edition added 45 Visual Studio projects with more than 5,500 lines of code. The book's detailed Table of Contents makes the usual Index redundant. The book's detailed Table of Contents makes the usual Index redundant. We hope this reference is helpful for the following audiences:
- C and C++ developers who want to deepen their knowledge
- Software engineers developing and maintaining products on Windows platforms
- Technical support, escalation, DevSecOps, cloud and site reliability engineers dealing with complex software issues
- Quality assurance engineers who test software on Windows platforms
- Security and vulnerability researchers, reverse engineers, malware and memory forensics analysts
- Title: Memory Thinking for C & C++ Windows Diagnostics: Slides with Descriptions and Source Code Illustrations, Second Edition
- Authors: Dmitry Vostokov, Software Diagnostics Services, Dublin School of Security
- Language: English
- Product Dimensions: 25.4 x 20.3
- PDF: 272 pages
- Publisher: OpenTask (July 2024)
- ISBN-13: 978-1912636617
Table of Contents
The first 56 slides from the training (there 289 slides in total)
Book: Accelerated Linux Debugging 4D
The following direct links can be used to order the book now:
Available in PDF format with the optional recording and Linux API book from Software Diagnostics Technology and Services
Available in PDF format from Leanpub
Available in ultra-premium color paperback format from Amazon and Barnes & Noble
Available in Kindle print replica format from Amazon
The book is also included in the following training courses, training packs, and reference sets:
Linux Debugging Training Pack
GDB Training Pack
Complete Pattern-Oriented Software Diagnostics Training Pack

Table of Contents and Sample Exercise
Slides from the training
The full transcript of Software Diagnostics Services training with more than 20 step-by-step exercises using WSL and Hyper-V environments, notes, and source code of specially created modeling applications in C, C++, and Rust. Learn live local and remote debugging techniques in the kernel, user process, and managed spaces using WinDbg, GDB, LLDB, rr, and KDB, KGDB debuggers. The unique and innovative course teaches unified debugging patterns applied to real problems from complex software environments. A necessary x64 and ARM64 review is also included.
Prerequisites: Working knowledge of one of these languages: C, C++, Rust. Operating system internals and assembly language concepts are explained when necessary.
Audience: Software engineers, software maintenance engineers, escalation engineers, SRE, DevOps and DevSecOps, cloud engineers, security and vulnerability researchers, malware and memory forensics analysts who want to learn live memory inspection techniques.
- Title: Accelerated Linux Debugging4: Training Course Transcript with WinDbg, GDB, LLDB, rr, KDB, KGDB Practice Exercises
- Authors: Dmitry Vostokov, Software Diagnostics Services
- Publisher: OpenTask (July 2024)
- Language: English
- Product Dimensions: 28.0 x 21.6
- PDF: 360 pages
- ISBN-13: 978-1912636716
Declarative Memory

In addition to physical and virtual memory layers, we add another abstraction, the memory layer associated with source code values. We call it declarative memory. This term is not to be confused with declarative (or explicit) memory in neuropsychology. Memory corresponding to values in source code may be linearly organized but translated to a different layout by a compiler, or different values can be translated to the same virtual memory location. For example, in Rust (which prompted us to introduce this new memory concept), the following tuple is mapped to a different memory layout:
let i: i32 = 1;

let tuple: (bool, i32, &i32) = (true, 0, &i);
0:000> dt tuples!tuple
Local var @ 0x5c3196f2f0 Type tuple$<bool,i32,ref$<i32> >
   +0x004 __0              : 1
   +0x000 __1              : 0n0
   +0x008 __2              : 0x0000005c`3196f2ec  -> 0n1
0:000> dq 0x5c3196f2f0 L2
0000005c`3196f2f0  00000001`00000000 0000005c`3196f2ec
0:000> dd 0x5c3196f2f0 L4
0000005c`3196f2f0  00000000 00000001 3196f2ec 0000005c
Another virtual memory cell reuse example is the Optimized Code (function parameter reuse) memory analysis pattern.
Whereas in trace and log analysis, where there is the Declarative Trace analysis pattern where a declarative trace statement in source code may correspond to many actual trace statements, a kind of 1 to 0..N correspondence, declarative memory is usually M to N, where M >= N.
Similar to virtual-to-physical mapping, where the amount of virtual memory is greater than the amount of physical memory, the amount of declarative memory can be greater than the amount of virtual memory.
Memory Dump Analysis Anthology, Volume 16
The following direct links can be used to order the book now:
Available in PDF format from Software Diagnostics Technology and Services
Available in PDF format from Leanpub
Available in ultra-premium color paperback format from Amazon and Barnes & Noble
Available in Kindle print replica format from Amazon
The book is also included in the following training courses, training packs, and reference sets:
Memory Dump Analysis Anthology Volume Set (Diagnomicon)
Advanced Windows Memory Dump Analysis with Data Structures
Pattern-Oriented Software Diagnostics and Anomaly Detection Reference Set
Pattern-Oriented Windows Victimware Analysis Training Pack
Pattern-Oriented Windows Crash Dump Analysis Training Pack
Pattern-Oriented Windows Memory Forensics Training Pack
Windows Memory Dump Analysis for Endpoint Security Training Pack
Pattern-Oriented Complete Windows Memory Dump Analysis Training Pack
Complete Pattern-Oriented Software Diagnostics Training Pack
This reference volume consists of revised, edited, cross-referenced, and thematically organized selected articles from Software Diagnostics Institute (DumpAnalysis.org + TraceAnalysis.org) and Software Diagnostics Library (former Crash Dump Analysis blog, DumpAnalysis.org/blog) about software diagnostics, root cause analysis, debugging, crash and hang dump analysis, software trace and log analysis written from 15 April 2023 to 14 April 2024 for software engineers developing and maintaining products on Windows platforms, quality assurance engineers testing software, technical support, DevOps and DevSecOps, escalation and site reliability engineers dealing with complex software issues, security and vulnerability researchers, reverse engineers, malware and memory forensics analysts. This volume is fully cross-referenced with volumes 1 – 15 and features:
- 17 new crash dump analysis patterns
- 13 new software trace and log analysis patterns
- New defect mechanism pattern
- Introduction to Lov language
- Lists of recommended books
Product information:
- Title: Memory Dump Analysis Anthology, Volume 16
- Authors: Dmitry Vostokov, Software Diagnostics Institute
- Language: English
- Product Dimensions: 22.86 x 15.24
- Paperback: 170 pages
- Publisher: OpenTask (April 2024)
- ISBN-13: 978-1-912636-16-7

Book: Advanced Windows Memory Dump Analysis with Data Structures, Fifth Edition
The following direct links can be used to order the book now:
Available in PDF format with the recording and optional Memory Dump Analysis Anthology from Software Diagnostics Technology and Services
Available in PDF format from Leanpub
Available in ultra-premium color paperback format from Amazon and Barnes & Noble
Available in Kindle print replica format from Amazon
The book is also included in the following training packs:
WinDbg Training Pack
Pattern-Oriented Windows Crash Dump Analysis Training Pack
Pattern-Oriented Windows Memory Forensics Training Pack
Windows Memory Dump Analysis for Endpoint Security Training Pack
Pattern-Oriented Complete Windows Memory Dump Analysis Training Pack
Complete Pattern-Oriented Software Diagnostics Training Pack
The full transcript of the Software Diagnostics Services training course with 16 step-by-step exercises, notes, and selected questions and answers. Learn how to navigate through memory dump space and Windows data structures to diagnose, troubleshoot, and debug complex software incidents. The training uses a unique and innovative pattern-oriented analysis approach to speed up the learning curve. It consists of practical step-by-step exercises using WinDbg to diagnose structural and behavioral patterns in the 64-bit kernel and complete (physical) memory dumps. Additional topics include memory search, kernel linked list navigation, practical WinDbg scripting, registry, system variables and objects, device drivers, and I/O. Prerequisites are basic and intermediate level Windows memory dump analysis: the ability to list processors, processes, threads, modules, apply symbols, walk through stack traces and raw stack data, diagnose patterns such as heap corruption, CPU spike, memory leaks, access violation, wait chains and deadlocks. If you don't feel comfortable with prerequisites, then Accelerated Windows Memory Dump Analysis training book is recommended before purchasing and reading this book course. Audience: Software technical support and escalation engineers, system administrators, security researchers, reverse engineers, malware and memory forensics analysts, software developers, and quality assurance engineers. The fifth edition uses the latest WinDbg, includes the relevant Unified Modeling Language tutorial, revised and extended existing exercises, and added the exercise that demonstrates the use of a Generative AI LLM assistant.
- Title: Advanced Windows Memory Dump Analysis with Data Structures: Training Course Transcript and WinDbg Practice Exercises with Notes, Fifth Edition
- Authors: Dmitry Vostokov, Software Diagnostics Services, Dublin School of Security
- Publisher: OpenTask (March 2024)
- Language: English
- Product Dimensions: 28.0 x 21.6
- Paperback: 341 pages
- ISBN-13: 978-1912636952
Theoretical Software Diagnostics, Fourth Edition
The following direct links can be used to order the book now:
Available in PDF format from Software Diagnostics Technology and Services
Available in PDF format from Leanpub
Available in ultra-premium color paperback format from Amazon and Barnes & Noble
Available in Kindle print replica format from Amazon
The book is also included in the following training packs and reference sets:
Pattern-Oriented Software Diagnostics and Anomaly Detection Reference Set
Complete Pattern-Oriented Software Diagnostics Training Pack
Contains reprinted articles in full color (including more than 230 figures) from 16 volumes of Memory Dump Analysis Anthology (Diagnomicon) related to pattern-oriented software diagnostics with additional comments showing the historical development of this autonomous and distinctive discipline over the last 18 years. In addition to 15 new articles, the fourth edition includes updated threads of thinking, a list of mathematical concepts, and notes’ references, and was completely remastered.
Product information:
- Title: Theoretical Software Diagnostics: Collected Articles, Fourth Edition
- Authors: Dmitry Vostokov, Software Diagnostics Institute
- Language: English
- Product Dimensions: 21.6 x 14.0
- PDF: 398 pages
- Publisher: OpenTask (February 2024)
- ISBN-13: 978-1912636914
Table of Contents
Bird's-eye View of Pages
Book: Accelerated Windows Debugging 4D, Fourth Edition
The following direct links can be used to order the book now:
Available in PDF format and optional Memory Dump Analysis Anthology from Software Diagnostics Technology and Services
Available in PDF format from Leanpub
Available in ultra-premium color paperback format from Amazon and Barnes & Noble
Available in Kindle print replica format from Amazon
The book is also included in the following training packs:
WinDbg Training Pack
Pattern-Oriented Windows Debugging Training Pack
Complete Pattern-Oriented Software Diagnostics Training Pack
The full transcript of Software Diagnostics Services training with 16 step-by-step exercises, notes, and source code of specially created modeling applications. Learn live local and remote debugging techniques in the kernel, user process, and managed .NET spaces using WinDbg debugger. The unique and innovative course teaches unified debugging patterns applied to real problems from complex software environments. The fourth edition was fully reworked and updated to use the latest WinDbg, added x64 disassembly review and Rust language to the existing and improved C/C++ and C# exercises.
Prerequisites: Working knowledge of one of these languages: C, C++, C#, Rust. Operating system internals and assembly language concepts are explained when necessary.
Audience: Software engineers, software maintenance engineers, escalation engineers, security and vulnerability researchers, malware and memory forensics analysts who want to learn live memory inspection techniques.
- Title: Accelerated Windows Debugging4: Training Course Transcript and WinDbg Practice Exercises, Fourth Edition
- Authors: Dmitry Vostokov, Software Diagnostics Services
- Publisher: OpenTask (February 2024)
- Language: English
- Product Dimensions: 28.0 x 21.6
- PDF: 372 pages
- ISBN-13: 978-1912636723
Defect Mechanism Patterns (DMP), Part 1
In 2015, we introduced patterns-based root cause analysis methodology by adding software problem mechanisms to accompany software diagnostic problems and their analysis patterns. We also planned to start populating the new pattern catalog at that time, but due to other developments and ideas, we have postponed it until now. We also plan to include a new pattern catalog and case studies in our modeling software defects course.
Usually, an identified software diagnostic problem may have several different mechanisms, and a mechanism may contribute to several diagnostic signs and symptoms. Knowing such mechanisms helps greatly in modeling a problem, devising a debugging strategy, and proposing a code fix.
We start with the Spiking Thread memory analysis pattern, which has concrete analysis pattern variants for Windows, Linux, and macOS.
From its Stack Trace, we may identify the source code location. If the code uses some memory-intensive data structure, we may have an instance of Inefficient Container Implementation. Another mechanism to consider is Partial Breaking Functionality. The defect mechanism pattern names are provisional and may change as more patterns are added that require name revisions for generality, consistency, and perhaps just better names.
Inefficient Container Implementation is when a wrong container or flawed implementation is used for memory and CPU-bound code. For example, using a contiguous vector instead of a linked list may affect CPU resource consumption on insertions and deletions. Some containers, such as queues, may use underlying container implementations that can be replaced.
Partial Breaking Functionality is when we have a potentially infinite loop with checks for some conditions that prevent it from running forever. However, the list of such conditions is only partially implemented, leaving some conditions unchecked, which causes a real infinite loop with the detected CPU consumption.
Carnot Cycle Metaphor for Trace and Log Analysis
Recently, we added a few “thermodynamic” analysis patterns to our trace and log analysis pattern catalog, such as Trace Volume, Trace Temperature, and, finally, derived from an ideal gas equation metaphor, Trace Pressure. These patterns allow us to employ a Carnot cycle metaphor for a typical analysis cycle:
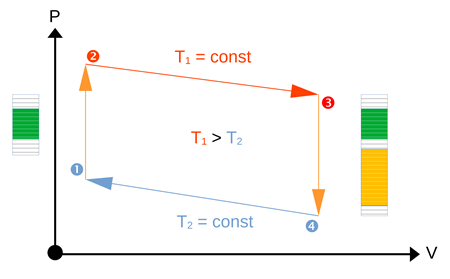
Initially, we have a low temperature (low importance) for a low volume of traces.
- During the incident, temperature (importance of traces) rises, triggering the rise in pressure.
- The volume of collected traces increases during investigations, and the pressure may go up or down.
- Once the problem is solved, the temperature comes down.
- During this phase, we do a retrospective and gradually reduce the volume of traces necessary for continuous monitoring to its original volume.
Book: Accelerated Disassembly, Reconstruction and Reversing, Third Edition
The following direct links can be used to order the book now:
Available in PDF format with the optional recording and Memory Dump Analysis Anthology from Software Diagnostics Technology and Services
Available in PDF format from Leanpub
Available in ultra-premium color paperback format from Amazon and Barnes & Noble
Available in Kindle print replica format from Amazon
The book is also included in the following training packs:
WinDbg Training Pack
Windows Memory Dump Analysis for Endpoint Security Training Pack
Pattern-Oriented Disassembling and Reversing Training Pack
Complete Pattern-Oriented Software Diagnostics Training Pack
The book contains the full transcript of Software Diagnostics Services training. Learn disassembly, execution history reconstruction, and binary reversing techniques for better software diagnostics, troubleshooting, debugging, memory forensics, vulnerability, and malware analysis on x64 Windows platforms. The course uses a unique and innovative pattern-oriented analysis approach to speed the learning curve. The training consists of practical step-by-step, hands-on exercises using WinDbg and memory dumps. More than 25 ADDR patterns are covered, and many concepts are illustrated with Memory Cell Diagrams. This training requires a working knowledge of C and C++ programming languages. Operating system internals and assembly language concepts are explained when necessary. The primary audience for this training is software technical support and escalation engineers who analyze memory dumps from complex software environments and need to go deeper in their analysis of abnormal software structure and behavior. The course is also useful for software engineers, quality assurance and software maintenance engineers who debug software running on diverse computer environments, security researchers, malware, and memory forensics analysts who have never used WinDbg to analyze computer memory. The third edition includes the x64 disassembly review and the internals of C++ virtual function calls.
- Title: Accelerated Disassembly, Reconstruction and Reversing: Training Course Transcript and WinDbg Practice Exercises with Memory Cell Diagrams, Third Edition
- Authors: Dmitry Vostokov, Software Diagnostics Services, Dublin School of Security
- Publisher: OpenTask (September 2023)
- Language: English
- Product Dimensions: 28.0 x 21.6
- PDF: 269 pages
- ISBN-13: 978-1912636679

Table of Contents and sample exercise
Slides from the training
Accelerated Linux Disassembly, Reconstruction and Reversing, Second Edition
The following direct links can be used to order the book now:
Available in PDF format with optional recording and Memory Dump Analysis Anthology from Software Diagnostics Technology and Services
Available in PDF format from Leanpub
Available in ultra-premium color paperback format from Amazon and Barnes & Noble
Available in Kindle print replica format from Amazon
The book is also included in the following training packs:
GDB Training Pack
Linux Memory Dump Analysis for Endpoint Security Training Pack
Pattern-Oriented Disassembling and Reversing Training Pack
Complete Pattern-Oriented Software Diagnostics Training Pack
The book contains the full transcript of Software Diagnostics Services training. Learn disassembly, execution history reconstruction, and binary reversing techniques for better software diagnostics, troubleshooting, debugging, memory forensics, vulnerability, and malware analysis on x64 (x86_64) and A64 (ARM64, AArch64) Linux platforms. The course uses a unique and innovative pattern language approach to speed up the learning curve. The training consists of practical step-by-step, hands-on exercises using GDB and Linux core memory dumps. Covered more than 25 ADDR patterns originally introduced for the x64 Windows platform, and many concepts are illustrated with Memory Cell Diagrams. The prerequisites for this training are a working knowledge of C and C++ programming languages. Operating system internals and assembly language concepts are explained when necessary. The primary audience for this training is software technical support and escalation engineers who analyze memory dumps from complex software environments and need to go deeper in their analysis of abnormal software structure and behavior. The course is also useful for software engineers, quality assurance, and software maintenance engineers who debug software running on diverse cloud and endpoint computer environments, SRE and DevSecOps, security and vulnerability researchers, and malware and memory forensics analysts who have never used GDB for analysis of computer memory. The book also features ADDR pattern descriptions summarized after each exercise. The second edition includes a review of relevant assembly language fundamentals and relevant differences between GCC and Clang.
- Title: Accelerated Linux Disassembly, Reconstruction and Reversing: Training Course Transcript and GDB Practice Exercises with Memory Cell Diagrams, Second Edition
- Authors: Dmitry Vostokov, Software Diagnostics Services
- Publisher: OpenTask (March 2023)
- Language: English
- Product Dimensions: 28.0 x 21.6
- PDF: 282 pages
- ISBN-13: 978-1912636747

Table of Contents and sample exercise
Slides from the training
Book: Malware Narratives, Revised Edition
The following direct links can be used to order the book now:
Available in PDF format from Leanpub
Available in ultra-premium color paperback format from Amazon and Barnes & Noble
Available in Kindle print replica format from Amazon
The book is also included in the following training packs and reference sets:
Pattern-Oriented Software Diagnostics and Anomaly Detection Reference Set
Pattern-Oriented Trace and Log Analysis Training Pack
Pattern-Oriented Malware Analysis Training Pack
Complete Pattern-Oriented Software Diagnostics Training Pack
Software Narratology, the science of software stories, found its successful application in software diagnostics of abnormal software behavior, especially in the pattern-oriented analysis of software logs from complex systems with millions of events, thousands of threads, hundreds of processes and modules. This is a revised and updated transcript of the Software Diagnostics Services seminar on the new application of software narratology to malware analysis.
- Title: Malware Narratives: An Introduction, Revised Edition
- Authors: Dmitry Vostokov, Software Diagnostics Services
- Publisher: OpenTask (October 2023)
- Language: English
- Product Dimensions: 28.0 x 21.6
- Paperback: 55 pages
- ISBN-13: 978-1912636525
Introducing Lov Language
In the past, I paid little attention to traditional performance and system behavior visualizations, for example, for time series. My own visualizations included Dia|gram graphical language for software narratives such as traces and logs and, recently, memory snapshots. My latest exposure to open-source observability and visualization tools led me to think about how to describe patterns I see in a pattern language. It is easy to communicate what I see by just sending the picture, but often, we need to compare it to the previous observations or do some symbolic processing of such information.
I decided to tailor existing rich diagnostic analysis pattern languages I developed over the last +15 years into the Language of visualizations that I simply call the Lov language, my new old love of visualizations of software behavior (no pun intended). It is not a programming language but primarily a language for description and analysis; also, it can be used for hypothesis testing and simulation with the appropriate tool support. The initial inspiration for Lov comes from two dual activities: visualization synthesis for time series data and analysis of such visualizations. For a simple initial illustration, the visualization description above of CPU consumption for all processes in the system reuses the existing Discontinuity for all PID Adjoint Threads of Activity and Blackout trace and log analysis patterns. We also see Signals for Counter Values. More Lov to come in the forthcoming months.
Book: Accelerated Linux API for Software Diagnostics
The following direct links can be used to order the book now:
Available in PDF with the optional recording from Software Diagnostics Technology and Services
Available in PDF format from Leanpub
Available in ultra-premium color paperback format from Amazon and Barnes & Noble
Available in Kindle print replica format from Amazon
The book is also included in the following training courses and training packs:
GDB Training Pack
Foundations of Linux Memory Dump Analysis Training Pack
Pattern-Oriented Linux Debugging Training Pack
Linux Memory Dump Analysis for Endpoint Security Training Pack
System API Patterns for Software Diagnostics Training Pack
Accelerated C & C++ for Linux Diagnostics
Memory Thinking for Rust, Second Edition
Accelerated Linux Debugging4
Complete Pattern-Oriented Software Diagnostics Training Pack
Available in PDF format from Software Diagnostics Services.
The book contains the full transcript of Software Diagnostics Services training with 16 hands-on exercises.
Knowledge of Linux API is necessary for:
- Development
- Malware analysis
- Vulnerability analysis and exploitation
- Reversing
- Diagnostics
- Debugging
- Memory forensics
- Crash and hang analysis
- Secure coding
- Static code analysis
- Trace and log analysis
The training uses a unique and innovative pattern-oriented analysis approach and provides:
- Overview
- Classification
- Patterns
- Internals
- Development examples
- Analysis examples
- Comparison with Windows API

- Title: Accelerated Linux API for Software Diagnostics: With Category Theory in View
- Authors: Dmitry Vostokov, Software Diagnostics Services
- Publisher: OpenTask (June 2023)
- Language: English
- Product Dimensions: 28.0 x 21.6
- PDF: 232 pages
- ISBN-13: 978-1912636624
Table of Contents and sample exercise
Slides from the training
Runtime Thread (Python, Linux)
We continue extending our memory analysis pattern language to Python execution environment after introducing Managed Stack Trace variant. Now we add Runtime Thread (former CLR Thread memory analysis pattern) variant. For Linux and GDB, in the case of Reduced Symbolic Information we get this stack trace:
(gdb) bt

#0  0x00007ffff7caeb97 in __GI___select (nfds=0, readfds=0x0, writefds=0x0, exceptfds=0x0, timeout=0x7fffffffd9f0)

    at ../sysdeps/unix/sysv/linux/select.c:41

#1  0x00000000004e8965 in ?? ()

#2  0x00000000005d8711 in _PyMethodDef_RawFastCallKeywords ()

#3  0x000000000054b330 in ?? ()

#4  0x00000000005524cd in _PyEval_EvalFrameDefault ()

#5  0x00000000005d91fc in _PyFunction_FastCallKeywords ()

#6  0x000000000054e5ac in _PyEval_EvalFrameDefault ()

#7  0x00000000005d91fc in _PyFunction_FastCallKeywords ()

#8  0x000000000054e5ac in _PyEval_EvalFrameDefault ()

#9  0x00000000005d91fc in _PyFunction_FastCallKeywords ()

#10 0x000000000054e5ac in _PyEval_EvalFrameDefault ()

#11 0x000000000054bcc2 in _PyEval_EvalCodeWithName ()

#12 0x000000000054e0a3 in PyEval_EvalCode ()

#13 0x0000000000630ce2 in ?? ()

#14 0x0000000000630d97 in PyRun_FileExFlags ()

#15 0x00000000006319ff in PyRun_SimpleFileExFlags ()

#16 0x000000000065432e in ?? ()

#17 0x000000000065468e in _Py_UnixMain ()

#18 0x00007ffff7be209b in __libc_start_main (main=0x4bc560 <main>, argc=2, argv=0x7fffffffe4c8, init=<optimized out>, fini=<optimized out>,

    rtld_fini=<optimized out>, stack_end=0x7fffffffe4b8) at ../csu/libc-start.c:308

#19 0x00000000005e0e8a in _start ()
If we install python debug package (for example, python3.7-dbg) we get full symbolic information:
(gdb) bt

#0  0x00007ffff7caeb97 in __GI___select (nfds=0, readfds=0x0, writefds=0x0, exceptfds=0x0, timeout=0x7fffffffd9f0)

    at ../sysdeps/unix/sysv/linux/select.c:41

#1  0x00000000004e8965 in pysleep (secs=<optimized out>) at ../Modules/timemodule.c:1829

#2  time_sleep (self=<optimized out>, obj=<optimized out>, self=<optimized out>, obj=<optimized out>) at ../Modules/timemodule.c:371

#3  0x00000000005d8711 in _PyMethodDef_RawFastCallKeywords (method=0x82dbe0 <time_methods+288>, self=<module at remote 0x7ffff77d5c28>,

    args=0x7ffff788c550, nargs=<optimized out>, kwnames=<optimized out>) at ../Objects/call.c:644

#4  0x000000000054b330 in _PyCFunction_FastCallKeywords (kwnames=<optimized out>, nargs=<optimized out>, args=0x7ffff788c550,

    func=<built-in method sleep of module object at remote 0x7ffff77d5c28>) at ../Objects/call.c:730

#5  call_function (pp_stack=0x7fffffffdb60, oparg=<optimized out>, kwnames=<optimized out>) at ../Python/ceval.c:4568

#6  0x00000000005524cd in _PyEval_EvalFrameDefault (f=<optimized out>, throwflag=<optimized out>) at ../Python/ceval.c:3093

#7  0x00000000005d91fc in PyEval_EvalFrameEx (throwflag=0, f=Frame 0x7ffff788c3d8, for file sleepLoop.py, line 11, in bar ()) at ../Python/ceval.c:547

#8  function_code_fastcall (globals=<optimized out>, nargs=<optimized out>, args=<optimized out>, co=<optimized out>) at ../Objects/call.c:283

#9  _PyFunction_FastCallKeywords (func=<optimized out>, stack=<optimized out>, nargs=<optimized out>, kwnames=<optimized out>) at ../Objects/call.c:408

#10 0x000000000054e5ac in call_function (kwnames=0x0, oparg=<optimized out>, pp_stack=<synthetic pointer>) at ../Python/ceval.c:4616

#11 _PyEval_EvalFrameDefault (f=<optimized out>, throwflag=<optimized out>) at ../Python/ceval.c:3124

#12 0x00000000005d91fc in PyEval_EvalFrameEx (throwflag=0, f=Frame 0x7ffff77d85e8, for file sleepLoop.py, line 7, in foo ()) at ../Python/ceval.c:547

#13 function_code_fastcall (globals=<optimized out>, nargs=<optimized out>, args=<optimized out>, co=<optimized out>) at ../Objects/call.c:283

#14 _PyFunction_FastCallKeywords (func=<optimized out>, stack=<optimized out>, nargs=<optimized out>, kwnames=<optimized out>) at ../Objects/call.c:408

#15 0x000000000054e5ac in call_function (kwnames=0x0, oparg=<optimized out>, pp_stack=<synthetic pointer>) at ../Python/ceval.c:4616

#16 _PyEval_EvalFrameDefault (f=<optimized out>, throwflag=<optimized out>) at ../Python/ceval.c:3124

#17 0x00000000005d91fc in PyEval_EvalFrameEx (throwflag=0, f=Frame 0x926ee8, for file sleepLoop.py, line 4, in main ()) at ../Python/ceval.c:547

#18 function_code_fastcall (globals=<optimized out>, nargs=<optimized out>, args=<optimized out>, co=<optimized out>) at ../Objects/call.c:283

#19 _PyFunction_FastCallKeywords (func=<optimized out>, stack=<optimized out>, nargs=<optimized out>, kwnames=<optimized out>) at ../Objects/call.c:408

#20 0x000000000054e5ac in call_function (kwnames=0x0, oparg=<optimized out>, pp_stack=<synthetic pointer>) at ../Python/ceval.c:4616

#21 _PyEval_EvalFrameDefault (f=<optimized out>, throwflag=<optimized out>) at ../Python/ceval.c:3124

#22 0x000000000054bcc2 in PyEval_EvalFrameEx (throwflag=0, f=Frame 0x7ffff78739f8, for file sleepLoop.py, line 14, in <module> ())

    at ../Python/ceval.c:547

#23 _PyEval_EvalCodeWithName (_co=<optimized out>, globals=<optimized out>, locals=<optimized out>, args=<optimized out>, argcount=<optimized out>,

    kwnames=0x0, kwargs=0x0, kwcount=<optimized out>, kwstep=2, defs=0x0, defcount=0, kwdefs=0x0, closure=0x0, name=0x0, qualname=0x0)

    at ../Python/ceval.c:3930

#24 0x000000000054e0a3 in PyEval_EvalCodeEx (closure=0x0, kwdefs=0x0, defcount=0, defs=0x0, kwcount=0, kws=0x0, argcount=0, args=0x0,

    locals=<optimized out>, globals=<optimized out>, _co=<optimized out>) at ../Python/ceval.c:3959

#25 PyEval_EvalCode (co=<optimized out>, globals=<optimized out>, locals=<optimized out>) at ../Python/ceval.c:524

#26 0x0000000000630ce2 in run_mod (mod=<optimized out>, filename=<optimized out>,

    globals={'__name__': '__main__', '__doc__': None, '__package__': None, '__loader__': <SourceFileLoader(name='__main__', path='sleepLoop.py') at remote 0x7ffff7805f60>, '__spec__': None, '__annotations__': {}, '__builtins__': <module at remote 0x7ffff78cac28>, '__file__': 'sleepLoop.py', '__cached__': None, 'time': <module at remote 0x7ffff77d5c28>, 'main': <function at remote 0x7ffff78411e0>, 'foo': <function at remote 0x7ffff7731c80>, 'bar': <function at remote 0x7ffff7731d08>},

    locals={'__name__': '__main__', '__doc__': None, '__package__': None, '__loader__': <SourceFileLoader(name='__main__', path='sleepLoop.py') at remote 0x7ffff7805f60>, '__spec__': None, '__annotations__': {}, '__builtins__': <module at remote 0x7ffff78cac28>, '__file__': 'sleepLoop.py', '__cached__': None, 'time': <module at remote 0x7ffff77d5c28>, 'main': <function at remote 0x7ffff78411e0>, 'foo': <function at remote 0x7ffff7731c80>, 'bar': <function at remote 0x7ffff7731d08>}, flags=<optimized out>, arena=<optimized out>) at ../Python/pythonrun.c:1035

#27 0x0000000000630d97 in PyRun_FileExFlags (fp=0x92e490, filename_str=<optimized out>, start=<optimized out>,

    globals={'__name__': '__main__', '__doc__': None, '__package__': None, '__loader__': <SourceFileLoader(name='__main__', path='sleepLoop.py') at remote 0x7ffff7805f60>, '__spec__': None, '__annotations__': {}, '__builtins__': <module at remote 0x7ffff78cac28>, '__file__': 'sleepLoop.py', '__cached__': No--Type <RET> for more, q to quit, c to continue without paging--

ne, 'time': <module at remote 0x7ffff77d5c28>, 'main': <function at remote 0x7ffff78411e0>, 'foo': <function at remote 0x7ffff7731c80>, 'bar': <function at remote 0x7ffff7731d08>},

    locals={'__name__': '__main__', '__doc__': None, '__package__': None, '__loader__': <SourceFileLoader(name='__main__', path='sleepLoop.py') at remote 0x7ffff7805f60>, '__spec__': None, '__annotations__': {}, '__builtins__': <module at remote 0x7ffff78cac28>, '__file__': 'sleepLoop.py', '__cached__': None, 'time': <module at remote 0x7ffff77d5c28>, 'main': <function at remote 0x7ffff78411e0>, 'foo': <function at remote 0x7ffff7731c80>, 'bar': <function at remote 0x7ffff7731d08>}, closeit=1, flags=0x7fffffffe2ac) at ../Python/pythonrun.c:988

#28 0x00000000006319ff in PyRun_SimpleFileExFlags (fp=0x92e490, filename=<optimized out>, closeit=1, flags=0x7fffffffe2ac) at ../Python/pythonrun.c:429

#29 0x000000000065432e in pymain_run_file (p_cf=0x7fffffffe2ac, filename=<optimized out>, fp=0x92e490) at ../Modules/main.c:427

#30 pymain_run_filename (cf=0x7fffffffe2ac, pymain=0x7fffffffe380) at ../Modules/main.c:1627

#31 pymain_run_python (pymain=0x7fffffffe380) at ../Modules/main.c:2877

#32 pymain_main (pymain=<optimized out>, pymain=<optimized out>) at ../Modules/main.c:3038

#33 0x000000000065468e in _Py_UnixMain (argc=<optimized out>, argv=<optimized out>) at ../Modules/main.c:3073

#34 0x00007ffff7be209b in __libc_start_main (main=0x4bc560 <main>, argc=2, argv=0x7fffffffe4c8, init=<optimized out>, fini=<optimized out>,

    rtld_fini=<optimized out>, stack_end=0x7fffffffe4b8) at ../csu/libc-start.c:308

#35 0x00000000005e0e8a in _start () at ../Modules/main.c:797
Managed Code Exception (Scala) and Managed Stack Trace (Scala)
We extend our memory analysis patterns to managed platforms other than .NET. We chose Scala as our modeling language, we have experience with for the last 3 years. The first analysis patterns we choose to extend are Managed Code Exception and Managed Stack Trace which are exceptions and stack traces from some virtual machine execution, not native platform exceptions and stack traces. To model it we created the following application:
package org.dumpanalysis.patterns.memory

@main def helloCrash: Int =
  foo

def foo: Int =
  bar

def bar: Int =
  val ref: Option[Int] = None
  ref.get
When executing the resulting project we got this exception and its stack trace:
java.util.NoSuchElementException: None.get
        at scala.None$.get(Option.scala:627)
        at scala.None$.get(Option.scala:626)
        at org.dumpanalysis.patterns.memory.Main$package$.bar(Main.scala:11)
        at org.dumpanalysis.patterns.memory.Main$package$.foo(Main.scala:7)
        at org.dumpanalysis.patterns.memory.Main$package$.helloCrash(Main.scala:4)
        at org.dumpanalysis.patterns.memory.helloCrash.main(Main.scala:3)
        at java.base/jdk.internal.reflect.NativeMethodAccessorImpl.invoke0(Native Method)
        at java.base/jdk.internal.reflect.NativeMethodAccessorImpl.invoke(NativeMethodAccessorImpl.java:77)
        at java.base/jdk.internal.reflect.DelegatingMethodAccessorImpl.invoke(DelegatingMethodAccessorImpl.java:43)
        at java.base/java.lang.reflect.Method.invoke(Method.java:568)
        at dotty.tools.runner.RichClassLoader$.run$extension$$anonfun$1(ScalaClassLoader.scala:36)
        at dotty.tools.runner.ScalaClassLoader$.asContext(ScalaClassLoader.scala:80)
        at dotty.tools.runner.RichClassLoader$.dotty$tools$runner$RichClassLoader$$$
asContext$extension(ScalaClassLoader.scala:18)
        at dotty.tools.runner.RichClassLoader$.run$extension(ScalaClassLoader.scala:36)
        at dotty.tools.runner.CommonRunner.run(ObjectRunner.scala:23)
        at java.base/jdk.internal.reflect.NativeMethodAccessorImpl.invoke(NativeMethodAccessorImpl.java:77)
        at java.base/jdk.internal.reflect.DelegatingMethodAccessorImpl.invoke(DelegatingMethodAccessorImpl.java:43)
        at java.base/java.lang.reflect.Method.invoke(Method.java:568)
        at coursier.bootstrap.launcher.a.a(Unknown Source)
        at coursier.bootstrap.launcher.Launcher.main(Unknown Source)
Memory Dump Analysis Anthology, Volume 15
The following direct links can be used to order the book now:
Available in PDF format from Software Diagnostics Technology and Services
Available in PDF format from Leanpub
Available in premium color paperback format from Amazon and Barnes & Noble
Available in Kindle print replica format from Amazon
The book is also included in the following training courses, training packs, and reference sets:
Memory Dump Analysis Anthology Volume Set (Diagnomicon)
Advanced Windows Memory Dump Analysis with Data Structures
Pattern-Oriented Software Diagnostics and Anomaly Detection Reference Set
Pattern-Oriented Windows Victimware Analysis Training Pack
Pattern-Oriented Windows Crash Dump Analysis Training Pack
Pattern-Oriented Windows Memory Forensics Training Pack
Windows Memory Dump Analysis for Endpoint Security Training Pack
Pattern-Oriented Complete Windows Memory Dump Analysis Training Pack
Complete Pattern-Oriented Software Diagnostics Training Pack
This reference volume consists of revised, edited, cross-referenced, and thematically organized selected articles from Software Diagnostics Institute (DumpAnalysis.org + TraceAnalysis.org) and Software Diagnostics Library (former Crash Dump Analysis blog, DumpAnalysis.org/blog) about software diagnostics, root cause analysis, debugging, crash and hang dump analysis, software trace and log analysis written from 15 August 2021 to 14 April 2023 for software engineers developing and maintaining products on Windows platforms, quality assurance engineers testing software, technical support, DevOps and DevSecOps, escalation and site reliability engineers dealing with complex software issues, security and vulnerability researchers, reverse engineers, malware and memory forensics analysts. This volume is fully cross-referenced with volumes 1 – 14 and features:
- 11 new crash dump analysis patterns
- New crash dump analysis case study
- 21 new software trace and log analysis patterns
- New software diagnostics architecture pattern
- Introduction to systematic software diagnostics
- Introduction to using Dia|gram language in memory dump analysis
- Introduction to traces and logs as 2-categories
- Introduction to a broad program for diagnostics of artificial intelligence
- Lists of recommended books
Product information:
- Title: Memory Dump Analysis Anthology, Volume 15
- Authors: Dmitry Vostokov, Software Diagnostics Institute
- Language: English
- Product Dimensions: 22.86 x 15.24
- Paperback: 291 pages
- Publisher: OpenTask (April 2023)
- ISBN-13: 978-1-912636-15-0

Trace, Log, Text, Narrative, Data: An Analysis Pattern Reference for Information Mining, Diagnostics, Anomaly Detection
The following direct links can be used to order the book now:
Available in PDF and ultra-premium color paperback formats from Software Diagnostics Technology and Services
Available in PDF format from Leanpub
Available in ultra-premium color paperback format from Amazon
Available in Kindle print replica format from Amazon
The book is also included in the following training packs and reference sets:
Encyclopedia of Software Diagnostic Analysis Patterns
Pattern-Oriented Software Diagnostics and Anomaly Detection Reference Set
Pattern-Oriented Trace and Log Analysis Training Pack
Pattern-Oriented Malware Analysis Training Pack
Complete Pattern-Oriented Software Diagnostics Training Pack
General trace and log analysis patterns allow the application of uniform diagnostics and anomaly detection across diverse software environments. This pattern language covers any execution artifact from a small debugging trace to a distributed log with billions of messages from hundreds of computers, thousands of software components, threads, and processes. Pattern-oriented trace and log analysis is applicable to troubleshooting and debugging Windows, macOS, Linux, FreeBSD, Android, iOS, z/OS, and any other possible computer platform, including networking and IoT. Its pattern catalog is a part of pattern-oriented software data analysis, diagnostics, anomaly detection, forensics, prognostics, root cause analysis, and debugging developed by Software Diagnostics Institute. Also, the scope of applicability of such analysis patterns is much wider than just software execution artifacts or temporal data and now includes general data, narratives, text, and image analysis (space-like narratology). This reference reprints with corrections almost 230 patterns originally published in Memory Dump Analysis Anthology volumes 3 - 14 and Software Diagnostics Library. It also includes additional 19 analysis patterns from the forthcoming volume 15, bringing the total analysis pattern count to 229. Full-color diagrams accompany almost all pattern descriptions. The fifth edition includes 28 more patterns, updated diagram pictures, classification, and the list of narratological and mathematical influences, and now includes the long-awaited introduction and two new appendixes.
Product information:
- Title: Trace, Log, Text, Narrative, Data: An Analysis Pattern Reference for Information Mining, Diagnostics, Anomaly Detection, Fifth Edition
- Authors: Dmitry Vostokov, Software Diagnostics Institute
- Language: English
- Product Dimensions: 21.6 x 14.0
- Paperback: 400 pages
- Publisher: OpenTask (March 2023)
- ISBN-13: 978-1912636587
Diagnostics of Artificial Intelligence

If wrong labels are ML bugs, then wrong answers are ML crashes.
We propose to define Diagnostics of AI as a combination of ideas and approaches from different disciplines such as software engineering, computer science, mathematics, physics, chemistry, biology, literary theory and criticism, narratology, semiotics, humanities, sociology, medicine, forensic science, psychology, psychiatry, and psychopathology with the following main directions of our research activities:
- Pattern-Oriented Software Diagnostics and Data Analysis
- Systemic Software Diagnostics
- Software Narratology
- Software Pathology
It is also important to differentiate diagnostics of artificial intelligence from diagnostics of artificial intelligence systems which is just software and hardware diagnostics, where diagnostics of AI may be just a part. Diagnostics of AI systems is metaphorically like medicine, whereas diagnostics of AI is like psychiatry and psychopathology.
We also organized a few groups for information sharing, such as relevant books and articles:
LinkedIn Diagnostics of Artificial Intelligence group
Facebook Diagnostics of Artificial Intelligence group
Traces and Logs as 2-categories
In the past, we looked at software traces and logs as semigroups or monoids as a single object category. In the latter case, the monoid object is a trace or log, and arrows (morphisms) are trace and log messages.
Dia|gram Language and Memory Dump Analysis Patterns
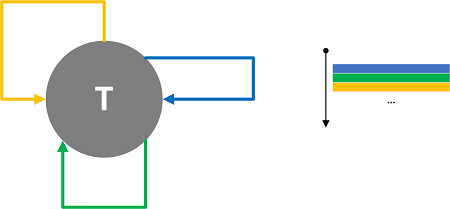
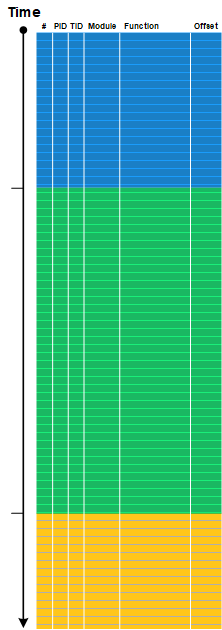
We illustrate trace and log analysis patterns using a graphical language named Dia|gram. When we analyze memory dumps, we get textual log output to which we can apply the same analysis patterns. Therefore, we can reuse the same Dia|gram language for memory dump analysis, for example, for analysis pattern illustrations. We start with the first memory dump analysis pattern, Multiple Exceptions. However, we now use some later analysis pattern names in the latter's description, for example, Stack Trace Collection from multiple threads, which consists of Stack Traces from individual threads.
Each individual thread stack trace can be illustrated using this trace diagram with an implicit time arrow but without time values:

If we knew individual stack trace frame timings, we could have assembled the normal trace diagram:
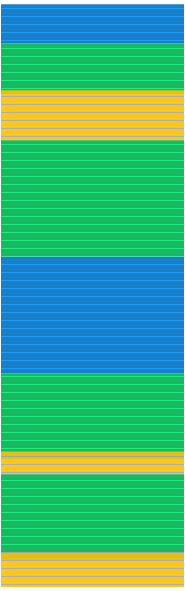
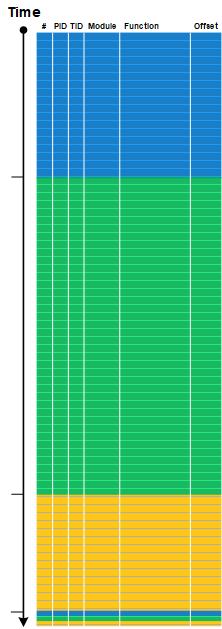
However, we can assemble the combined trace by gluing individual thread traces and sorting them by thread creation time (available in Windows memory dumps):
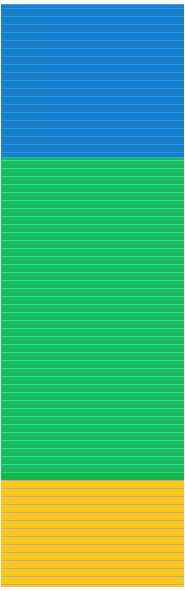
Additionally, we can impose sparse discrete time labels and structure via Trace Schema:
Having ATIDs, we can use the Adjoint Thread of Activity analysis pattern.
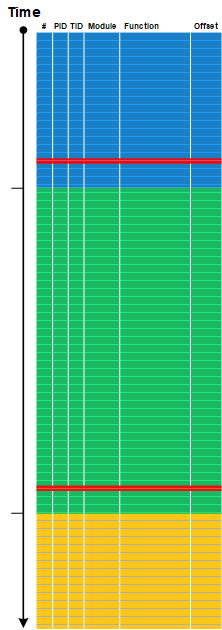
Since we know that top frames existed at the time of the memory snapshot, we can also group them at the end of the trace:
Exception indicators (like exception processing frames) can be highlighted as Error Message and Periodic Error. We can also use Exception Stack Trace:
We can also add other debugger log output to such diagrams for Intra-Correlation.
We now start using Dia|gram in our memory dump analysis training courses and reference materials.
Book: Accelerated macOS Core Dump Analysis, Third Edition
The following direct links can be used to order the book now:
Available in PDF with the optional recording and Memory Dump Analysis Anthology from Software Diagnostics Technology and Services
Available in PDF format from Leanpub
Available in ultra-premium color paperback format from Amazon and Barnes & Noble
Available in Kindle print replica format from Amazon
The book is also included in the following training packs:
Pattern-Oriented Unix Memory Dump Analysis Training Pack
Pattern-Oriented Memory Dump Analysis Training Pack
Complete Pattern-Oriented Software Diagnostics Training Pack
The full transcript of Software Diagnostics Services training with 12 step-by-step exercises. Learn how to analyze app crashes and freezes, navigate through process core memory dump space and diagnose corruption, memory leaks, CPU spikes, blocked threads, deadlocks, wait chains, and much more. We use a unique and innovative pattern-driven analysis approach to speed up the learning curve. The training consists of practical step-by-step exercises using Xcode and LLDB environments, highlighting more than 30 analysis patterns from Software Diagnostics Institute diagnosed in ARM64 process core memory dumps. The training also includes an overview of relevant similarities and differences between Windows and macOS user space memory dump analysis useful for engineers with a Wintel background and the relevant ARM64 disassembly tutorial. The course is thoroughly updated for the latest macOS version and M2 platform. The primary audience for this training is software technical support and escalation engineers who analyze crash reports and memory dumps, quality assurance and software engineers who test and debug macOS software, security and vulnerability researchers, and malware and memory forensics analysts who have never used LLDB for the analysis of computer memory.
- Title: Accelerated macOS Core Dump Analysis, Third Edition: Training Course Transcript with LLDB Practice Exercises
- Authors: Dmitry Vostokov, Software Diagnostics Services
- Publisher: OpenTask (December 2022)
- Language: English
- Product Dimensions: 28.0 x 21.6
- PDF: 250 pages
- ISBN-13: 978-1912636754
Table of Contents and Sample Exercise
Slides from the training
Pattern-Oriented Memory Forensics
The following direct links can be used to order the book now:
Available in PDF format from Leanpub
Available in ultra-premium color paperback format from Amazon and Barnes & Noble
Available in Kindle print replica format from Amazon
The book is also included in the following training courses, training packs, and reference sets:
Accelerated Windows Memory Forensics and Malware Analysis with Memory Dumps
Pattern-Oriented Windows Memory Forensics Training Pack
Pattern-Oriented Software Diagnostics and Anomaly Detection Reference Set
Pattern-Oriented Windows Memory Forensics Training Pack
Principles of Memory Dump Analysis: The Collected Seminars
Complete Pattern-Oriented Software Diagnostics Training Pack
This short book is a fully revised transcript of a lecture introducing a pattern language for memory forensics - an investigation of past software behavior in memory snapshots. It provides a unified language for discussing and communicating detection and analysis results despite the proliferation of operating systems and tools, a base language for checklists, and aid in accelerated learning. The lecture has a short theoretical part and then illustrates various patterns seen in crash dumps by using WinDbg debugger from Microsoft Debugging Tools for Windows.
- Title: Pattern-Oriented Memory Forensics: A Pattern Language Approach, Revised Edition
- Author: Dmitry Vostokov, Software Diagnostics Institute, Software Diagnostics Services
- Publisher: OpenTask (October 2022)
- Language: English
- Product Dimensions: 28.0 x 21.6
- Paperback: 97 pages
- ISBN-13: 978-1912636761
Book: Accelerated Windows Malware Analysis with Memory Dumps, Third Edition
The following direct links can be used to order the book now:
Available in PDF format with the recording and optional Memory Dump Analysis Anthology from Software Diagnostics Technology and Services
Available in PDF format from Leanpub
Available in ultra-premium color paperback format from Amazon
Available in Kindle print replica format from Amazon
The book is also included in the following training packs:
WinDbg Training Pack
Accelerated Windows Memory Forensics and Malware Analysis with Memory Dumps
Pattern-Oriented Malware Analysis Training Pack
Pattern-Oriented Windows Victimware Analysis Training Pack
Pattern-Oriented Windows Memory Forensics Training Pack
Windows Memory Dump Analysis for Endpoint Security Training Pack
Complete Pattern-Oriented Software Diagnostics Training Pack
The Korean second edition is available from Acorn publisher
The full transcript of Software Diagnostics Services training. Learn how to navigate process, kernel, and physical spaces and diagnose various malware patterns in Windows memory dump files. The course uses a unique and innovative pattern-oriented analysis approach to speed up the learning curve. The training consists of practical step-by-step hands-on exercises using WinDbg, process, kernel and complete memory dumps. Covered more than 20 malware analysis patterns. The main audience is software technical support and escalation engineers who analyze memory dumps from complex software environments and need to check for possible malware presence in cases of abnormal software behavior. The course will also be useful for software engineers, quality assurance and software maintenance engineers, security researchers, malware and memory forensics analysts who have never used WinDbg for analysis of computer memory. The third edition uses the latest WinDbg Preview version with some exercises updated to Windows 11 and is optionally containerized.
- Title: Accelerated Windows Malware Analysis with Memory Dumps: Training Course Transcript and WinDbg Practice Exercises, Third Edition
- Authors: Dmitry Vostokov, Software Diagnostics Services
- Publisher: OpenTask (July 2022)
- Language: English
- Product Dimensions: 28.0 x 21.6
- PDF: 324 pages
- ISBN-13: 978-1912636969