Multiple Exceptions (user mode) - Modeling Example
 Multiple Exceptions (kernel mode)
 Multiple Exceptions (managed space)
- Multiple Exceptions (stowed)
 Dynamic Memory Corruption (process heap)
 Dynamic Memory Corruption (kernel pool)
- Dynamic Memory Corruption (managed heap)
 False Positive Dump
 Lateral Damage (general)
- Lateral Damage (CPU mode)
 Optimized Code (function parameter reuse)
 Invalid Pointer (general)
- Invalid Pointer (objects)
 NULL Pointer (code)
 NULL Pointer (data)
 Inconsistent Dump
 Hidden Exception (user space)
- Hidden Exception (kernel space)
- Hidden Exception (managed space)
 Deadlock (critical sections)
 Deadlock (executive resources)
 Deadlock (mixed objects, user space)
 Deadlock (LPC)
 Deadlock (mixed objects, kernel space)
 Deadlock (self)
- Deadlock (managed space)
- Deadlock (.NET Finalizer)
 Changed Environment
 Incorrect Stack Trace
 OMAP Code Optimization
 No Component Symbols
 Insufficient Memory (committed memory)
 Insufficient Memory (handle leak)
 Insufficient Memory (kernel pool)
 Insufficient Memory (PTE)
 Insufficient Memory (module fragmentation)
 Insufficient Memory (physical memory)
 Insufficient Memory (control blocks)
- Insufficient Memory (reserved virtual memory)
- Insufficient Memory (session pool)
- Insufficient Memory (stack trace database)
- Insufficient Memory (region)
- Insufficient Memory (stack)
 Spiking Thread
 Module Variety
 Stack Overflow (kernel mode)
 Stack Overflow (user mode)
 Stack Overflow (software implementation)
- Stack Overflow (insufficient memory)
- Stack Overflow (managed space)
 Managed Code Exception
- Managed Code Exception (Scala)
- Managed Code Exception (Python)
 Truncated Dump
 Waiting Thread Time (kernel dumps)
 Waiting Thread Time (user dumps)
 Memory Leak (process heap) - Modeling Example
 Memory Leak (.NET heap)
- Memory Leak (page tables)
- Memory Leak (I/O completion packets)
- Memory Leak (regions)
 Missing Thread (user space)
- Missing Thread (kernel space)
 Unknown Component
 Double Free (process heap)
 Double Free (kernel pool)
 Coincidental Symbolic Information
 Stack Trace
- Stack Trace (I/O request)
- Stack Trace (file system filters)
- Stack Trace (database)
- Stack Trace (I/O devices)
 Virtualized Process (WOW64)
- Virtualized Process (ARM64EC and CHPE)
 Stack Trace Collection (unmanaged space)
- Stack Trace Collection (managed space)
- Stack Trace Collection (predicate)
- Stack Trace Collection (I/O requests)
- Stack Trace Collection (CPUs)
 Coupled Processes (strong)
 Coupled Processes (weak)
 Coupled Processes (semantics)
 High Contention (executive resources)
 High Contention (critical sections)
 High Contention (processors)
- High Contention (.NET CLR monitors)
- High Contention (.NET heap)
- High Contention (sockets)
 Accidental Lock
 Passive Thread (user space)
 Passive System Thread (kernel space)
 Main Thread
 Busy System
 Historical Information
 Object Distribution Anomaly (IRP)
- Object Distribution Anomaly (.NET heap)
 Local Buffer Overflow (user space)
- Local Buffer Overflow (kernel space)
 Early Crash Dump
 Hooked Functions (user space)
 Hooked Functions (kernel space)
- Hooked Modules
 Custom Exception Handler (user space)
 Custom Exception Handler (kernel space)
 Special Stack Trace
 Manual Dump (kernel)
 Manual Dump (process)
 Wait Chain (general)
 Wait Chain (critical sections)
 Wait Chain (executive resources)
 Wait Chain (thread objects)
 Wait Chain (LPC/ALPC)
 Wait Chain (process objects)
 Wait Chain (RPC)
 Wait Chain (window messaging)
 Wait Chain (named pipes)
- Wait Chain (mutex objects)
- Wait Chain (pushlocks)
- Wait Chain (CLR monitors)
- Wait Chain (RTL_RESOURCE)
- Wait Chain (modules)
- Wait Chain (nonstandard synchronization)
- Wait Chain (C++11, condition variable)
- Wait Chain (SRW lock)
 Corrupt Dump
 Dispatch Level Spin
 No Process Dumps
 No System Dumps
 Suspended Thread
 Special Process
 Frame Pointer Omission
 False Function Parameters
 Message Box
 Self-Dump
 Blocked Thread (software)
 Blocked Thread (hardware)
- Blocked Thread (timeout)
 Zombie Processes
 Wild Pointer
 Wild Code
 Hardware Error
 Handle Limit (GDI, kernel space)
- Handle Limit (GDI, user space)
 Missing Component (general)
 Missing Component (static linking, user mode)
 Execution Residue (unmanaged space, user)
- Execution Residue (unmanaged space, kernel)
- Execution Residue (managed space)
 Optimized VM Layout
- Invalid Handle (general)
- Invalid Handle (managed space)
- Overaged System
- Thread Starvation (realtime priority)
- Thread Starvation (normal priority)
- Duplicated Module
- Not My Version (software)
- Not My Version (hardware)
- Data Contents Locality
- Nested Exceptions (unmanaged code)
- Nested Exceptions (managed code)
- Affine Thread
- Self-Diagnosis (user mode)
- Self-Diagnosis (kernel mode)
- Self-Diagnosis (registry)
- Inline Function Optimization (unmanaged code)
- Inline Function Optimization (managed code)
- Critical Section Corruption
- Lost Opportunity
- Young System
- Last Error Collection
- Hidden Module
- Data Alignment (page boundary)
- C++ Exception
- Divide by Zero (user mode)
- Divide by Zero (kernel mode)
- Swarm of Shared Locks
- Process Factory
- Paged Out Data
- Semantic Split
- Pass Through Function
- JIT Code (.NET)
- JIT Code (Java)
- Ubiquitous Component (user space)
- Ubiquitous Component (kernel space)
- Nested Offender
- Virtualized System
- Effect Component
- Well-Tested Function
- Mixed Exception
- Random Object
- Missing Process
- Platform-Specific Debugger
- Value Deviation (stack trace)
- Value Deviation (structure field)
- Runtime Thread (CLR)
- Runtime Thread (Python, Linux)
- Coincidental Frames
- Fault Context
- Hardware Activity
- Incorrect Symbolic Information
- Message Hooks - Modeling Example
- Coupled Machines
- Abridged Dump
- Exception Stack Trace
- Distributed Spike
- Instrumentation Information
- Template Module
- Invalid Exception Information
- Shared Buffer Overwrite
- Pervasive System
- Problem Exception Handler
- Same Vendor
- Crash Signature
- Blocked Queue (LPC/ALPC)
- Fat Process Dump
- Invalid Parameter (process heap)
- Invalid Parameter (runtime function)
- String Parameter
- Well-Tested Module
- Embedded Comment
- Hooking Level
- Blocking Module
- Dual Stack Trace
- Environment Hint
- Top Module
- Livelock
- Technology-Specific Subtrace (COM interface invocation)
- Technology-Specific Subtrace (dynamic memory)
- Technology-Specific Subtrace (JIT .NET code)
- Technology-Specific Subtrace (COM client call)
- Dialog Box
- Instrumentation Side Effect
- Semantic Structure (PID.TID)
- Directing Module
- Least Common Frame
- Truncated Stack Trace
- Data Correlation (function parameters)
- Data Correlation (CPU times)
- Module Hint
- Version-Specific Extension
- Cloud Environment
- No Data Types
- Managed Stack Trace
- Managed Stack Trace (Scala)
- Managed Stack Trace (Python)
- Coupled Modules
- Thread Age
- Unsynchronized Dumps
- Pleiades
- Quiet Dump
- Blocking File
- Problem Vocabulary
- Activation Context
- Stack Trace Set
- Double IRP Completion
- Caller-n-Callee
- Annotated Disassembly (JIT .NET code)
- Annotated Disassembly (unmanaged code)
- Handled Exception (user space)
- Handled Exception (.NET CLR)
- Handled Exception (kernel space)
- Duplicate Extension
- Special Thread (.NET CLR)
- Hidden Parameter
- FPU Exception
- Module Variable
- System Object
- Value References
- Debugger Bug
- Empty Stack Trace
- Problem Module
- Disconnected Network Adapter
- Network Packet Buildup
- Unrecognizable Symbolic Information
- Translated Exception
- Regular Data
- Late Crash Dump
- Blocked DPC
- Coincidental Error Code
- Punctuated Memory Leak
- No Current Thread
- Value Adding Process
- Activity Resonance
- Stored Exception
- Spike Interval
- Stack Trace Change
- Unloaded Module
- Deviant Module
- Paratext
- Incomplete Session
- Error Reporting Fault
- First Fault Stack Trace
- Frozen Process
- Disk Packet Buildup
- Hidden Process
- Active Thread (Mac OS X)
- Active Thread (Windows)
- Critical Stack Trace
- Handle Leak
- Module Collection
- Module Collection (predicate)
- Deviant Token
- Step Dumps
- Broken Link
- Debugger Omission
- Glued Stack Trace
- Reduced Symbolic Information
- Injected Symbols
- Distributed Wait Chain
- One-Thread Process
- Module Product Process
- Crash Signature Invariant
- Small Value
- Shared Structure
- Thread Cluster
- False Effective Address
- Screwbolt Wait Chain
- Design Value
- Hidden IRP
- Tampered Dump
- Memory Fluctuation (process heap)
- Last Object
- Rough Stack Trace (unmanaged space)
- Rough Stack Trace (managed space)
- Past Stack Trace
- Ghost Thread
- Dry Weight
- Exception Module
- Reference Leak
- Origin Module
- Hidden Call
- Corrupt Structure
- Software Exception
- Crashed Process
- Variable Subtrace
- User Space Evidence
- Internal Stack Trace
- Distributed Exception (managed code)
- Thread Poset
- Stack Trace Surface
- Hidden Stack Trace
- Evental Dumps
- Clone Dump
- Parameter Flow
- Critical Region
- Diachronic Module
- Constant Subtrace
- Not My Thread
- Window Hint
- Place Trace
- Stack Trace Signature
- Relative Memory Leak
- Quotient Stack Trace
- Module Stack Trace
- Foreign Module Frame
- Unified Stack Trace
- Mirror Dump Set
- Memory Fibration
- Aggregated Frames
- Frame Regularity
- Stack Trace Motif
- System Call
- Stack Trace Race
- Hyperdump
- Disassembly Ambiguity
- Exception Reporting Thread
- Active Space
- Subsystem Modules
- Region Profile
- Region Clusters
- Source Stack Trace
- Hidden Stack
- Interrupt Stack
- False Memory
- Frame Trace
- Pointer Cone
- Context Pointer
- Pointer Class
- False Frame
- Procedure Call Chain
- C++ Object
- COM Exception
- Structure Sheaf
- Saved Exception Context (.NET)
- Shared Thread
- Spiking Interrupts
- Structure Field Collection
- Black Box
- Rough Stack Trace Collection (unmanaged space)
- COM Object
- Shared Page
- Exception Collection
- Dereference Nearpoint
- Address Representations
- Near Exception
- Shadow Stack Trace
- Past Process
- Foreign Stack
- Annotated Stack Trace
- Disassembly Summary
- Region Summary
- Analysis Summary
- Region Spectrum
- Normalized Region
- Function Pointer
- Interrupt Stack Collection
- DPC Stack Collection
- Dump Context
- False Local Address
- Encoded Pointer
- Latent Structure
- ISA-Specific Code
Memory Dump and Live Memory Visualization and Picture Extraction
NEW! The updated version of Dump2Picture is available: http://www.dumpanalysis.org/dump2picture
This is a reprint of several articles with permission from Memory Dump Analysis Anthology, Volume 1.
As the first step towards Memory Dump Tomography (Memory Dump Analysis Anthology, Volume 1, page 522) we created a small program that interprets a memory dump as a picture. We can visualize crash dumps with it. The tool is available for free download.
Simply run it from the command prompt and specify full paths to a dump file and an output BMP file. The memory dump file will be converted by default into true color, 32 bits-per-pixel bitmap. We can specify other values: 8, 16 and 24.
C:\Dump2Picture>Dump2Picture.exe

Dump2Picture version 1.0

Written by Dmitry Vostokov, 2007

Usage: Dump2Picture dumpfile bmpfile [8|16|24|32]
For example:
C:\Dump2Picture>Dump2Picture.exe MEMORY.DMP MEMORY.BMP 8

Dump2Picture version 1.0

Written by Dmitry Vostokov, 2007

MEMORY.BMP

MEMORY.DMP

        1 file(s) copied.
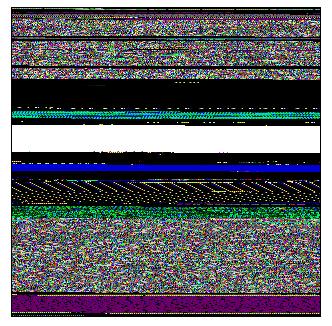
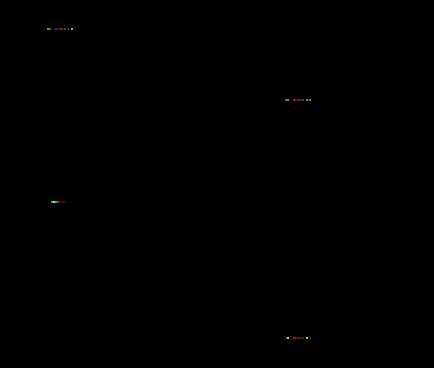
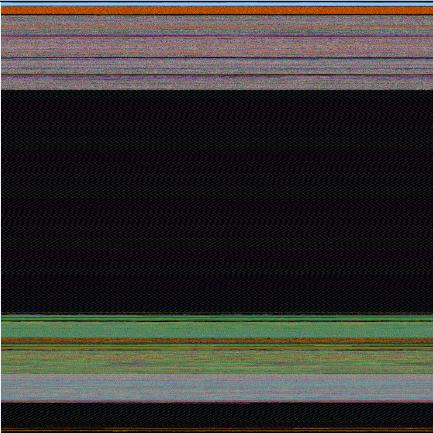
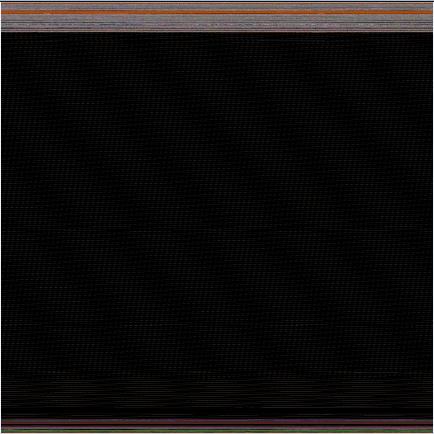
Below are some screenshots of bitmap files created by the tool. We can think about them as visualized kernel or user address spaces.
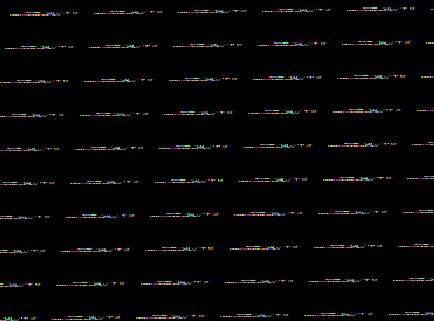
Vista kernel memory dump (8 bits-per-pixel):

Vista kernel memory dump (16 bits-per-pixel):

Vista kernel memory dump (24 bits-per-pixel):

Vista kernel memory dump (32 bits-per-pixel):

Notepad process user memory dump (8 bits-per-pixel):

Notepad process user memory dump (16 bits-per-pixel):

Notepad process user memory dump (24 bits-per-pixel):

Notepad process user memory dump (32 bits-per-pixel):

Mspaint process user memory dump (32 bits-per-pixel):

Mspaint process user memory dump after loading "Toco Toucan.jpg" from Vista Sample Pictures folder (32 bits-per-pixel):

Dump2Picture can be used to explore memory leaks visually. We created the following small program in Visual C++ that leaks 64Kb every second:
#include "stdafx.h"
#include <windows.h>
int _tmain(int argc, _TCHAR* argv[])
{
  while (true)
  {
    printf("%x\n", (UINT_PTR)malloc(0xFFFF));
    Sleep(1000);
  }
  return 0;
}
Then we sampled 3 dumps at 7Mb, 17Mb and 32Mb process virtual memory size and converted them as 16 bits-per-pixel bitmaps. On the pictures below we can see that the middle black memory area grows significantly. Obviously malloc function allocates zeroed memory and therefore we see black color.
7Mb process memory dump:

17Mb process memory dump:

32Mb process memory dump:

If we zoom in the black area we would see the following pattern:
Colored lines inside are heap control structures that are created for every allocated block of memory. If this is correct then allocating smaller memory blocks would create a hatched pattern. And this is true indeed. The following program leaks 256 byte memory blocks:
#include "stdafx.h"
#include <windows.h>

int _tmain(int argc, _TCHAR* argv[])
{
  while (true)
  {
    printf("%x\n", (UINT_PTR)malloc(0xFF));
    Sleep(1000/0xFF);
  }
  return 0;
}
The corresponding process memory picture and zoomed heap area are the following:


Making allocations 4 times smaller makes heap area to look hatched, and zoomed picture is more densely packed by heap control structures:
#include "stdafx.h"
#include <windows.h>

int _tmain(int argc, _TCHAR* argv[])
{
  while (true)
  {
    printf("%x\n", (UINT_PTR)malloc(0xFF/4));
    Sleep((1000/0xFF)/4);
  }
  return 0;
}

Here is another example. One service was increasing its memory constantly. The crash dump picture shows huge hatched dark region in the middle:
and if we zoom in this region:
Because the pattern and allocation size look uniform it could be the true heap memory leak for some operation that allocates constant size buffers. After opening the dump and looking at heap segments that had grown the most we see the same allocation size indeed:
0:000> !.\w2kfre\ntsdexts.heap -h 5

HEAPEXT: Unable to get address of NTDLL!NtGlobalFlag.

Index   Address  Name      Debugging options enabled

1:   00140000

2:   00240000

3:   00310000

4:   00330000

5:   00370000

Segment at 00370000 to 00380000 (00010000 bytes committed)

Segment at 01680000 to 01780000 (00100000 bytes committed)

Segment at 019C0000 to 01BC0000 (00200000 bytes committed)

Segment at 01BC0000 to 01FC0000 (00400000 bytes committed)

Segment at 01FC0000 to 027C0000 (00800000 bytes committed)

    Segment at 027C0000 to 037C0000 (01000000 bytes committed)

Segment at 037C0000 to 057C0000 (02000000 bytes committed)

Segment at 057C0000 to 097C0000 (00155000 bytes committed)

...

...

...

057B96E0: 01048 . 01048 [07] - busy (1030), tail fill

057BA728: 01048 . 01048 [07] - busy (1030), tail fill

057BB770: 01048 . 01048 [07] - busy (1030), tail fill

057BC7B8: 01048 . 01048 [07] - busy (1030), tail fill

057BD800: 01048 . 01048 [07] - busy (1030), tail fill

057BE848: 01048 . 01048 [07] - busy (1030), tail fill

057BF890: 01048 . 00770 [14] free fill

Heap entries for Segment07 in Heap 370000

057C0040: 00040 . 01048 [07] - busy (1030), tail fill

057C1088: 01048 . 01048 [07] - busy (1030), tail fill

057C20D0: 01048 . 01048 [07] - busy (1030), tail fill

057C3118: 01048 . 01048 [07] - busy (1030), tail fill

057C4160: 01048 . 01048 [07] - busy (1030), tail fill

057C51A8: 01048 . 01048 [07] - busy (1030), tail fill

...

...

...
An alternative to converting memory dumps to picture files is to save a memory range to a binary file and then convert it to a BMP file. Thus we can view the particular DLL or driver mapped into address space, heap or pool region, including live memory:
To save a memory range to a file use WinDbg .writemem command:
.writemem d2p-range.bin 00800000 0085e000
or
.writemem d2p-range.bin 00400000 L20000
We wrote a WinDbg script that saves a specified memory range and then calls a shell script that automatically converts the saved binary file to a BMP file and then runs a picture viewer registered for .bmp extension.
The WinDbg script code (mempicture.txt):
.writemem d2p-range.bin ${$arg1} ${$arg2}
.if (${/d:$arg3})
{
  .shell -i- mempicture.cmd d2p-range ${$arg3}
}
.else
{
  .shell -i- mempicture.cmd d2p-range
}
The shell script (mempicture.cmd):
dump2picture %1.bin %1.bmp %2

%1.bmp
Because WinDbg installation folder is assumed to be the default directory for both scripts and Dump2Picture.exe they should be copied to the same folder where windbg.exe is located. On our system it is
C:\Program Files\Debugging Tools for Windows
Both scripts are now included in Dump2Picture package available for free download.
To call the script from WinDbg use the following command:
$$>a< mempicture.txt Range [bits-per-pixel]
where Range can be in Address1 Address2 or Address Lxxx format, bits-per-pixel can be 8, 16, 24 or 32. By default it is 32.
For example, we loaded a complete Windows x64 memory dump and visualized HAL (hardware abstraction layer) module:
kd> lm

start             end                 module name

fffff800`00800000 fffff800`0085e000   hal

fffff800`01000000 fffff800`0147b000   nt

fffff97f`ff000000 fffff97f`ff45d000   win32k

...

...

...
kd> $$>a< mempicture.txt fffff800`00800000 fffff800`0085e000

Writing 5e001 bytes...
C:\Program Files\Debugging Tools for Windows>dump2picture d2p-range.bin d2p-range.bmp
Dump2Picture version 1.1

Written by Dmitry Vostokov, 2007
d2p-range.bmp

d2p-range.bin

1 file(s) copied.
C:\Program Files\Debugging Tools for Windows>d2p-range.bmp

<.shell waiting 10 second(s) for process>

.shell: Process exited

kd>
and Windows Picture and Fax Viewer application was launched and displayed the following picture: