COM+ crash dumps
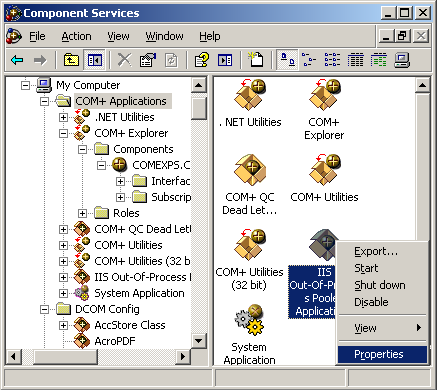
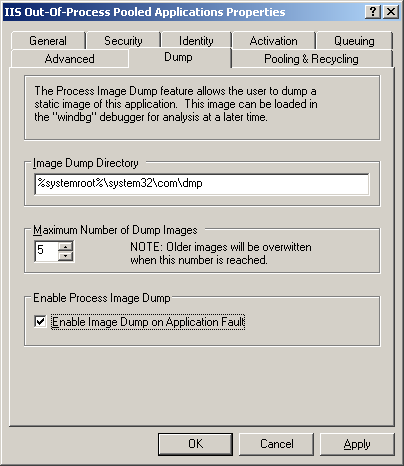
If you have problems with COM+ components you can configure Component Services in Control Panel to save a dump:
Refer to the following article for details:
http://msdn.microsoft.com/msdnmag/issues/01/08/ComXP/
If you want to use userdump.exe to save a crash dump when a failing COM+ application displays an error dialog box refer to the following article:
http://support.microsoft.com/kb/287643
If you want dumps to be automatically collected after some timeout value refer to the following article for details:
http://support.microsoft.com/kb/910904/
If you have an exception the following article describes how to get a stack trace from a saved process dump:
http://support.microsoft.com/kb/317317
This article explains how COM+ handles application faults:
Fault Isolation and Failfast Policy
Now I show how to get an error message that was written to event log when COM+ application was terminated due to a different error code than an access violation. If you get a dump from COM+ process look at all threads and find the one that runs through comsvcs.dll:
0:000> ~*k

...

...

...

6 Id: 8d4.1254 Suspend: 0 Teb: 7ffd9000 Unfrozen

ChildEBP RetAddr

0072ee30 7c822124 ntdll!KiFastSystemCallRet

0072ee34 77e6baa8 ntdll!NtWaitForSingleObject+0xc

0072eea4 77e6ba12 kernel32!WaitForSingleObjectEx+0xac

0072eeb8 75c2b250 kernel32!WaitForSingleObject+0x12

0072f340 75c2bb91 comsvcs!FF_RunCmd+0xa2

0072f60c 75c2bc76 comsvcs!FF_DumpProcess_MD+0x21a

0072f850 75c2be83 comsvcs!FF_DumpProcess+0x39

0072fdc0 75c2c351 comsvcs!FailFastStr+0x2ce

0072fe20 75bf31fa comsvcs!CError::WriteToLog+0x198

0072fe8c 75bf3d48 comsvcs!CSurrogateServices::FireApplicationLaunch+0x13b

0072fee0 75bf3e19 comsvcs!CApplication::AsyncApplicationLaunch+0x101

0072feec 7c81a3c5 comsvcs!CApplication::AppLaunchThreadProc+0x18

0072ff44 7c8200fc ntdll!RtlpWorkerCallout+0x71

0072ff64 7c81a3fa ntdll!RtlpExecuteWorkerRequest+0x4f

0072ff78 7c82017f ntdll!RtlpApcCallout+0x11

0072ffb8 77e66063 ntdll!RtlpWorkerThread+0x61

0072ffec 00000000 kernel32!BaseThreadStart+0x34

...

...

...
0:000> ~*kL

...

...

...

   6  Id: 8d4.1254 Suspend: 0 Teb: 7ffd9000 Unfrozen

ChildEBP RetAddr  Args to Child

0072ee30 7c822124 77e6baa8 00000394 00000000

ntdll!KiFastSystemCallRet

0072ee34 77e6baa8 00000394 00000000 00000000

ntdll!NtWaitForSingleObject+0xc

0072eea4 77e6ba12 00000394 ffffffff 00000000

kernel32!WaitForSingleObjectEx+0xac

0072eeb8 75c2b250 00000394 ffffffff 0072f640

kernel32!WaitForSingleObject+0x12

0072f340 75c2bb91 75b8e7fc 75b8e810 000008d4

comsvcs!FF_RunCmd+0xa2

0072f60c 75c2bc76 0072f640 75c6c5c0 0072fe44

comsvcs!FF_DumpProcess_MD+0x21a

0072f850 75c2be83 00000000 77ce21ce 0bd5f0f0

comsvcs!FF_DumpProcess+0×39

0072fdc0 75c2c351 75c6c5c0 75b8b008 00000142

comsvcs!FailFastStr+0×2ce

0072fe20 75bf31fa 0072fe44 75b8b008 00000142

comsvcs!CError::WriteToLog+0×198

0072fe8c 75bf3d48 0bcf5d0c 00000000 0bcf5cf8

comsvcs!CSurrogateServices::FireApplicationLaunch+0×13b

0072fee0 75bf3e19 75bf3e01 0072ff44 7c81a3c5

comsvcs!CApplication::AsyncApplicationLaunch+0×101

0072feec 7c81a3c5 0bcf5cf8 7c889880 0bcf5d50

comsvcs!CApplication::AppLaunchThreadProc+0×18

0072ff44 7c8200fc 75bf3e01 0bcf5cf8 00000000

ntdll!RtlpWorkerCallout+0×71

0072ff64 7c81a3fa 00000000 0bcf5cf8 0bcf5d50

ntdll!RtlpExecuteWorkerRequest+0×4f

0072ff78 7c82017f 7c8200bb 00000000 0bcf5cf8

ntdll!RtlpApcCallout+0×11

0072ffb8 77e66063 00000000 00000000 00000000

ntdll!RtlpWorkerThread+0×61

0072ffec 00000000 7c83ad38 00000000 00000000

kernel32!BaseThreadStart+0×34

…

…

…
FF_DumpProcess function is an indication that the process was being dumped. There is no ComSvcsExceptionFilter function on thread stack but we can still get an error message if we look at FailFastStr function arguments:
0:000> du 75c6c5c0 75c6c5c0+400

75c6c5c0  “{646F1874-46B6-4149-BD55-8C317FB”

75c6c600  “71CC0}….Server Application ID:”

75c6c640  ” {646F1874-46B6-4149-BD55-8C317F”

75c6c680  “B71CC0}..Server Application Inst”

75c6c6c0  “ance ID:..{7A39BC48-78DA-4FBB-A7″

75c6c700  “46-EEA7E42CDAC7}..Server Applica”

75c6c740  “tion Name: My Server”

75c6c780  “..The serious nature of this err”

75c6c7c0  “or has caused the process to ter”

75c6c800  “minate…Error Code = 0×80131600″

75c6c840  ” : ..COM+ Services Internals Inf”

75c6c880  “ormation:..File: d:\nt\com\compl”

75c6c8c0  “us\src\comsvcs\srgtapi\csrgtserv”

75c6c900  “.cpp, Line: 322..Comsvcs.dll fil”

75c6c940  “e version: ENU 2001.12.4720.2517″

75c6c980  ” shp”
Also if we examine parameters of FF_RunCmd call we would see what application was used to dump a process:
ChildEBP RetAddr Args to Child

0072f340 75c2bb91 75b8e7fc 75b8e810 000008d4

comsvcs!FF_RunCmd+0xa2
0:000> du 75b8e7fc

75b8e7fc  “%s %d %s”

0:000> du 75b8e810

75b8e810  “RunDll32 comsvcs.dll,MiniDump”
We can guess that the first parameter is a format string, the second one is the command line for a process dumper, the third one is PID and the fourth one should be the name of a dump file to save. We can double check this from the raw stack:
ChildEBP RetAddr Args to Child

0072f340 75c2bb91 75b8e7fc 75b8e810 000008d4

comsvcs!FF_RunCmd+0xa2
0:000> dd 0072f340

0072f340  0072f60c 75c2bb91 75b8e7fc 75b8e810

     ; saved EBP, return EIP, 1st param, 2nd param

0072f350  000008d4 0072f640 0072f84a 00000000

     ; 3rd param, 4th param
0:000> du 0072f640

0072f640  “C:\WINDOWS\system32\com\dmp\{646″

0072f680  “F1874-46B6-4149-BD55-8C317FB71CC”

0072f6c0  “0}_2007_07_16_12_05_08.dmp”
We can actually find the already formatted command that was passed to CreateProcess call on the raw stack:
0:006> du 0072ef2c

0072ef2c  "RunDll32 comsvcs.dll,MiniDump 22"

0072ef6c  "60 C:\WINDOWS\system32\com\dmp\{"

0072efac  "646F1874-46B6-4149-BD55-8C317FB7"

0072efec  "1CC0}_2007_07_16_12_05_08.dmp"
- Dmitry Vostokov @ DumpAnalysis.org -