Crash Dumps for Dummies (Part 5)
In this part, I try to explain symbol files. They are usually called PDB files because they have .PDB extension although the older ones can have .DBG extension. PDB files are needed to read dump files properly. Without PDB files the dump file data is just a collection of numbers, the contents of memory, without any meaning. PDB files help tools like WinDbg to interpret the data and present it in a human-readable format. Roughly speaking, PDB files contain associations between numbers and their meanings expressed in short text strings:
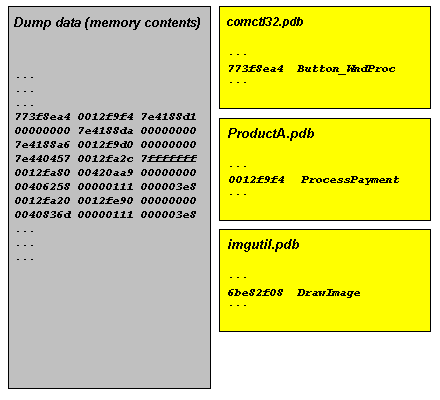
Because these associations are changed when you have a fix or a service pack on a computer and you have a dump from it you need newer PDB files that correspond to updated components such as DLLs or drivers.
Long time ago you had to download symbol files manually from Microsoft or get them from CDs. Now Microsoft has its dedicated internet symbol server and WinDbg can download PDB files automatically. However you need to specify Microsoft symbol server location in File\Symbol File Path… dialog and check Reload. The location is usually:
SRV*c:\websymbols*http://msdl.microsoft.com/download/symbols
If you don’t remember the location when you run WinDbg for the first time or on a new computer you can enter .symfix command to set Microsoft symbol server path automatically and specify the location where to download symbol files. You can check your current symbol search path by using .sympath command and don’t forget to reload symbols by entering .reload command:
0:000> .symfix

No downstream store given, using C:\Program Files\Debugging Tools for Windows\sym

0:000> .sympath

Symbol search path is: SRV**http://msdl.microsoft.com/download/symbols

0:000> .symfix c:\websymbols

0:000> .sympath

Symbol search path is: SRV*c:\websymbols*http://msdl.microsoft.com/download/symbols

0:000> .reload
- Dmitry Vostokov @ DumpAnalysis.org -
October 8th, 2008 at 6:57 am
[…] Crash Dumps for Dummies: Part 5 - Symbol files explained […]
October 8th, 2008 at 6:58 am
Note that there is also Citrix symbol server available:
http://www.dumpanalysis.org/blog/index.php/2008/09/30/citrix-joins-symbol-server-club/