 Multiple Exceptions (user mode) - Modeling Example
 Multiple Exceptions (kernel mode)
 Multiple Exceptions (managed space)
- Multiple Exceptions (stowed)
 Dynamic Memory Corruption (process heap)
 Dynamic Memory Corruption (kernel pool)
- Dynamic Memory Corruption (managed heap)
 False Positive Dump
 Lateral Damage (general)
- Lateral Damage (CPU mode)
 Optimized Code (function parameter reuse)
 Invalid Pointer (general)
- Invalid Pointer (objects)
 NULL Pointer (code)
 NULL Pointer (data)
 Inconsistent Dump
 Hidden Exception (user space)
- Hidden Exception (kernel space)
- Hidden Exception (managed space)
 Deadlock (critical sections)
 Deadlock (executive resources)
 Deadlock (mixed objects, user space)
 Deadlock (LPC)
 Deadlock (mixed objects, kernel space)
 Deadlock (self)
- Deadlock (managed space)
- Deadlock (.NET Finalizer)
 Changed Environment
 Incorrect Stack Trace
 OMAP Code Optimization
 No Component Symbols
 Insufficient Memory (committed memory)
 Insufficient Memory (handle leak)
 Insufficient Memory (kernel pool)
 Insufficient Memory (PTE)
 Insufficient Memory (module fragmentation)
 Insufficient Memory (physical memory)
 Insufficient Memory (control blocks)
- Insufficient Memory (reserved virtual memory)
- Insufficient Memory (session pool)
- Insufficient Memory (stack trace database)
- Insufficient Memory (region)
- Insufficient Memory (stack)
 Spiking Thread
 Module Variety
 Stack Overflow (kernel mode)
 Stack Overflow (user mode)
 Stack Overflow (software implementation)
- Stack Overflow (insufficient memory)
- Stack Overflow (managed space)
 Managed Code Exception
- Managed Code Exception (Scala)
- Managed Code Exception (Python)
 Truncated Dump
 Waiting Thread Time (kernel dumps)
 Waiting Thread Time (user dumps)
 Memory Leak (process heap) - Modeling Example
 Memory Leak (.NET heap)
- Memory Leak (page tables)
- Memory Leak (I/O completion packets)
- Memory Leak (regions)
 Missing Thread
 Unknown Component
 Double Free (process heap)
 Double Free (kernel pool)
 Coincidental Symbolic Information
 Stack Trace
- Stack Trace (I/O request)
- Stack Trace (file system filters)
- Stack Trace (database)
- Stack Trace (I/O devices)
 Virtualized Process (WOW64)
 Stack Trace Collection (unmanaged space)
- Stack Trace Collection (managed space)
- Stack Trace Collection (predicate)
- Stack Trace Collection (I/O requests)
- Stack Trace Collection (CPUs)
 Coupled Processes (strong)
 Coupled Processes (weak)
 Coupled Processes (semantics)
 High Contention (executive resources)
 High Contention (critical sections)
 High Contention (processors)
- High Contention (.NET CLR monitors)
- High Contention (.NET heap)
- High Contention (sockets)
 Accidental Lock
 Passive Thread (user space)
 Passive System Thread (kernel space)
 Main Thread
 Busy System
 Historical Information
 Object Distribution Anomaly (IRP)
- Object Distribution Anomaly (.NET heap)
 Local Buffer Overflow (user space)
- Local Buffer Overflow (kernel space)
 Early Crash Dump
 Hooked Functions (user space)
 Hooked Functions (kernel space)
- Hooked Modules
 Custom Exception Handler (user space)
 Custom Exception Handler (kernel space)
 Special Stack Trace
 Manual Dump (kernel)
 Manual Dump (process)
 Wait Chain (general)
 Wait Chain (critical sections)
 Wait Chain (executive resources)
 Wait Chain (thread objects)
 Wait Chain (LPC/ALPC)
 Wait Chain (process objects)
 Wait Chain (RPC)
 Wait Chain (window messaging)
 Wait Chain (named pipes)
- Wait Chain (mutex objects)
- Wait Chain (pushlocks)
- Wait Chain (CLR monitors)
- Wait Chain (RTL_RESOURCE)
- Wait Chain (modules)
- Wait Chain (nonstandard synchronization)
- Wait Chain (C++11, condition variable)
- Wait Chain (SRW lock)
 Corrupt Dump
 Dispatch Level Spin
 No Process Dumps
 No System Dumps
 Suspended Thread
 Special Process
 Frame Pointer Omission
 False Function Parameters
 Message Box
 Self-Dump
 Blocked Thread (software)
 Blocked Thread (hardware)
- Blocked Thread (timeout)
 Zombie Processes
 Wild Pointer
 Wild Code
 Hardware Error
 Handle Limit (GDI, kernel space)
- Handle Limit (GDI, user space)
 Missing Component (general)
 Missing Component (static linking, user mode)
 Execution Residue (unmanaged space, user)
- Execution Residue (unmanaged space, kernel)
- Execution Residue (managed space)
 Optimized VM Layout
- Invalid Handle (general)
- Invalid Handle (managed space)
- Overaged System
- Thread Starvation (realtime priority)
- Thread Starvation (normal priority)
- Duplicated Module
- Not My Version (software)
- Not My Version (hardware)
- Data Contents Locality
- Nested Exceptions (unmanaged code)
- Nested Exceptions (managed code)
- Affine Thread
- Self-Diagnosis (user mode)
- Self-Diagnosis (kernel mode)
- Self-Diagnosis (registry)
- Inline Function Optimization (unmanaged code)
- Inline Function Optimization (managed code)
- Critical Section Corruption
- Lost Opportunity
- Young System
- Last Error Collection
- Hidden Module
- Data Alignment (page boundary)
- C++ Exception
- Divide by Zero (user mode)
- Divide by Zero (kernel mode)
- Swarm of Shared Locks
- Process Factory
- Paged Out Data
- Semantic Split
- Pass Through Function
- JIT Code (.NET)
- JIT Code (Java)
- Ubiquitous Component (user space)
- Ubiquitous Component (kernel space)
- Nested Offender
- Virtualized System
- Effect Component
- Well-Tested Function
- Mixed Exception
- Random Object
- Missing Process
- Platform-Specific Debugger
- Value Deviation (stack trace)
- Value Deviation (structure field)
- Runtime Thread (CLR)
- Runtime Thread (Python, Linux)
- Coincidental Frames
- Fault Context
- Hardware Activity
- Incorrect Symbolic Information
- Message Hooks - Modeling Example
- Coupled Machines
- Abridged Dump
- Exception Stack Trace
- Distributed Spike
- Instrumentation Information
- Template Module
- Invalid Exception Information
- Shared Buffer Overwrite
- Pervasive System
- Problem Exception Handler
- Same Vendor
- Crash Signature
- Blocked Queue (LPC/ALPC)
- Fat Process Dump
- Invalid Parameter (process heap)
- Invalid Parameter (runtime function)
- String Parameter
- Well-Tested Module
- Embedded Comment
- Hooking Level
- Blocking Module
- Dual Stack Trace
- Environment Hint
- Top Module
- Livelock
- Technology-Specific Subtrace (COM interface invocation)
- Technology-Specific Subtrace (dynamic memory)
- Technology-Specific Subtrace (JIT .NET code)
- Technology-Specific Subtrace (COM client call)
- Dialog Box
- Instrumentation Side Effect
- Semantic Structure (PID.TID)
- Directing Module
- Least Common Frame
- Truncated Stack Trace
- Data Correlation (function parameters)
- Data Correlation (CPU times)
- Module Hint
- Version-Specific Extension
- Cloud Environment
- No Data Types
- Managed Stack Trace
- Managed Stack Trace (Scala)
- Managed Stack Trace (Python)
- Coupled Modules
- Thread Age
- Unsynchronized Dumps
- Pleiades
- Quiet Dump
- Blocking File
- Problem Vocabulary
- Activation Context
- Stack Trace Set
- Double IRP Completion
- Caller-n-Callee
- Annotated Disassembly (JIT .NET code)
- Annotated Disassembly (unmanaged code)
- Handled Exception (user space)
- Handled Exception (.NET CLR)
- Handled Exception (kernel space)
- Duplicate Extension
- Special Thread (.NET CLR)
- Hidden Parameter
- FPU Exception
- Module Variable
- System Object
- Value References
- Debugger Bug
- Empty Stack Trace
- Problem Module
- Disconnected Network Adapter
- Network Packet Buildup
- Unrecognizable Symbolic Information
- Translated Exception
- Regular Data
- Late Crash Dump
- Blocked DPC
- Coincidental Error Code
- Punctuated Memory Leak
- No Current Thread
- Value Adding Process
- Activity Resonance
- Stored Exception
- Spike Interval
- Stack Trace Change
- Unloaded Module
- Deviant Module
- Paratext
- Incomplete Session
- Error Reporting Fault
- First Fault Stack Trace
- Frozen Process
- Disk Packet Buildup
- Hidden Process
- Active Thread (Mac OS X)
- Active Thread (Windows)
- Critical Stack Trace
- Handle Leak
- Module Collection
- Module Collection (predicate)
- Deviant Token
- Step Dumps
- Broken Link
- Debugger Omission
- Glued Stack Trace
- Reduced Symbolic Information
- Injected Symbols
- Distributed Wait Chain
- One-Thread Process
- Module Product Process
- Crash Signature Invariant
- Small Value
- Shared Structure
- Thread Cluster
- False Effective Address
- Screwbolt Wait Chain
- Design Value
- Hidden IRP
- Tampered Dump
- Memory Fluctuation (process heap)
- Last Object
- Rough Stack Trace (unmanaged space)
- Rough Stack Trace (managed space)
- Past Stack Trace
- Ghost Thread
- Dry Weight
- Exception Module
- Reference Leak
- Origin Module
- Hidden Call
- Corrupt Structure
- Software Exception
- Crashed Process
- Variable Subtrace
- User Space Evidence
- Internal Stack Trace
- Distributed Exception (managed code)
- Thread Poset
- Stack Trace Surface
- Hidden Stack Trace
- Evental Dumps
- Clone Dump
- Parameter Flow
- Critical Region
- Diachronic Module
- Constant Subtrace
- Not My Thread
- Window Hint
- Place Trace
- Stack Trace Signature
- Relative Memory Leak
- Quotient Stack Trace
- Module Stack Trace
- Foreign Module Frame
- Unified Stack Trace
- Mirror Dump Set
- Memory Fibration
- Aggregated Frames
- Frame Regularity
- Stack Trace Motif
- System Call
- Stack Trace Race
- Hyperdump
- Disassembly Ambiguity
- Exception Reporting Thread
- Active Space
- Subsystem Modules
- Region Profile
- Region Clusters
- Source Stack Trace
- Hidden Stack
- Interrupt Stack
- False Memory
- Frame Trace
- Pointer Cone
- Context Pointer
- Pointer Class
- False Frame
- Procedure Call Chain
- C++ Object
- COM Exception
- Structure Sheaf
- Saved Exception Context (.NET)
- Shared Thread
- Spiking Interrupts
- Structure Field Collection
- Black Box
- Rough Stack Trace Collection (unmanaged space)
- COM Object
- Shared Page
- Exception Collection
- Dereference Nearpoint
- Address Representations
- Near Exception
- Shadow Stack Trace
- Past Process
- Foreign Stack
- Annotated Stack Trace
- Disassembly Summary
- Region Summary
- Analysis Summary
- Region Spectrum
- Normalized Region
Projective Debugging
Modern software systems and products are hard to debug despite their elaborate tracing and logging facilities. Typical logs may include millions of trace messages from hundreds and thousands of components, processes, and threads. The postmortem diagnostic analysis became more structural after the introduction of Trace and Log Analysis Patterns but live debugging requires a lot more efforts. Here we introduce Projective Debugging as a tool for trace-level debugging. Its main idea is to analyze, diagnose and debug the so-called “projected” execution of software as seen from the original software execution traces and logs:
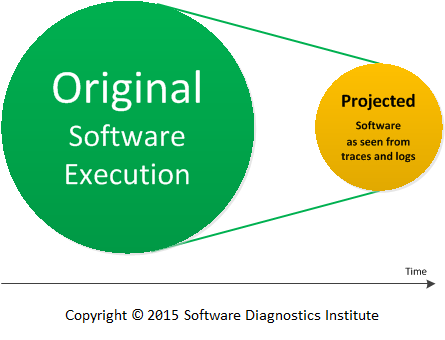
Picture 1. Original software execution is mapped into projected software as seen from traces and logs.
Please notice, that Projective Debugging is different from the so-called Prototype Debugging by creating models after the software product is built (some engineering methodologies prescribe that prototypes should be discarded before building the product):
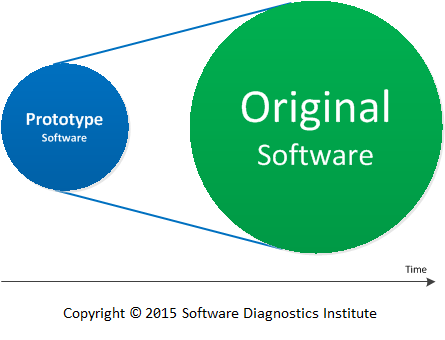
Picture 2. Prototype software is mapped into the product.
The problems diagnosed and solved in the projected system are fed back into the original system:
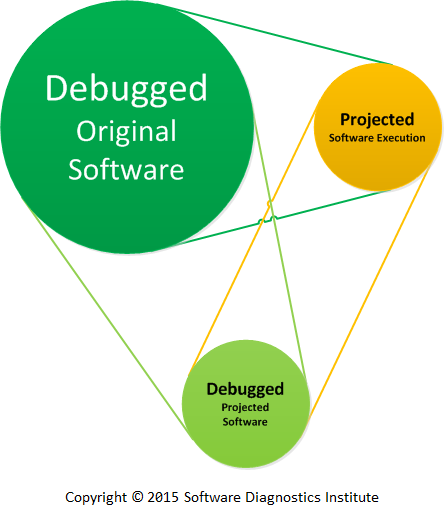
Picture 3. Debugged projected software is mapped into the original software.
The implementation of the main idea of Projective Debugging is that: we can take a trace or log, interpret every trace message according to some rules, and translate it into executable code mirroring components and execution entities such as user sessions, processes, and threads. This is a task for the Projective Debugger, and it is illustrated in the following diagram where we borrowed notation from UML:
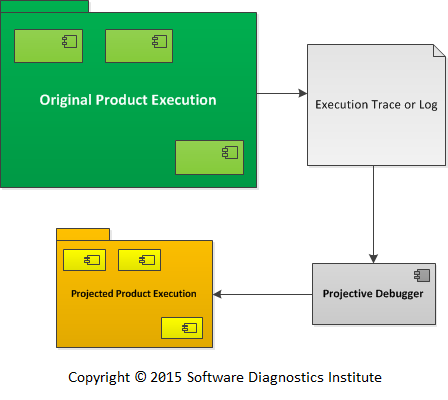
Picture 4. The logs and traces from the original product execution are translated by Projective Debugger.
For example, the Projective Debugger (ProjectiveDebugger.exe) interprets these very simple messages below, and creates a process PID220.exe (we have only one thread), and then opens a file “data.txt”. After 10 seconds, it closes the file.
Time     PID  TID  Message
-----------------------------------
11:00:00 220  330  Open “data.txt”
11:00:10 220  330  Close “data.txt”
In addition to executing code corresponding to messages using the same time deltas as read from the trace, it may scale execution time proportionally, for example, executing 2-day log in a matter of minutes. Such scaling may also uncover additional synchronization bugs.
The trace may be pre-processed, and all necessary objects created before execution or it may be interpreted line by line. For complex traces, the projected source code may be generated for later compilation, linking, and execution. Once the projected code is executed, breakpoints may be set on existing traces, and other types of Debugging Implementation Patterns may be applied. Moreover, we may re-execute the trace several times and even have some limited form of backward execution.
The resulting code model can be inspected by native debuggers for the presence of Memory Analysis Patterns and can even have its own logging instrumentation with traces and logs analyzed by another instance of the Projective Debugger:
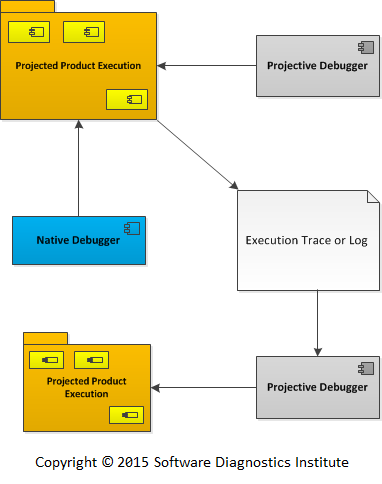
Picture 5. Projected Product Execution is inspected by a native debugger and also generates its own set of traces and logs to be projected to another model by another instance of the Projected Debugger.
We created the first version of the Projective Debugger and successfully applied to a small trace involving synchronization primitives across several threads. The Projective Debugger was able to translate it into an executable model with the same number of threads and the same synchronization primitives and logic. The resulting process was hung as expected and we attached a native debugger (WinDbg for Windows) and found a deadlock.
Since traces are analyzed from platform-independent Software Narratology perspective it is possible to get a trace from one operating system, and then, after applying a set of rules, re-interpret it into an executable model on another operating system. We created the similar multithreading test program on Mac OS X that was hung and reinterpreted its trace into an executable model under Windows:
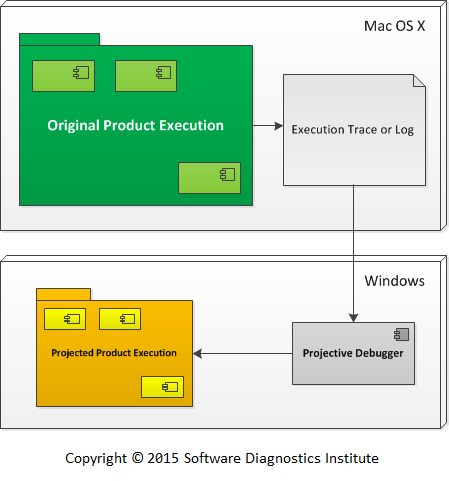
Picture 6. The traces and logs from the original product execution on Mac OS X are projected by a Windows version of Projective Debugger into an executable model for a Windows platform.
Since resultant executable models can also have corresponding logging instrumentation mirroring original tracing, any problems found in executable models can be fixed iteratively and, once the problem disappears, the resulting fix or configuration may be incorporated into the original product or system.
If tracing involves kernel space and mode, a specialized projected executable can be created to model the operating system and driver level.
The more tracing data you have, more real your projected execution becomes. However, we want to have enough tracing statements but not to complicate the projected model. Then, ideally, we should trace only relevant behavior, for example, corresponding to use cases and architecture.
Projective Debugging may also improve your system or product maintainability by highlighting whether you need more tracing statements and whether you need more accurate and complete tracing statements.
Memory Dump and Live Memory Visualization and Picture Extraction
NEW! The updated version of Dump2Picture is available: http://www.dumpanalysis.org/dump2picture
This is a reprint of several articles with permission from Memory Dump Analysis Anthology, Volume 1.
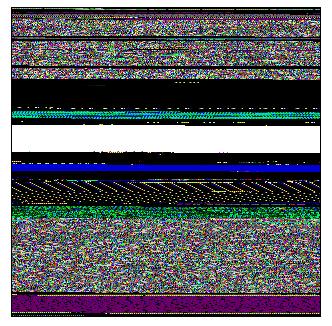
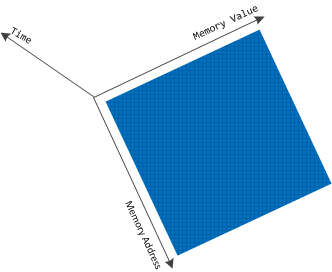
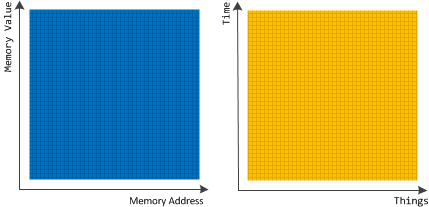
As the first step towards Memory Dump Tomography (Memory Dump Analysis Anthology, Volume 1, page 522) we created a small program that interprets a memory dump as a picture. We can visualize crash dumps with it. The tool is available for free download.
Simply run it from the command prompt and specify full paths to a dump file and an output BMP file. The memory dump file will be converted by default into true color, 32 bits-per-pixel bitmap. We can specify other values: 8, 16 and 24.
C:\Dump2Picture>Dump2Picture.exe

Dump2Picture version 1.0

Written by Dmitry Vostokov, 2007

Usage: Dump2Picture dumpfile bmpfile [8|16|24|32]
For example:
C:\Dump2Picture>Dump2Picture.exe MEMORY.DMP MEMORY.BMP 8

Dump2Picture version 1.0

Written by Dmitry Vostokov, 2007

MEMORY.BMP

MEMORY.DMP

        1 file(s) copied.
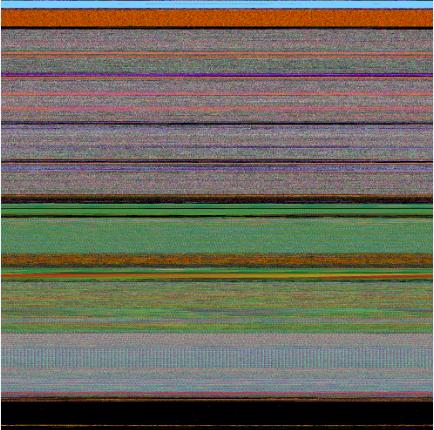
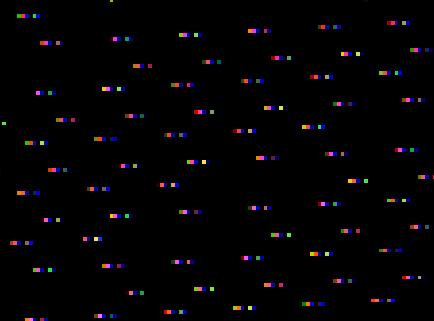
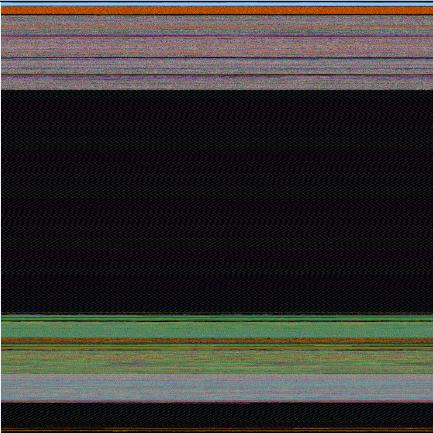
Below are some screenshots of bitmap files created by the tool. We can think about them as visualized kernel or user address spaces.
Vista kernel memory dump (8 bits-per-pixel):

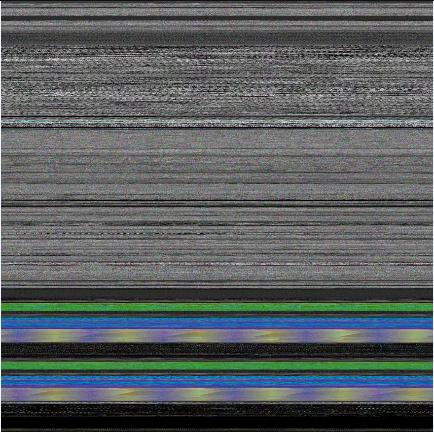
Vista kernel memory dump (16 bits-per-pixel):

Vista kernel memory dump (24 bits-per-pixel):

Vista kernel memory dump (32 bits-per-pixel):

Notepad process user memory dump (8 bits-per-pixel):

Notepad process user memory dump (16 bits-per-pixel):

Notepad process user memory dump (24 bits-per-pixel):
Notepad process user memory dump (32 bits-per-pixel):
Mspaint process user memory dump (32 bits-per-pixel):

Mspaint process user memory dump after loading "Toco Toucan.jpg" from Vista Sample Pictures folder (32 bits-per-pixel):

Dump2Picture can be used to explore memory leaks visually. We created the following small program in Visual C++ that leaks 64Kb every second:
#include "stdafx.h"
#include <windows.h>
int _tmain(int argc, _TCHAR* argv[])
{
while (true)
{
printf("%x\n", (UINT_PTR)malloc(0xFFFF));
Sleep(1000);
}
return 0;
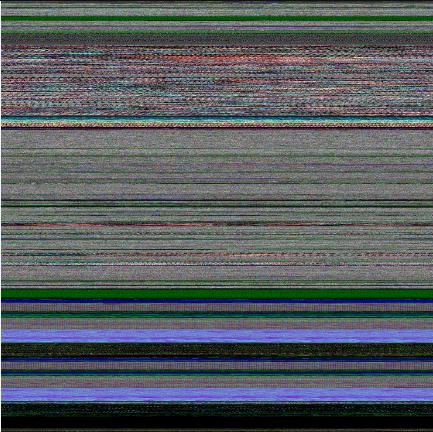
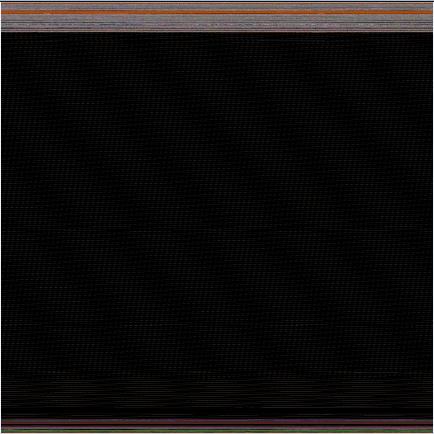
}Then we sampled 3 dumps at 7Mb, 17Mb and 32Mb process virtual memory size and converted them as 16 bits-per-pixel bitmaps. On the pictures below we can see that the middle black memory area grows significantly. Obviously malloc function allocates zeroed memory and therefore we see black color.
7Mb process memory dump:
17Mb process memory dump:

32Mb process memory dump:
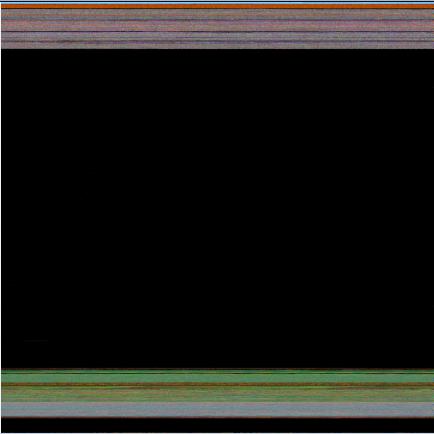
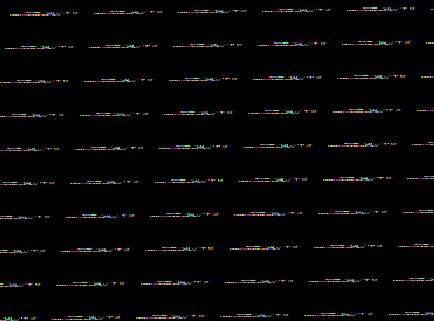
If we zoom in the black area we would see the following pattern:
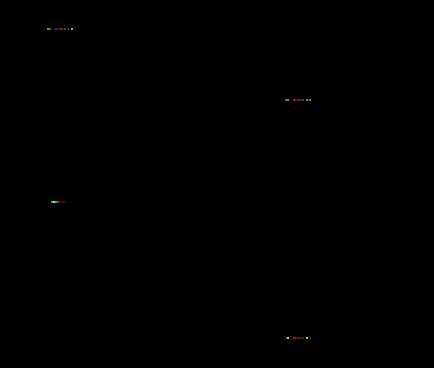
Colored lines inside are heap control structures that are created for every allocated block of memory. If this is correct then allocating smaller memory blocks would create a hatched pattern. And this is true indeed. The following program leaks 256 byte memory blocks:
#include "stdafx.h"
#include <windows.h>

int _tmain(int argc, _TCHAR* argv[])
{
  while (true)
  {
    printf("%x\n", (UINT_PTR)malloc(0xFF));
    Sleep(1000/0xFF);
  }
  return 0;
}
The corresponding process memory picture and zoomed heap area are the following:
Making allocations 4 times smaller makes heap area to look hatched, and zoomed picture is more densely packed by heap control structures:
#include "stdafx.h"
#include <windows.h>

int _tmain(int argc, _TCHAR* argv[])
{
  while (true)
  {
    printf("%x\n", (UINT_PTR)malloc(0xFF/4));
    Sleep((1000/0xFF)/4);
  }
  return 0;
}

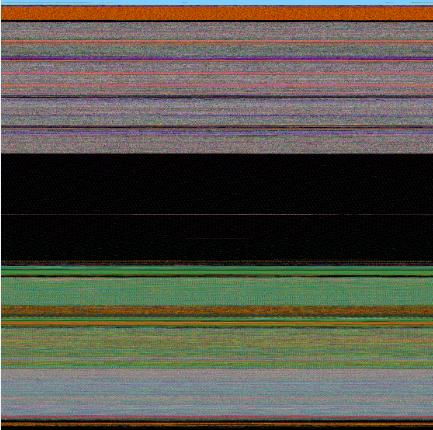
Here is another example. One service was increasing its memory constantly. The crash dump picture shows huge hatched dark region in the middle:
and if we zoom in this region:
Because the pattern and allocation size look uniform it could be the true heap memory leak for some operation that allocates constant size buffers. After opening the dump and looking at heap segments that had grown the most we see the same allocation size indeed:
0:000> !.\w2kfre\ntsdexts.heap -h 5

HEAPEXT: Unable to get address of NTDLL!NtGlobalFlag.

Index   Address  Name      Debugging options enabled

1:   00140000

2:   00240000

3:   00310000

4:   00330000

5:   00370000

Segment at 00370000 to 00380000 (00010000 bytes committed)

Segment at 01680000 to 01780000 (00100000 bytes committed)

Segment at 019C0000 to 01BC0000 (00200000 bytes committed)

Segment at 01BC0000 to 01FC0000 (00400000 bytes committed)

Segment at 01FC0000 to 027C0000 (00800000 bytes committed)

    Segment at 027C0000 to 037C0000 (01000000 bytes committed)

Segment at 037C0000 to 057C0000 (02000000 bytes committed)

Segment at 057C0000 to 097C0000 (00155000 bytes committed)

...

...

...

057B96E0: 01048 . 01048 [07] - busy (1030), tail fill

057BA728: 01048 . 01048 [07] - busy (1030), tail fill

057BB770: 01048 . 01048 [07] - busy (1030), tail fill

057BC7B8: 01048 . 01048 [07] - busy (1030), tail fill

057BD800: 01048 . 01048 [07] - busy (1030), tail fill

057BE848: 01048 . 01048 [07] - busy (1030), tail fill

057BF890: 01048 . 00770 [14] free fill

Heap entries for Segment07 in Heap 370000

057C0040: 00040 . 01048 [07] - busy (1030), tail fill

057C1088: 01048 . 01048 [07] - busy (1030), tail fill

057C20D0: 01048 . 01048 [07] - busy (1030), tail fill

057C3118: 01048 . 01048 [07] - busy (1030), tail fill

057C4160: 01048 . 01048 [07] - busy (1030), tail fill

057C51A8: 01048 . 01048 [07] - busy (1030), tail fill

...

...

...
An alternative to converting memory dumps to picture files is to save a memory range to a binary file and then convert it to a BMP file. Thus we can view the particular DLL or driver mapped into address space, heap or pool region, including live memory:
To save a memory range to a file use WinDbg .writemem command:
.writemem d2p-range.bin 00800000 0085e000
or
.writemem d2p-range.bin 00400000 L20000
We wrote a WinDbg script that saves a specified memory range and then calls a shell script that automatically converts the saved binary file to a BMP file and then runs a picture viewer registered for .bmp extension.
The WinDbg script code (mempicture.txt):
.writemem d2p-range.bin ${$arg1} ${$arg2}
.if (${/d:$arg3})
{
  .shell -i- mempicture.cmd d2p-range ${$arg3}
}
.else
{
  .shell -i- mempicture.cmd d2p-range
}
The shell script (mempicture.cmd):
dump2picture %1.bin %1.bmp %2

%1.bmp
Because WinDbg installation folder is assumed to be the default directory for both scripts and Dump2Picture.exe they should be copied to the same folder where windbg.exe is located. On our system it is
C:\Program Files\Debugging Tools for Windows
Both scripts are now included in Dump2Picture package available for free download.
To call the script from WinDbg use the following command:
$$>a< mempicture.txt Range [bits-per-pixel]
where Range can be in Address1 Address2 or Address Lxxx format, bits-per-pixel can be 8, 16, 24 or 32. By default it is 32.
For example, we loaded a complete Windows x64 memory dump and visualized HAL (hardware abstraction layer) module:
kd> lm

start             end                 module name

fffff800`00800000 fffff800`0085e000   hal

fffff800`01000000 fffff800`0147b000   nt

fffff97f`ff000000 fffff97f`ff45d000   win32k

...

...

...
kd> $$>a< mempicture.txt fffff800`00800000 fffff800`0085e000

Writing 5e001 bytes...
C:\Program Files\Debugging Tools for Windows>dump2picture d2p-range.bin d2p-range.bmp
Dump2Picture version 1.1

Written by Dmitry Vostokov, 2007
d2p-range.bmp

d2p-range.bin

1 file(s) copied.
C:\Program Files\Debugging Tools for Windows>d2p-range.bmp

<.shell waiting 10 second(s) for process>

.shell: Process exited

kd>
and Windows Picture and Fax Viewer application was launched and displayed the following picture:
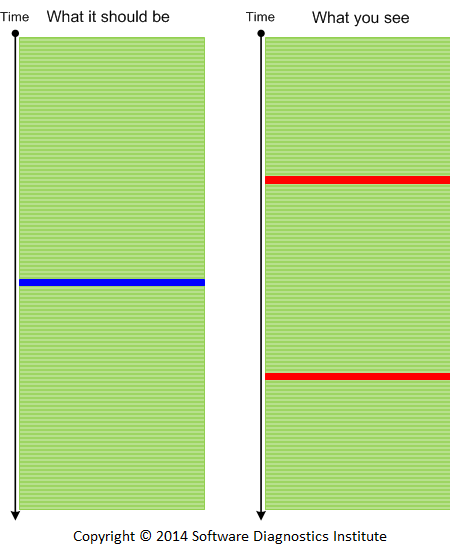
Special and General Trace and Log Analysis
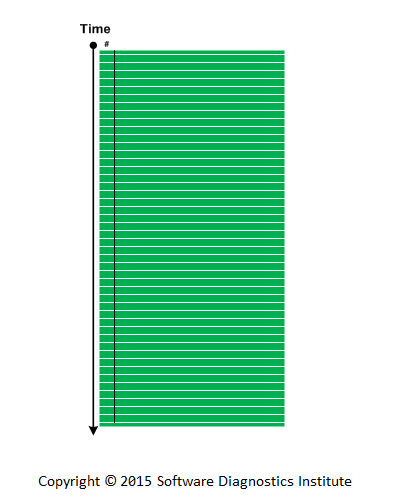
Most software traces include message timestamps or have an implicit time arrow via sequential ordering. We call such traces Special. The analysis is special too because causality is easily seen. Typical examples of analysis patterns here are Discontinuity, Time Delta, Event Sequence Order, Data Flow (see time dependency markers ↓ in the training course reference), and more recently added patterns such as Back Trace, Timeout, Milestones, and Event Sequence Phase. Inter- and Intra-Correlation analysis is also easy.
On the other side, there are plenty of software logs or digital media artefacts with “chaotic” records where time arrow is missing or only partial. Typical examples are debugger logs from WinDbg debugger from Microsoft Debugging Tools for Windows or logs from debugging sessions on other platforms. Such logs may contain global ordering such as the list of processes and threads (Last Object memory analysis pattern) interspaced with local pockets of stack traces that have reversed ordering. Some logging output may not have any ordering or timing information whatever.
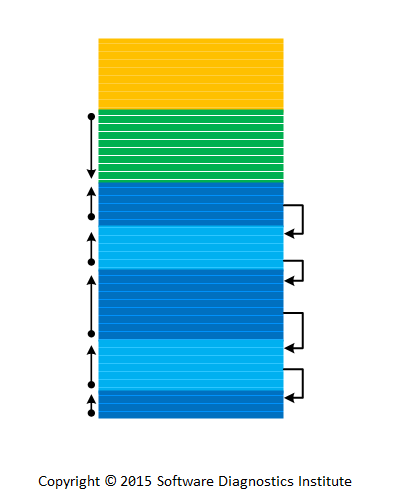
In a more general case, logging may be completely arbitrarily. Typical example is raw stack analysis and its Rough Stack Trace and Past Stack Trace patterns.
We call such traces General. The main task of general trace analysis is to recover causality. It may be possible if another analysis pattern is introduced called Causality Markers. The prototypes of such a pattern are various wait chains, Waiting Thread Time memory analysis pattern and its process memory dump equivalent.
Diagnostics, Forensics, Prognostics: The Copernican Revolution
Our pattern language system for software diagnostics was originally tool-centric, devised from recurrent analysis problems on Windows platforms when using WinDbg from Microsoft Debugging Tools for Windows. We now call it “Ptolemaic”.
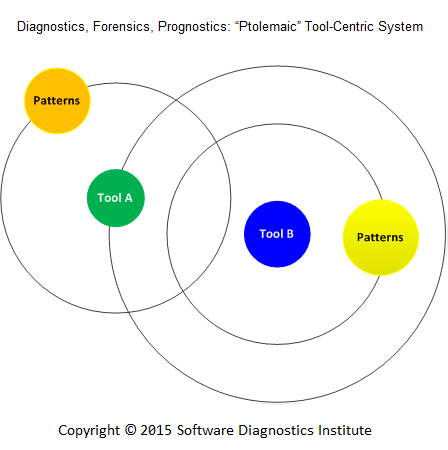
Later we realized that the same system is possible to apply to other platforms and tools, and we proved it with the publication of the book for GDB. When the debugging tool changed on Mac OS X we ported the same book to different LLDB debugger. With the presenting of a pattern language for memory forensics, we extended the same system to other memory analysis tools in principle. Our pattern language system became pattern-centric. We call it “Copernican”. In addition, trace and log analysis pattern system was devised as pattern-centric from the ground up based on software Narratology and applied to all software execution artifacts including network traces.
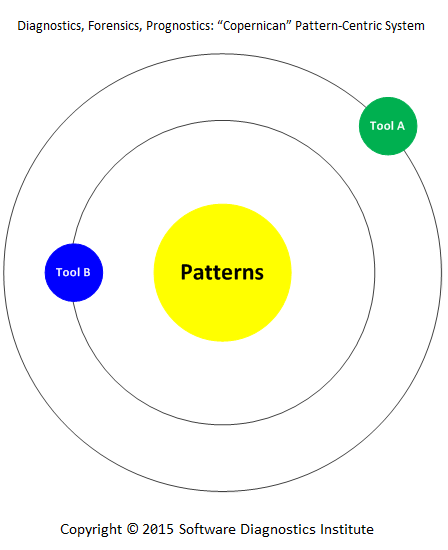
Although this paradigm shift was evolutionary for us, we call it revolutionary for the whole discipline of software diagnostics, forensics, and prognostics because of previously dominant tool-centric systems.
Pattern-Oriented Network Forensics
In February, 2015 we plan a lecture which introduces a pattern language for network forensics - investigation of captured network traces for patterns of abnormal network traffic behavior. It provides a unified language for discussing and communicating detection and analysis results, a base language for checklists, and an aid in accelerated learning. Pattern-oriented network forensics is based on a synthesis of pattern-oriented network trace analysis with malware narrative approach including malnarratives and complements pattern-oriented memory forensics.

Pattern-Oriented Debugging Process
Modern debugging is complex and usually distributed across organizations involving many persons and teams:
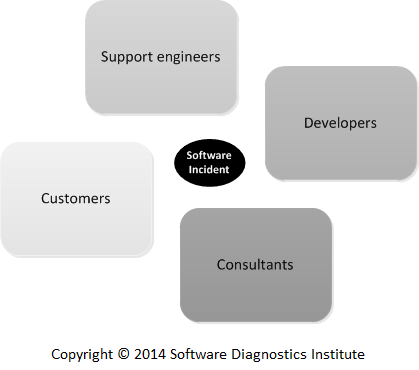
We propose a fully pattern-oriented debugging process that takes into account the integral role of software diagnostics and software construction patterns.
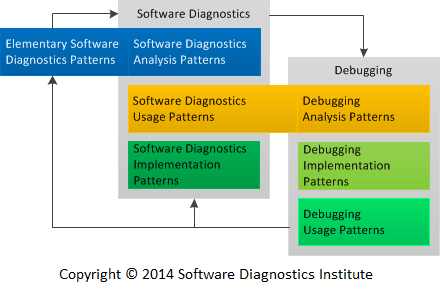
Whenever we have a software incident, we usually start with a small number of Elementary Software Diagnostics Patterns to identify what kind of software execution artifacts to collect. Such artifacts may include memory dumps and logs for postmortem debugging but can also be running software itself, the so-called live debugging scenario. These patterns can be also called Software Diagnostics Analysis Patterns reflecting the fact that we need to analyze what we further need to do before doing software diagnostics itself.
Based on artifacts we identify patterns of software behavior such as memory and trace analysis patterns. We call these patterns Software Diagnostics Usage Patterns.
Such usage patterns can be also called Debugging Analysis Patterns because we need to diagnose the right problem before doing any debugging.
Specific techniques reused across different software diagnostics and debugging scenarios we name Software Diagnostics and Debugging Implementation Patterns. There can also be Debugging Usage Patterns as reusable debugging scenarios.
Previously we introduced Unified Debugging Patterns (Analysis, Architecture, Design, Implementation, and Usage) to which we would like to add Debugging Presentation Patterns and similar pattern stack for software diagnostics:
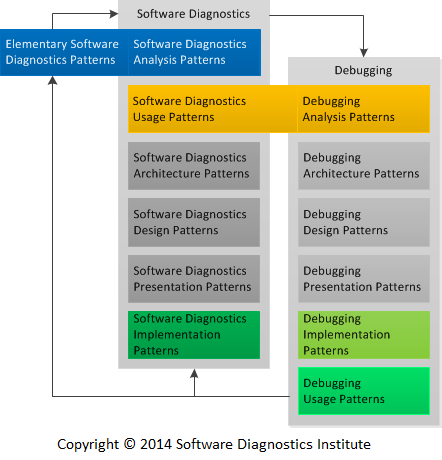
These pattern categories are usually already in existence and are important only when we develop new software diagnostics and debugging infrastructures and tools. For example, Patterns-View-Controller architectural pattern.
Examples of Elementary Software Diagnostics (Software Diagnostics Analysis) Patterns, Software Diagnostics Usage (Debugging Analysis) Patterns, and Debugging Implementation Patterns can be found in Accelerated Windows Debugging3 book.
Memory Dump Analysis Anthology, Volume 8a
The following direct links can be used to order the book now:
Buy Kindle version
Buy Paperback from Amazon
Buy Paperback from Barnes & Noble
Buy Paperback from Book Depository
Also available in PDF format from Software Diagnostics Services
Contains revised, edited, cross-referenced, and thematically organized selected articles from Software Diagnostics Institute (DumpAnalysis.org + TraceAnalysis.org) and Software Diagnostics Library (former Crash Dump Analysis blog, DumpAnalysis.org/blog) about software diagnostics, debugging, crash dump analysis, memory forensics, software trace and log analysis written in June 2014 - November 2014 for software engineers developing and maintaining products on Windows platforms, quality assurance engineers testing software, technical support and escalation engineers dealing with complex software issues, security researchers, reverse engineers, malware and memory forensics analysts. This volume is fully cross-referenced with volumes 1 - 7 and features:
- 19 new crash dump analysis patterns
- 10 new software log and trace analysis patterns
- Introduction to malnarratives and higher-order pattern narratives
- Introduction to pattern language for performance analysis
- Introduction to pattern-oriented debugging process
Product information:
- Title: Memory Dump Analysis Anthology, Volume 8a
- Authors: Dmitry Vostokov, Software Diagnostics Institute
- Language: English
- Product Dimensions: 22.86 x 15.24
- Paperback: 150 pages
- Publisher: OpenTask (December 2014)
- ISBN-13: 978-1-908043-53-5
Software Diagnostics Professional Certification
Software Diagnostics Services offers a certification in pattern-oriented software diagnostics for software technical support and escalation engineers, software engineers and quality assurance engineers with the following assessment areas:
- pattern-oriented memory dump analysis
- pattern-oriented software trace and log analysis
The focus is on unintentional software behaviour such related to crashes, resource consumption (CPU, memory leaks), and hangs. For intentional software behaviour there is Memory Forensics Professional certification under development. The Windows track tests the ability to recognise patterns using the following analysis tools: WinDbg from Microsoft Debugging Tools for Windows and Process Monitor.
Please visit Software Diagnostics Services for more details.
Memory Forensics Professional Certification
Software Diagnostics Services offers a certification in pattern-oriented memory forensics for digital forensics and incident response professionals, reverse engineers and security researchers with the following assessment areas:
- pattern-oriented malware detection and analysis
- pattern-oriented reverse engineering
The focus is on intentional software behaviour such related to malware and rootkits. For unintentional software behaviour there is Software Diagnostics Professional certification. The Windows track tests the ability to recognise ADDR and malware analysis patterns using the following analysis tool: WinDbg from Microsoft Debugging Tools (future versions of this certification may add other tools). It has the same features and process as Software Diagnostics Professional certification.
Please visit Software Diagnostics Services for more details.
Software Trace and Memory Dump Analysis
The following direct links can be used to order the book now:
Buy Kindle or Paperback
 from Amazon
Buy Paperback from Barnes & Noble
Buy Paperback from Book Depository
Available for SkillSoft Books24x7 subscribers
![]()
This is a full-colour transcript of Software Diagnostics Services (former Memory Dump Analysis Services) lecture delivered at E2EVC Virtualization Conference in 2011 which introduces an analysis methodology for software execution artefacts.
- Title: Software Trace and Memory Dump Analysis: Patterns, Tools, Processes and Best Practices
- Author: Dmitry Vostokov, Software Diagnostics Services
- Publisher: OpenTask (September 2014)
- Language: English
- Product Dimensions: 28.0 x 21.6
- Paperback: 28 pages
- ISBN-13: 978-1908043238
Malnarratives
A malnarrative is an intentionally modified narrative for malicious purposes. This word comes from the so-called malware narratives and their patterns. Malware narratives are just software traces and logs (for example, system logs and network traces) that contain diagnostic indicators (signs) pointing to possible or actual malware presence and execution. Therefore, malware narrative analysis patterns are based on general software trace and log analysis patterns as a part of pattern-oriented software diagnostics and forensics. Whereas, malware narratives result from planned alteration of structure and behaviour of software to serve malicious purposes with resulting narratives incidentally revealing malware, malnarratives are planned alterations of narratives themselves. Because software narratives are based on software narratology (which is an application of general narratology) the extensive trace and log analysis pattern catalogue (more than 90 patterns at the time of this writing) can be used to analyse and detect such patterns in non-software narratives. For example, it can be used for analysis of cyberspace narratives such as social media narratives (Facebook, Twitter, and LinkedIn) and even traditional media narratives such as news, stories, and books. Such pattern-oriented analysis of malnarratives can be used not only in security but also in intelligence analysis (MDAA, Volume 6) and information operations (IO), for example, in information warfare (IW).
A Pattern Language for Performance Analysis
We introduce a new software diagnostics pattern sub-catalogue based on trace and log analysis patterns. It now includes the following performance analysis patterns (with more patterns added soon):
Counter Value
Global Monotonicity
Constant Value
...
Many general log analysis patterns based on software narratology are applicable to performance monitoring logs because they structure analysis data and corresponding thought process:
Adjoint Thread (can be visualized via different colours on a graph)
Focus of Tracing
Characteristic Message Block (for graphs)
Activity Region
Significant Event
and many others.
The goal is to discern, describe, and classify general regularities and their interactions in captured performance data including analysis approaches reused across different operating systems, products, and their performance monitoring and analysis tools. Such Pattern-Oriented Performance Analysis as a part of Pattern-Oriented Software Diagnostics includes pattern-driven, pattern-based, and systemic parts.
Higher-Order Pattern Narratives (Analysing Diagnostic Analysis)
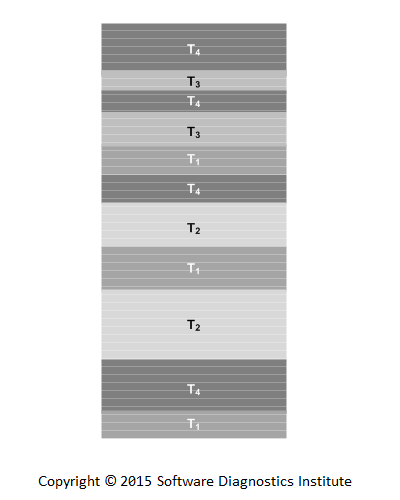
A pattern narrative in software narratology means a narrative where messages or log entries are patterns from pattern catalogues. These can be either domain specific patterns, or general trace and log analysis patterns such as Discontinuity, Activity Region, Significant Event, Macrofunction, and Back Trace. Generally, a software pattern narrative is a narrative constructed from software execution artefacts such as logs and memory dumps during their analysis. This is different from the usual meaning of a pattern narrative in narratology and literary criticism where we have a narrative which is a pattern itself like Master Trace analysis pattern. So in our case it is a narrative of patterns and not a narrative which is a pattern. The following picture illustrates the correspondence between a software trace example and its software pattern narrative:
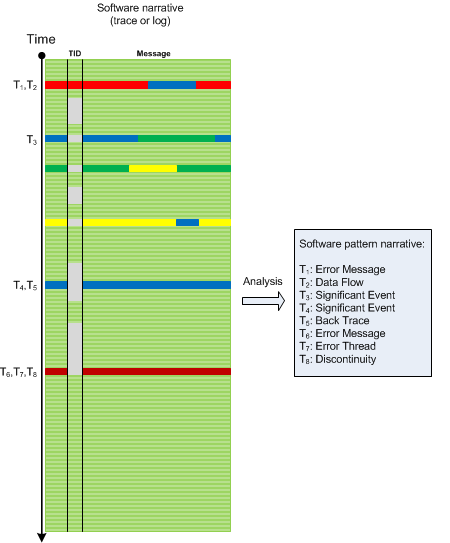
A pattern narrative can be further analysed for any missing patterns using pattern sequences and schemes.
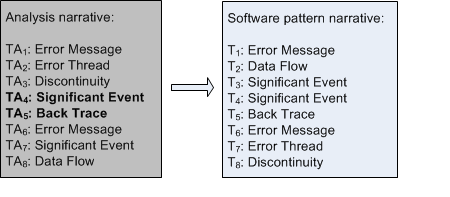
By a second-order narrative we mean a narrative about narrative such as the analysis of original narrative (a first-order narrative). For example, a transformation of a software log into its pattern narrative equivalent (the so called analysis narrative) is a second order narrative. It has its own time sequence (called Analysis Time, TA) where certain patterns are diagnosed out-of-order of their appearance in the resulting pattern narrative. In such a narrative additional patterns may be included that were diagnosed initially but were later replaced or eliminated. The latter property shows that second-order narratives are not simply rearranged plots of the same story (fabula). In the case of generalized memory narratives and hybrid artefacts such as memory dumps we also have analysis narratives. The following picture shows the analysis narrative used to construct software pattern narrative from the previous picture example. We see what patterns were found first:
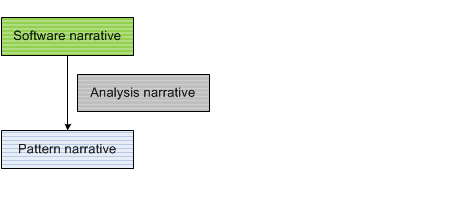
Such second-order narratives can be analysed further and give rise to third-order narratives and in general to higher-order narratives. The following diagram shows the relationship between a software narrative (order N), its pattern narrative (order N) and analysis narrative (order N+1):
The same principles of software narratology and its analysis patterns can be applied here. Discontinuities, Time Deltas and other patterns can be analysed to find out analysis difficulties which might require further training (such as in domain specific knowledge) and analysis tool development for subsequent computer assistance. For example, if we compare TAs in the analysis report above we find out that there was significant Time Delta pattern before Back Trace pattern was found leading to the first Error Message pattern from a different Thread of Activity. It took some time for an analyst to get an idea to look for specific Data Flow pattern and construct Back Trace (probably by looking at source code).
If you are new to Software Narratology please find this introduction: http://www.dumpanalysis.org/introduction-software-narratology
Native Memory Forensics
Among different approaches to memory forensics (investigation of past system or process structure and behaviour recorded in memory snapshots) native memory forensic analysis is done using native OS debuggers such as WinDbg from Debugging Tools for Windows or GDB (Linux) or GDB/LLDB (Mac OS X). Such approach is an integral part of software diagnostics (investigation of signs of software structure and behaviour in software execution artefacts) and was introduced as a part of pattern-oriented software forensics:
http://www.dumpanalysis.org/pattern-oriented-memory-forensics
http://www.dumpanalysis.org/pattern-language-memory-forensics
Software Diagnostics Services offers comprehensive self-paced training courses in native memory forensics for Windows platforms using WinDbg and memory dumps in hands-on exercises:
http://www.patterndiagnostics.com/accelerated-windows-malware-analysis-b...
http://www.patterndiagnostics.com/practical-foundations-windows-debuggin...
http://www.patterndiagnostics.com/accelerated-disassembly-reconstruction...
Their training courses (which also includes malware and rootkit detection, disassembly and reversing as an integral part of forensic investigation) teach various pattern languages (such as memory analysis pattern language, malware analysis patterns, and ADDR patterns) that can be used with other memory forensic analysis tools.
Memory Dump Analysis Anthology: Color Supplement for Volumes 6-7
The following direct links can be used to order the book now:
Buy Paperback from Amazon
Buy Paperback from Barnes & Noble
Buy Paperback from Book Depository
This is a supplemental volume of 150 full color illustrations from Memory Dump Analysis Anthology: revised, edited, cross-referenced, and thematically organized selected articles from Software Diagnostics Institute (DumpAnalysis.org + TraceAnalysis.org) and Software Diagnostics Library (former Crash Dump Analysis blog, DumpAnalysis.org/blog) about software diagnostics, debugging, crash dump analysis, software narratology, software trace and log analysis, malware analysis and memory forensics written in November 2011 - May 2014 for software engineers developing and maintaining software products, quality assurance engineers testing software, technical support and escalation engineers dealing with complex software issues, security researchers, malware analysts, reverse engineers, digital forensics analysts, computer security and cyber warfare intelligence professionals, computer scientists, conceptual digital artists, and philosophers. Unique in its breadth, depth, and scope it offers unprecedented insight into the world of software behavior and draws profound engineering, scientific, artistic, and philosophical implications.
- Title: Memory Dump Analysis Anthology: Color Supplement for Volumes 6-7
- Author: Dmitry Vostokov
- Publisher: OpenTask (June 2014)
- Language: English
- Product Dimensions: 21.6 x 14.0
- Paperback: 200 pages
- ISBN-13: 978-1908043740
Memory Dump Analysis Anthology, Volume 7
The following direct links can be used to order the book now:
Buy Kindle version
Buy Paperback or Hardcover
 from Amazon
Buy Paperback or Hardcover from Barnes & Noble
Buy Paperback or Hardcover from Book Depository
Also available in PDF format from Software Diagnostics Services
Contains revised, edited, cross-referenced, and thematically organized selected articles from Software Diagnostics Institute (DumpAnalysis.org + TraceAnalysis.org) and Software Diagnostics Library (former Crash Dump Analysis blog, DumpAnalysis.org/blog) about software diagnostics, debugging, crash dump analysis, software trace and log analysis, malware analysis and memory forensics written in November 2011 - May 2014 for software engineers developing and maintaining products on Windows (WinDbg) and Mac OS X (GDB) platforms, quality assurance engineers testing software, technical support and escalation engineers dealing with complex software issues, security researchers, malware analysts, reverse engineers, and memory forensics analysts. The seventh volume features:
- 66 new crash dump analysis patterns
- 46 new software log and trace analysis patterns
- 18 core memory dump analysis patterns for Mac OS X and GDB
- 10 malware analysis patterns
- Additional unified debugging pattern
- Additional user interface problem analysis pattern
- Additional pattern classification including memory and log acquisition patterns
- Additional .NET memory analysis patterns
- Introduction to software problem description patterns
- Introduction to software diagnostics patterns
- Introduction to general abnormal structure and behaviour patterns
- Introduction to software disruption patterns
- Introduction to static code analysis patterns
- Introduction to network trace analysis patterns
- Introduction to software diagnostics report schemes
- Introduction to elementary software diagnostics patterns
- Introduction to patterns of software diagnostics architecture
- Introduction to patterns of disassembly, reconstruction and reversing
- Introduction to vulnerability analysis patterns
- Fully cross-referenced with Volume 1, Volume 2, Volume 3, Volume 4, Volume 5, and Volume 6
Product information:
- Title: Memory Dump Analysis Anthology, Volume 7
- Authors: Dmitry Vostokov, Software Diagnostics Institute
- Language: English
- Product Dimensions: 22.86 x 15.24
- Paperback: 523 pages
- Publisher: OpenTask (June 2014)
- ISBN-13: 978-1-908043-51-1
- Hardcover: 523 pages
- Publisher: OpenTask (June 2014)
- ISBN-13: 978-1-908043-52-8

Back cover features a "liquid memory" image created with Photoshop from contents of computer memory.
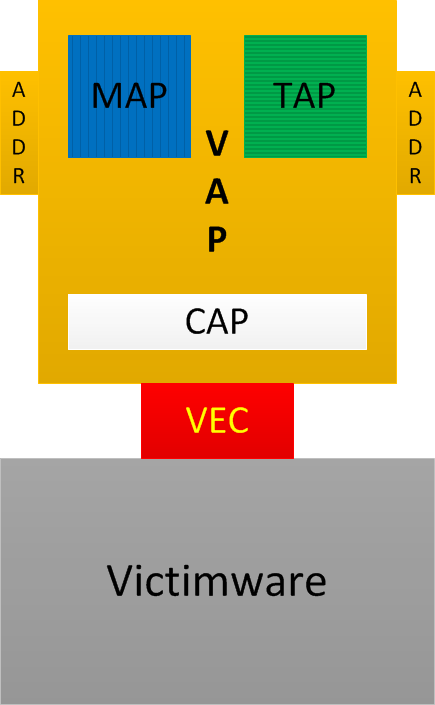
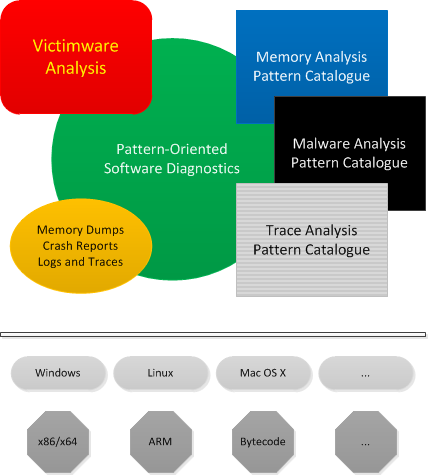
Vulnerability Analysis Patterns (VAP)
These are general patterns of software vulnerability: synthesis of analysis patterns from the following software diagnostics catalogues:
- MAP - Memory Analysis Patterns (include behavioural and structural patterns)
- TAP - Trace Analysis Patterns
- CAP - Code Analysis Patterns (previously introduced as Static Code Analysis Patterns)
- ADDR - Deconstruction, Disassembly, and Reversing (binary equivalent of CAP) Patterns (the current list is available here)
Also:
VEC - Vulnerability, Exploit, and Control of Victimware
Victimware - bugs of software (including bugs of malware) + vulnerabilities (provocative and precipitative victimware)
For victimware classification please look at this presentation: http://www.dumpanalysis.org/victimware-book
The following easy to remember diagram combines all these acronyms and terminology:
The first pattern we suggest is called Versioned Namespace. It is similar to Namespace malware analysis pattern but covers victimware side. Not only some API sets seen from source code and binaries but their versions also have importance. Again, this proposed new catalogue contains general analysis patterns, not specific operating system and product patterns. More patterns will be added later according to our pattern-based software diagnostics incremental and iterative methodology.
Software Diagnosis Codes
While working on Diagnostic Manual of Software Problems (DMS) announced last year we found the need to introduce software diagnostic codes. The proposed natural candidate schema is based on pattern orientation and pattern catalogues. It consists of a major and minor codes. The major code is a combination of one letter software artefact type, three letter structural classifier, and 3 letter behavioural pattern classifier:
Artefact Type - Structural Pattern - Behavioural Pattern
For example:
M-THR-SPK
Memory - Thread - Spike which corresponds to Spiking Thread pattern from memory analysis catalogue.
The optional minor code is not currently specified but may include pattern implementation such as operating system platform including CPU architecture, for, example: WIN.X32 or OSX.X64. So the final code may look like:
M-THR-SPK.WIN.X64
Software Diagnostics Metaphors
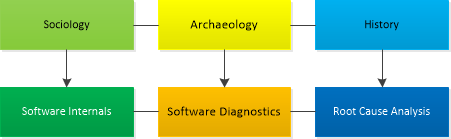
Software Diagnostics as Archaeology
Analogy: studying software execution artifacts and traces left in artefacts by software execution. Traces themselves may have undergone ageing, e.g. memory overwrites. Root Cause Analysis uses mechanisms from Software Internals to understand causal connections and reconstruct original software execution context.
- Sociology - Software Internals
- Archeology - Software Diagnostics
- History - Root Cause Analysis
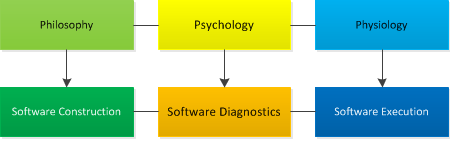
Software Diagnostics as Psychology
Analogy: studying how code construction ideas are executed.
- Philosophy - Software Construction
- Psychology - Software Diagnostics
- Physiology - Software Execution
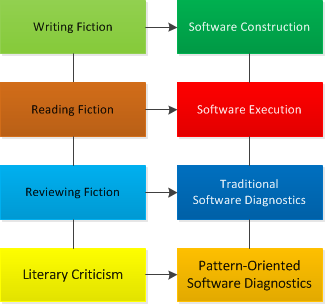
Software Diagnostics as Literary Criticism
Analogy: studying patterns across software execution artefacts such as software narratives (traces and logs) and memory snapshots.
- Writing Fiction - Software Construction
- Reading Fiction - Software Execution
- Reviewing Fiction - Traditional Software Diagnostics
- Literary Criticism - Pattern-Oriented Software Diagnostics
Rapid Software Diagnostics Process (RSDP)
Increased complexity of software incidents and their growing numbers require fast responses. We reviewed and partitioned our pattern catalogues into two tiers. The first tier requires less analysis efforts and provides faster response time than the second tier. The revised memory and trace analysis catalogues together with adjusted checklists will be published soon.
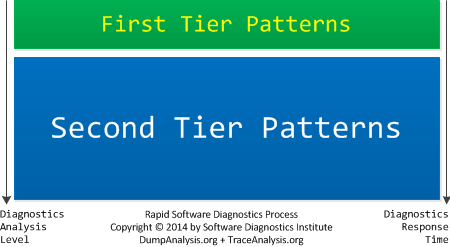
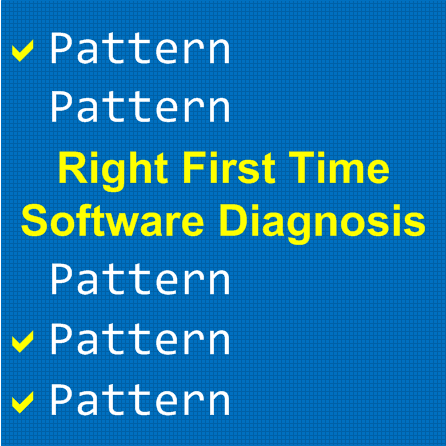
Right First Time Software Diagnosis
Right First Time Software Diagnostics is based on pattern-oriented diagnostics process and pattern catalogues.
Book: Advanced Windows RT Memory Dump Analysis, ARM Edition
The following direct links can be used to order the print version:
Buy Paperback from Amazon
Buy Paperback from Barnes & Noble
Buy Paperback from Book Depository
The full transcript of Software Diagnostics Services training with 9 step-by-step exercises. Learn how to navigate through memory dump space and Windows data structures to perform memory forensics, troubleshoot and debug complex software incidents. The training uses a unique and innovative pattern-driven analysis approach to speed up the learning curve. It consists of practical step-by-step exercises using WinDbg to diagnose structural and behavioural patterns in Windows RT kernel and complete (physical) memory dumps. Additional topics include memory search, kernel linked list navigation, practical WinDbg scripting, registry, system variables and objects, device drivers and I/O, memory mapped and cached files content.
Prerequisites: Basic and intermediate level Windows memory dump analysis: ability to list processors, processes, threads, modules, apply symbols, and walk through stack traces.
Audience: Software developers, software technical support and escalation engineers, reverse and security research engineers, digital forensic analysts.
- Title: Advanced Windows RT Memory Dump Analysis, ARM Edition: Training Course Transcript and WinDbg Practice Exercises
- Authors: Dmitry Vostokov, Software Diagnostics Services
- Publisher: OpenTask (March 2014)
- Language: English
- Product Dimensions: 28.0 x 21.6
- Paperback: 190 pages
- ISBN-13: 978-1908043733
Accelerated Mac OS X Core Dump Analysis: LLDB Exercises
Warning! Contains only exercises for LLDB debugger.
The following direct links can be used to order the print version:
Buy Paperback from Amazon
Buy Paperback from Barnes & Noble
Buy Paperback from Book Depository
This is an update for Accelerated Mac OS X Core Dump Analysis: Training Course Transcript and GDB Practice Exercises (ISBN: 978-1908043405) book. In Mac OS X Mavericks GDB was replaced by LLDB debugger. All GDB exercises were reworked and updated for LLDB. The original first edition also contains slide transcripts and selected memory analysis pattern descriptions which are missing in this update. This update contains only LLDB exercises. If you don't have the first edition of this course then Accelerated Mac OS X Core Dump Analysis, Second Edition: Training Course Transcript with GDB and LLDB Practice Exercises (ISBN: 978-1908043719) is recommended instead of this update.
- Title: Accelerated Mac OS X Core Dump Analysis: LLDB Exercises
- Authors: Dmitry Vostokov, Software Diagnostics Services
- Publisher: OpenTask (March 2014)
- Language: English
- Product Dimensions: 28.0 x 21.6
- Paperback: 146 pages
- ISBN-13: 978-1908043726
Table of Contents
Review
Amazon Reviews for the previous GDB edition
Detecting and Predicting the Unknown
A. The approach of Victimware1 (which includes abnormal behaviour of Malware such as crashes, hangs, resource leaks, CPU spikes) together with memory, malware, and log analysis pattern catalogues allows to detect unknown malware in software diagnostics and digital forensics artefacts such as memory dumps, crash reports, and software traces and logs: pattern-driven software diagnostics2 and forensics4.
B. Structural and behavioural patterns found on one operating system and/or processor architecture can be predicted for another: pattern-based software diagnostics3 and forensics4.
References:
1 http://www.dumpanalysis.org/victimware-book
2 http://www.dumpanalysis.org/introduction-pattern-driven-diagnostics
3 http://www.dumpanalysis.org/introduction-pattern-based-software-diagnost...
4 http://www.dumpanalysis.org/pattern-oriented-memory-forensics
Pattern-Oriented Software Forensics
The following direct links can be used to order the book now:
Buy Kindle version
Buy Paperback from Amazon
Buy Paperback from Barnes & Noble
Buy Paperback from Book Depository
Available for SkillSoft Books24x7 subscribers
![]()
This is a transcript of Software Diagnostics Services seminar about a comprehensive theory behind software forensics based on systemic and pattern-oriented software diagnostics developed by Software Diagnostics Institute. It synthesises pattern-oriented memory analysis of malware and victimware with pattern-oriented software log and trace analysis based on software narratology.
- Title: Pattern-Oriented Software Forensics: A Foundation of Memory Forensics and Forensics of Things
- Author: Dmitry Vostokov, Software Diagnostics Services
- Publisher: OpenTask (February 2014)
- Language: English
- Product Dimensions: 28.0 x 21.6
- Paperback: 44 pages
- ISBN-13: 978-1908043696
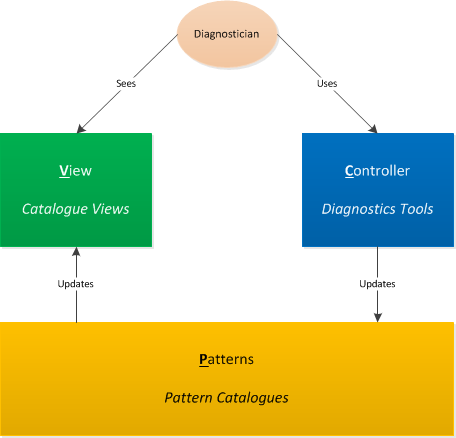
Patterns of Software Diagnostics Architecture
In the Debugging TV episode 0x1A we introduced a vision of software diagnostics architecture and its architectural patterns. The latter are usual patterns of software architecture if we design software diagnostics software. However, if we consider a software diagnostics system architecture in a wider context involving its users and human-assisted pattern-orientation there is a need to devise new patterns such as Patterns - View - Controller (PVC) where:
- Patterns - represent pattern catalogues from pattern-driven and pattern-based software diagnostics methodology. It corresponds to Model in traditional Model - View - Controller software architecture pattern.
- View - represents pattern catalogue(s) view which might include concrete pattern implementations such as OS and product specifics. A view can also be based on an intersection of several pattern catalogues, for example, memory analysis, malware analysis, and trace analysis. A user diagnostician sees such views. Any updates to underlying pattern catalogues are reflected in pattern views.
- Controller - represents software diagnostics tools architecture and designed using software construction patterns. Such tools may include automated diagnostics or human-assisted debuggers and problem analysis tools. A user diagnostician uses such controllers. Such use may result in updates to underlying pattern catalogues when a new pattern is discovered, for example.
This software diagnostics architecture pattern is illustrated on the following diagram:
Trace Acquisition Pattern Catalogue
In addition to existing pattern catalogues such as for trace analysis we introduce patterns of trace acquisition as general platform and product independent reusable solutions to commonly occurring tracing and logging problems applicable in specific contexts. Here's the current list applicable to both software and network tracing:
- Trace Placing Map
- Trace Timing Plan
- Use Case Coverage
- Supplemental System Tracing
- Supplemental Network Tracing
- Supplemental Memory Acquisition
- Full Capture Tracing
- Tuned Capture Tracing
- First Occurrence Tracing
- Differential Strategy Tracing
Software Diagnostics Services is updating its Accelerated Software Trace Analysis training with complete pattern descriptions, examples and pattern-oriented trace acquisition requirements, design and implementation labs. The initial list of trace acquisition patterns may be revised and extended if necessary.
Memory Acquisition Pattern Catalogue
Software: the parts of a computer that can be dumped.
In addition to existing pattern catalogues such as for memory analysis we introduce patterns of memory acquisition as general platform and product independent reusable solutions to commonly occurring memory acquisition problems applicable in specific contexts. Here's the current list with their classification:
Structural Space Patterns
General
- State Summary Dump
- Region Memory Dump
Volatile
- Process Memory Dump
- Kernel memory Dump
- Physical Memory Dump
- Hyper Memory Dump
- Fibre Bundle Dump
Persistent
- File Memory Dump
- Storage Memory Dump
Acquisition Strategy Patterns
- External Dump
- Self Dump
- Conditional Dump
- Dump Sequence
- Transactional Dump
Software Diagnostics Services is developing Accelerated Memory Acquisition training with complete pattern descriptions, examples and pattern-oriented memory acquisition requirements, design and implementation labs. The initial list of memory acquisition patterns may be revised and extended if necessary.
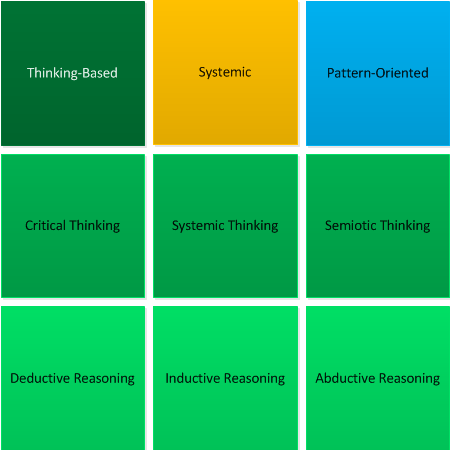
Thinking-Based Software Diagnostics
As The Year of Software Diagnostics is almost finished we unveil a new type of software diagnostics in addition to pattern-oriented and systemic.
It is based on:
- Critical thinking
- Systemic thinking
- Semiotic thinking
and uses:
- Inductive reasoning
- Deductive reasoning
- Abductive reasoning
Introducing Software Narratology of Things (Software NT)
This is the further development of Software Narratology (T -> M) and Generalized Software Narratives (M -> M -> M -> ...). Now it incorporates devices (things) and IoT. Whereas the general narrative space is 2M1T:
the narrative space of NT is "complex" 2M2T:
Narratology of Things also incorporates Hardware Narratology.