Multiple Exceptions (user mode) - Modeling Example
 Multiple Exceptions (kernel mode)
 Multiple Exceptions (managed space)
- Multiple Exceptions (stowed)
 Dynamic Memory Corruption (process heap)
 Dynamic Memory Corruption (kernel pool)
- Dynamic Memory Corruption (managed heap)
 False Positive Dump
 Lateral Damage (general)
- Lateral Damage (CPU mode)
 Optimized Code (function parameter reuse)
 Invalid Pointer (general)
- Invalid Pointer (objects)
 NULL Pointer (code)
 NULL Pointer (data)
 Inconsistent Dump
 Hidden Exception (user space)
- Hidden Exception (kernel space)
- Hidden Exception (managed space)
 Deadlock (critical sections)
 Deadlock (executive resources)
 Deadlock (mixed objects, user space)
 Deadlock (LPC)
 Deadlock (mixed objects, kernel space)
 Deadlock (self)
- Deadlock (managed space)
- Deadlock (.NET Finalizer)
 Changed Environment
 Incorrect Stack Trace
 OMAP Code Optimization
 No Component Symbols
 Insufficient Memory (committed memory)
 Insufficient Memory (handle leak)
 Insufficient Memory (kernel pool)
 Insufficient Memory (PTE)
 Insufficient Memory (module fragmentation)
 Insufficient Memory (physical memory)
 Insufficient Memory (control blocks)
- Insufficient Memory (reserved virtual memory)
- Insufficient Memory (session pool)
- Insufficient Memory (stack trace database)
- Insufficient Memory (region)
- Insufficient Memory (stack)
 Spiking Thread
 Module Variety
 Stack Overflow (kernel mode)
 Stack Overflow (user mode)
 Stack Overflow (software implementation)
- Stack Overflow (insufficient memory)
- Stack Overflow (managed space)
 Managed Code Exception
- Managed Code Exception (Scala)
- Managed Code Exception (Python)
 Truncated Dump
 Waiting Thread Time (kernel dumps)
 Waiting Thread Time (user dumps)
 Memory Leak (process heap) - Modeling Example
 Memory Leak (.NET heap)
- Memory Leak (page tables)
- Memory Leak (I/O completion packets)
- Memory Leak (regions)
 Missing Thread
 Unknown Component
 Double Free (process heap)
 Double Free (kernel pool)
 Coincidental Symbolic Information
 Stack Trace
- Stack Trace (I/O request)
- Stack Trace (file system filters)
- Stack Trace (database)
- Stack Trace (I/O devices)
 Virtualized Process (WOW64)
 Stack Trace Collection (unmanaged space)
- Stack Trace Collection (managed space)
- Stack Trace Collection (predicate)
- Stack Trace Collection (I/O requests)
- Stack Trace Collection (CPUs)
 Coupled Processes (strong)
 Coupled Processes (weak)
 Coupled Processes (semantics)
 High Contention (executive resources)
 High Contention (critical sections)
 High Contention (processors)
- High Contention (.NET CLR monitors)
- High Contention (.NET heap)
- High Contention (sockets)
 Accidental Lock
 Passive Thread (user space)
 Passive System Thread (kernel space)
 Main Thread
 Busy System
 Historical Information
 Object Distribution Anomaly (IRP)
- Object Distribution Anomaly (.NET heap)
 Local Buffer Overflow (user space)
- Local Buffer Overflow (kernel space)
 Early Crash Dump
 Hooked Functions (user space)
 Hooked Functions (kernel space)
- Hooked Modules
 Custom Exception Handler (user space)
 Custom Exception Handler (kernel space)
 Special Stack Trace
 Manual Dump (kernel)
 Manual Dump (process)
 Wait Chain (general)
 Wait Chain (critical sections)
 Wait Chain (executive resources)
 Wait Chain (thread objects)
 Wait Chain (LPC/ALPC)
 Wait Chain (process objects)
 Wait Chain (RPC)
 Wait Chain (window messaging)
 Wait Chain (named pipes)
- Wait Chain (mutex objects)
- Wait Chain (pushlocks)
- Wait Chain (CLR monitors)
- Wait Chain (RTL_RESOURCE)
- Wait Chain (modules)
- Wait Chain (nonstandard synchronization)
- Wait Chain (C++11, condition variable)
- Wait Chain (SRW lock)
 Corrupt Dump
 Dispatch Level Spin
 No Process Dumps
 No System Dumps
 Suspended Thread
 Special Process
 Frame Pointer Omission
 False Function Parameters
 Message Box
 Self-Dump
 Blocked Thread (software)
 Blocked Thread (hardware)
- Blocked Thread (timeout)
 Zombie Processes
 Wild Pointer
 Wild Code
 Hardware Error
 Handle Limit (GDI, kernel space)
- Handle Limit (GDI, user space)
 Missing Component (general)
 Missing Component (static linking, user mode)
 Execution Residue (unmanaged space, user)
- Execution Residue (unmanaged space, kernel)
- Execution Residue (managed space)
 Optimized VM Layout
- Invalid Handle (general)
- Invalid Handle (managed space)
- Overaged System
- Thread Starvation (realtime priority)
- Thread Starvation (normal priority)
- Duplicated Module
- Not My Version (software)
- Not My Version (hardware)
- Data Contents Locality
- Nested Exceptions (unmanaged code)
- Nested Exceptions (managed code)
- Affine Thread
- Self-Diagnosis (user mode)
- Self-Diagnosis (kernel mode)
- Self-Diagnosis (registry)
- Inline Function Optimization (unmanaged code)
- Inline Function Optimization (managed code)
- Critical Section Corruption
- Lost Opportunity
- Young System
- Last Error Collection
- Hidden Module
- Data Alignment (page boundary)
- C++ Exception
- Divide by Zero (user mode)
- Divide by Zero (kernel mode)
- Swarm of Shared Locks
- Process Factory
- Paged Out Data
- Semantic Split
- Pass Through Function
- JIT Code (.NET)
- JIT Code (Java)
- Ubiquitous Component (user space)
- Ubiquitous Component (kernel space)
- Nested Offender
- Virtualized System
- Effect Component
- Well-Tested Function
- Mixed Exception
- Random Object
- Missing Process
- Platform-Specific Debugger
- Value Deviation (stack trace)
- Value Deviation (structure field)
- Runtime Thread (CLR)
- Runtime Thread (Python, Linux)
- Coincidental Frames
- Fault Context
- Hardware Activity
- Incorrect Symbolic Information
- Message Hooks - Modeling Example
- Coupled Machines
- Abridged Dump
- Exception Stack Trace
- Distributed Spike
- Instrumentation Information
- Template Module
- Invalid Exception Information
- Shared Buffer Overwrite
- Pervasive System
- Problem Exception Handler
- Same Vendor
- Crash Signature
- Blocked Queue (LPC/ALPC)
- Fat Process Dump
- Invalid Parameter (process heap)
- Invalid Parameter (runtime function)
- String Parameter
- Well-Tested Module
- Embedded Comment
- Hooking Level
- Blocking Module
- Dual Stack Trace
- Environment Hint
- Top Module
- Livelock
- Technology-Specific Subtrace (COM interface invocation)
- Technology-Specific Subtrace (dynamic memory)
- Technology-Specific Subtrace (JIT .NET code)
- Technology-Specific Subtrace (COM client call)
- Dialog Box
- Instrumentation Side Effect
- Semantic Structure (PID.TID)
- Directing Module
- Least Common Frame
- Truncated Stack Trace
- Data Correlation (function parameters)
- Data Correlation (CPU times)
- Module Hint
- Version-Specific Extension
- Cloud Environment
- No Data Types
- Managed Stack Trace
- Managed Stack Trace (Scala)
- Managed Stack Trace (Python)
- Coupled Modules
- Thread Age
- Unsynchronized Dumps
- Pleiades
- Quiet Dump
- Blocking File
- Problem Vocabulary
- Activation Context
- Stack Trace Set
- Double IRP Completion
- Caller-n-Callee
- Annotated Disassembly (JIT .NET code)
- Annotated Disassembly (unmanaged code)
- Handled Exception (user space)
- Handled Exception (.NET CLR)
- Handled Exception (kernel space)
- Duplicate Extension
- Special Thread (.NET CLR)
- Hidden Parameter
- FPU Exception
- Module Variable
- System Object
- Value References
- Debugger Bug
- Empty Stack Trace
- Problem Module
- Disconnected Network Adapter
- Network Packet Buildup
- Unrecognizable Symbolic Information
- Translated Exception
- Regular Data
- Late Crash Dump
- Blocked DPC
- Coincidental Error Code
- Punctuated Memory Leak
- No Current Thread
- Value Adding Process
- Activity Resonance
- Stored Exception
- Spike Interval
- Stack Trace Change
- Unloaded Module
- Deviant Module
- Paratext
- Incomplete Session
- Error Reporting Fault
- First Fault Stack Trace
- Frozen Process
- Disk Packet Buildup
- Hidden Process
- Active Thread (Mac OS X)
- Active Thread (Windows)
- Critical Stack Trace
- Handle Leak
- Module Collection
- Module Collection (predicate)
- Deviant Token
- Step Dumps
- Broken Link
- Debugger Omission
- Glued Stack Trace
- Reduced Symbolic Information
- Injected Symbols
- Distributed Wait Chain
- One-Thread Process
- Module Product Process
- Crash Signature Invariant
- Small Value
- Shared Structure
- Thread Cluster
- False Effective Address
- Screwbolt Wait Chain
- Design Value
- Hidden IRP
- Tampered Dump
- Memory Fluctuation (process heap)
- Last Object
- Rough Stack Trace (unmanaged space)
- Rough Stack Trace (managed space)
- Past Stack Trace
- Ghost Thread
- Dry Weight
- Exception Module
- Reference Leak
- Origin Module
- Hidden Call
- Corrupt Structure
- Software Exception
- Crashed Process
- Variable Subtrace
- User Space Evidence
- Internal Stack Trace
- Distributed Exception (managed code)
- Thread Poset
- Stack Trace Surface
- Hidden Stack Trace
- Evental Dumps
- Clone Dump
- Parameter Flow
- Critical Region
- Diachronic Module
- Constant Subtrace
- Not My Thread
- Window Hint
- Place Trace
- Stack Trace Signature
- Relative Memory Leak
- Quotient Stack Trace
- Module Stack Trace
- Foreign Module Frame
- Unified Stack Trace
- Mirror Dump Set
- Memory Fibration
- Aggregated Frames
- Frame Regularity
- Stack Trace Motif
- System Call
- Stack Trace Race
- Hyperdump
- Disassembly Ambiguity
- Exception Reporting Thread
- Active Space
- Subsystem Modules
- Region Profile
- Region Clusters
- Source Stack Trace
- Hidden Stack
- Interrupt Stack
- False Memory
- Frame Trace
- Pointer Cone
- Context Pointer
- Pointer Class
- False Frame
- Procedure Call Chain
- C++ Object
- COM Exception
- Structure Sheaf
- Saved Exception Context (.NET)
- Shared Thread
- Spiking Interrupts
- Structure Field Collection
- Black Box
- Rough Stack Trace Collection (unmanaged space)
- COM Object
- Shared Page
- Exception Collection
- Dereference Nearpoint
- Address Representations
- Near Exception
- Shadow Stack Trace
- Past Process
- Foreign Stack
- Annotated Stack Trace
- Disassembly Summary
- Region Summary
- Analysis Summary
- Region Spectrum
- Normalized Region
Accelerated Software Trace Analysis, Revised Edition, Part 1: Fundamentals and Basic Patterns
The following direct links can be used to order the book:
Buy Kindle print replica from Amazon
Buy PDF from Leanpub
Also available in PDF format from Software Diagnostics Technology and Services
This book is a revised edition of the original Accelerated Windows Software Trace Analysis training course. General trace and log analysis pattern language covers any execution artifact from a small debugging trace to a distributed log with billions of messages from hundreds of computers, thousands of software components, threads, and processes. It also allows the application of uniform diagnostics and anomaly detection across diverse software environments, troubleshooting and debugging Windows, Mac OS X, Linux, Android, iOS, and any other possible computer platform including networking and IoT. Part 1 covers fundamentals and explains more than 60 basic trace and log analysis patterns, which are now cross-referenced in this improved and less Windows-centric edition. It can also serve as a reference.
- Title: Accelerated Software Trace Analysis, Revised Edition, Part 1: Fundamentals and Basic Patterns
- Authors: Dmitry Vostokov, Software Diagnostics Services
- Publisher: OpenTask (December 2021)
- Language: English
- Product Dimensions: 28.0 x 21.6
- Paperback: 110 pages
- ISBN-13: 978-1912636310
The Dream of Quantum Software Diagnostics
We are adding quantum computing to our research agenda now by coining "Quantum Software Diagnostics" as a way to analyze different parts of very large software execution artifacts simultaneously, make sense of entire software traces and logs, and predict software behavior (software prognostics). It contains two adjoint phrases centered around Software: left adjoint Quantum Software Diagnostics and right adjoint Quantum Software Diagnostics. The former is about diagnosing quantum software, and the latter is about applying quantum methods to problems of software diagnostics.
In June 2009, we wrote in Memory Dump Analysis Anthology, Volume 3:
"Quantum computation, quantum memory, and quantum information are hot topics today. Unfortunately, quantum mechanics forbids perfect (ideal) memory dumps due to the so-called no-cloning theorem. Still, it is possible to get inconsistent (imperfect) memory dumps, and perfect memory dumps can be made from quantum computer simulators. The analysis of quantum memory snapshots is the domain of Quantum Memoretics."
Since then, we have added traces and logs, text, narrative, data to our pattern-oriented analysis approach. Now we broaden the application of quantum ideas and algorithms and add quantum information processing to our decades' long interest in contemporary mathematics, quantum theory foundations and applications to various domains, logic, semiotics, categories, and recently, in ML/AI, unconventional computing, conceptual mathematics, topos theory, and functional programming.
Online Training: Accelerated .NET Core Memory Dump Analysis
Software Diagnostics Services organizes this online training course.

New dates/times TBD
Learn how to analyze .NET Core application and service crashes and freezes, navigate through memory dump space (managed and unmanaged code) and diagnose corruption, leaks, CPU spikes, blocked threads, deadlocks, wait chains, resource contention, and much more. The training uses a unique and innovative pattern-oriented analysis approach to speed up the learning curve, includes 10 practical step-by-step exercises using the latest Microsoft WinDbg debugger to diagnose patterns in 64-bit process memory dumps, notes, source code of specially created modeling applications, and selected Q&A. It covers more than 20 .NET memory dump analysis patterns plus additional 15 unmanaged patterns and is based on the fourth edition of the Accelerated .NET Memory Dump Analysis book with additional and revised exercises updated for Windows 11.
Slides from the previous training version
The training consists of 2 two-hour sessions. When you finish the training you additionally get:
- The updated PDF book version
- Practical Foundations of Windows Debugging, Disassembling, Reversing PDF book
- Access to Software Diagnostics Library with more than 370 cross-referenced patterns of memory dump analysis, their classification, and more than 70 case studies
- Personalized Certificate of Attendance with unique CID
- Optional Personalized Certificate of Completion with unique CID (after the tests)
- Answers to questions during training sessions
- Recording
Prerequisites: Basic .NET programming and debugging.
Audience: Software technical support and escalation engineers, system administrators, DevOps, performance and reliability engineers, software developers, and quality assurance engineers.
If you are mainly interested in unmanaged Windows desktop and server memory dump analysis there is another course available: Accelerated Windows Memory Dump Analysis training or the corresponding book.
Visual Category Theory
The current full set in either PDF or paperback or both is available for purchase from Software Diagnostics Services
Download Sample Pages and Index
Concepts from category theory were used as metaphors for some trace and log analysis patterns (see Mathematical Concepts in Software Diagnostics and Software Data Analysis) and also as a foundation of software diagnostics (see Categorical Foundations of Software Diagnostics) as a part of Theoretical Software Diagnostics. However, category theory abstractions are very challenging to apprehend correctly, require a steep learning curve for non-mathematicians, and, for people with traditional naïve set theory education, a paradigm shift in thinking. The book utilizes a novel approach to teach category theory and abstract mathematics in general by using LEGO® bricks. This method was discovered when applying the same technique to teach machine learning, its data structures and algorithms, particularly directed graphs.
Part 0 (ISBN-13: 978-1912636396) covers universe and sets, set-builder notation, set membership, set inclusion, subsets as members, membership vs. subset, powerset, relations, functions, domain, codomain, range, injection, surjection, bijection, product, union, intersection, set difference, symmetric set difference, sets of functions, function composition, inverse functions.

In order to facilitate earlier adoption and feedback, the book was split into small manageable parts. Part 1 (ISBN-13: 978-1912636402) is currently available on Leanpub and Amazon Kindle Store. It covers the definition of categories, arrows, the composition and associativity of arrows, retracts, equivalence, covariant and contravariant functors, natural transformations, and 2-categories.

CoPart 1 (ISBN-13: 978-1912636815) is a dual complement to Visual Category Theory Brick by Brick, Part 1. It is currently available on Leanpub and Amazon Kindle Store. The original series translated abstract categorical concepts into the language of LEGO® bricks, and the CoPart series implement the opposite way of translating brick constructions to the standard diagram language of category theory that should benefit comprehension of definitions. Since usual categorical diagrams are black and white and occupy less space on paper, CoParts include additional color-enhanced diagrams in the spirit of brick constructions when arrow source and target parts use different colors. These CoParts from CoSeries (named after opposite categories with reversed arrows) keep the same 1-to-1 page correspondence between Parts and CoParts. Page layout is also similar: location of explanatory notes (written using standard mathematical notation) is the same — only bricks are replaced by letters, dots, and arrows. Therefore, this CoSeries can be used independently from the original series or together.

Part 2 (ISBN-13: 978-1912636419) is currently available on Leanpub and Amazon Kindle Store. It covers duality, products, coproducts, biproducts, initial and terminal objects, pointed categories, matrix representation of morphisms, and monoids.

CoPart 2 (ISBN-13: 978-1912636822) is a dual complement to Visual Category Theory Brick by Brick, Part 2. It is currently available on Leanpub and Amazon Kindle Store.

Part 3 (ISBN-13: 978-1912636426) is currently available on Leanpub and Amazon Kindle Store. It covers adjoint functors, diagram shapes and categories, cones and cocones, limits and colimits, pullbacks and pushouts.

CoPart 3 (ISBN-13: 978-1912636839) is a dual complement to Visual Category Theory Brick by Brick, Part 3. It is currently available on Leanpub.

Part 4 (ISBN-13: 978-1912636433) is currently available on Leanpub and Amazon Kindle Store. It covers non-concrete categories, group objects, monoid, group, opposite, arrow, slice, and coslice categories, forgetful functors, monomorphisms, epimorphisms, and isomorphisms.

Part 5 (ISBN-13: 978-1912636440) is currently available on Leanpub and Amazon Kindle Store. It covers exponentials and evaluation in sets and categories, subobjects, equalizers, equivalence classes and quotients, coequalizers, congruence categories, morphism functors, and presheaves.

Part 6 (ISBN-13: 978-1912636457) is currently available on Leanpub and Amazon Kindle Store. It covers ideas that require a leap of abstraction: vertical and whisker compositions of natural transformations, identity and isomorphism of functors, equivalence, isomorphism, and adjoint equivalence of categories, functor and morphism categories, natural transformations as functors, representable functors, category of presheaves, Yoneda embedding and lemma. It also includes an index for parts 1 - 6.

Part 7 (ISBN-13: 978-1912636464) is currently available on Leanpub and Amazon Kindle Store. It covers ideas related to functional programming: exponentials, disjoint unions, endofunctors and natural transformations, partial and total functions, monads.


The first 5 parts are available as Visual Category Theory bundle on Leanpub.
All 8 parts together are now available in paperback format:
- Title: Visual Category Theory Brick by Brick: Diagrammatic LEGO® Reference
- Authors: Dmitry Vostokov
- Publisher: OpenTask (October 2021)
- Language: English
- Product Dimensions: 16.5 x 16.5 cm (6.5 x 6.5 in)
- Paperback: 172 pages
- ISBN-13: 978-1912636389
Also available on Amazon and Barnes&Noble.
Applications of category theory to software diagnostics also include Software Codiagnostics and Diagnostic Operads.
Encyclopedia of Crash Dump Analysis Patterns, Third Edition
The following direct links can be used to order the book now:
Buy PDF from Leanpub
Buy Kindle print replica edition from Amazon
Also available in PDF format from Software Diagnostics Services
The first edition is available for SkillSoft Books24x7 subscribers
![]()
This reference reprints with corrections, additional comments, and classification more than 370 alphabetically arranged and cross-referenced memory analysis patterns originally published in Memory Dump Analysis Anthology volumes 1 – 13. This pattern catalog is a part of pattern-oriented software diagnostics, forensics, prognostics, root cause analysis, and debugging developed by Software Diagnostics Institute. Most of the analysis patterns are illustrated with examples for WinDbg from Debugging Tools for Windows with a few examples from Mac OS X and Linux for GDB. The third edition includes more than 40 new analysis patterns, more than 30 new examples and comments for analysis patterns published in the previous editions, updated bibliography and links, improved illustrations and debugger output snippets with extra visual highlighting.
Product information:
- Title: Encyclopedia of Crash Dump Analysis Patterns: Detecting Abnormal Software Structure and Behavior in Computer Memory, Third Edition
- Authors: Dmitry Vostokov, Software Diagnostics Institute
- Language: English
- Product Dimensions: 24.6 x 18.9
- PDF: 1,326 pages
- Publisher: OpenTask (September 2020)
- ISBN-13: 978-1-912636303
Introducing Diagnomicon
Recently we noticed the increased usage of -nomicon Ancient Greek suffix that signifies books with some length, prominence within, and importance to some field of knowledge, or simply, "pertaining to rules," or "book of." It is a combination of nomos (νόμος, law), and icon (εἰκών eikon, image). At the same time, We've been using the Memory Dump Analysis Anthology phrase for more than 15 years and used to abbreviate it as MDAA. Over the years, this massive book sequence accumulated almost 5,000 pages and now includes writing on trace and log analysis and diagnostics in general. We found that the word Diagnomicon was never used before (perhaps we even coined it), and we took it as an extra MDAA book name. We also acquired the Diagnomicon.com domain that currently points to Software Diagnostics Institute, but we plan to make it a separate website soon dedicated to marketing the MDAA collection entirely.
Memory Dump Analysis Anthology, Volume 5, Revised Edition
The new Revised Edition is available!
Available in PDF format from Software Diagnostics Services
This reference volume consists of revised, edited, cross-referenced, and thematically organized articles from Software Diagnostics Institute and Software Diagnostics Library (former Crash Dump Analysis blog) written in February 2010 - October 2010. In addition to various corrections, this major revision updates relevant links and removes obsolete references. Some articles are preserved for historical reasons. Most of the content, especially memory analysis and trace and log analysis pattern languages, is still relevant today and for the foreseeable future. The output of WinDbg commands is also remastered to include color highlighting. Crash dump analysis pattern names are also corrected to reflect the continued expansion of the catalog. The fifth volume features:
- 25 new crash dump analysis patterns
- 11 new pattern interaction case studies (including software tracing)
- 16 new trace analysis patterns
- 7 structural memory patterns
- 4 modeling case studies for memory dump analysis patterns
- Discussion of 3 common analysis mistakes
- Malware analysis case study
- Computer independent architecture of crash analysis report service
- Expanded coverage of software narratology
- Metaphysical and theological implications of memory dump worldview
- More pictures of memory space and physicalist art
- Classification of memory visualization tools
- Memory visualization case studies
- Close reading of the stories of Sherlock Holmes: Dr. Watson’s observational patterns
- Fully cross-referenced with Volumes 1 - 4
The primary audience for Memory Dump Analysis Anthology reference volumes is: software engineers developing and maintaining products on Windows platforms, technical support, escalation, and site reliability engineers dealing with complex software issues, quality assurance engineers testing software on Windows platforms, security and vulnerability researchers, reverse engineers, malware and memory forensics analysts. Trace and log analysis articles may be of interest to users of other platforms.
Product information:
- Title: Memory Dump Analysis Anthology, Volume 5, Revised Edition
- Author: Dmitry Vostokov
- Language: English
- Product Dimensions: 22.86 x 15.24
- PDF: 431 pages
- Publisher: Opentask (September 2021)
- ISBN-13: 978-1912636259
Back cover features memory space art image Hot Computation: Memory on Fire.
Memory Dump Analysis Anthology, Volume 14
Available in PDF format from Software Diagnostics Services
This reference volume consists of revised, edited, cross-referenced, and thematically organized selected articles from Software Diagnostics Institute (DumpAnalysis.org + TraceAnalysis.org) and Software Diagnostics Library (former Crash Dump Analysis blog, DumpAnalysis.org/blog) about software diagnostics, root cause analysis, debugging, crash and hang dump analysis, software trace and log analysis written in August 2020 - 14 August 2021 for software engineers developing and maintaining products on Windows and Linux platforms, quality assurance engineers testing software, technical support, escalation and site reliability engineers dealing with complex software issues, security and vulnerability researchers, reverse engineers, malware and memory forensics analysts. This volume is fully cross-referenced with volumes 1 – 13 and features:
- 7 new crash dump analysis patterns with selected downloadable example memory dumps
- New crash dump analysis case study not previously published anywhere
- 14 new software trace and log analysis patterns
- Introduction to cloud analysis patterns
- Introduction to the fractal nature of software traces and logs
- Introduction to the general architecture of analysis pattern networks
- Lists of recommended books
Product information:
- Title: Memory Dump Analysis Anthology, Volume 14
- Authors: Dmitry Vostokov, Software Diagnostics Institute
- Language: English
- Product Dimensions: 22.86 x 15.24
- Paperback: 189 pages
- Publisher: OpenTask (August 2021)
- ISBN-13: 978-1-912636-14-3
Exercises in Logging Style
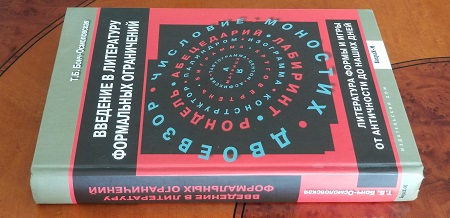
Years ago, I bought the book in Russia whose title is “Literature of Formal Constraints: Form and Games from Antiquity to Present Days” by Tatiana Bonch-Osmolovskaya if I translate it to English. Such literary techniques and patterns are also known under the term constrained writing. The reason why this book caught my attention in the bookshop is that at that time, I was developing software narratology as a foundation of trace and log analysis patterns. So, I planned to mine it for pattern writing. However, due to other pressures, I put it in a reading list until very recently, when reading a preface to Exercises in Programming Style, Second Edition, by Cristina Videira Lopes (ISBN-13: 978-0367350208), I learned about the Oulipo movement (writing under constraints). I immediately realized that software traces and logs are software narratives under constraints. I plan to explore such constraints by providing creative examples of trace and log statements and messages. As a metanarrative template, I chose a variation of narrative from Exercises in Style book by Raymond Queneau:
The software narrator “S” is a rule-based system tracing process, and it notices a long-running process that had loaded hat.dll and got into resource contention difficulties with another process. Two hours later, the software narrator notices the same process and a debugger process that gives some advice regarding the functionality of an extra GUI button.
Another variation I chose is the frequent message found in logs on the “access denied” theme. Such constraints may be personal and organizational preferences and styles, programming language, execution environment, and technology stack limitations, different coding phases (development, maintenance, early vs. mature code), external constraints such as source code scope, tracing and logging configuration and rules, timing, the need for a quick debugging fix, or understanding program state and behavior.
In writing these exercises in tracing style, I also plan to reference trace and log analysis patterns where appropriate.
I add links to variations as soon as they are published. I also consider them a part of the modeling activities I do while working on the Writing Bad Code book.
We are 15
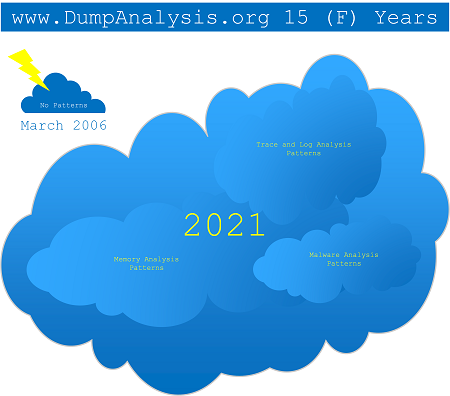
This month, www.DumpAnalysis.org turns 15 (F). Initially, in March 2006, it started as Crash Dump Analysis and Debugging Forum (now frozen at https://www.dumpanalysis.org/forum/ where old posts are available). In August 2006, it became Crash Dump Analysis Blog, later moved to https://www.dumpanalysis.org/blog/ and renamed to Software Diagnostics Library as only posts about analysis patterns became added to it. When the blog was moved, the root URL (https://dumpanalysis.org/) became Crash Dump Analysis Portal, later renamed to Software Diagnostics Institute in 2012.
Memory Dump Analysis Anthology, Volume 4, Revised Edition
The new Revised Edition is available!
Available in PDF format from Software Diagnostics Services
This reference volume consists of revised, edited, cross-referenced, and thematically organized articles from Software Diagnostics Institute and Software Diagnostics Library (former Crash Dump Analysis blog) written in July 2009 - January 2010. In addition to various corrections, this major revision updates relevant links and removes obsolete references. Some articles are preserved for historical reasons. Most of the content, especially memory analysis and trace and log analysis pattern languages, is still relevant today and for the foreseeable future. The output of WinDbg commands is also remastered to include color highlighting. Crash dump analysis pattern names are also corrected to reflect the continued expansion of the catalog. The fourth volume features:
- 15 new crash dump analysis patterns
- 13 new pattern interaction case studies
- 10 new trace analysis patterns
- 6 new Debugware patterns and case study
- Workaround patterns
- Updated checklist
- Fully cross-referenced with Volumes 1-3
- Memory visualization tutorials
- Memory space art
The primary audience for Memory Dump Analysis Anthology reference volumes is: software engineers developing and maintaining products on Windows platforms, technical support, escalation, and site reliability engineers dealing with complex software issues, quality assurance engineers testing software on Windows platforms, security and vulnerability researchers, reverse engineers, malware and memory forensics analysts. Trace and log analysis articles may be of interest to users of other platforms.
Product information:
- Title: Memory Dump Analysis Anthology, Volume 4, Revised Edition
- Authors: Dmitry Vostokov, Software Diagnostics Institute
- Publisher: OpenTask (March 2021)
- Language: English
- Product Dimensions: 22.86 x 15.24
- PDF: 423 pages
- ISBN-13: 978-1912636242


Back cover features memory space art image: Internal Process Combustion.
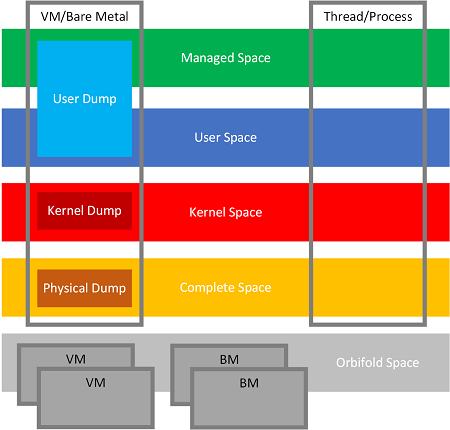
Introducing Methodology and System of Cloud Analysis Patterns (CAPS)
We wrote a short post about added complexities of virtualization almost 15 years ago and then about orbifold memory space (named cloud memory space initially) 10 years ago, reflecting cloud internals as a multi-VM/bare metal or multi-process distributed system.
At that time, memory dump analysis patterns were added for several types of memory space, including fiber bundle and manifold memory spaces, and we also held a webinar on cloud memory dump analysis:
In addition to the process/kernel dichotomy, managed space abstracts runtime environments such as .NET CLR.
This picture of complete and cloud spaces is somewhat simplified as it does not reflect the complexities of hypervisor types and some nested spaces, as in Hyperdumps.
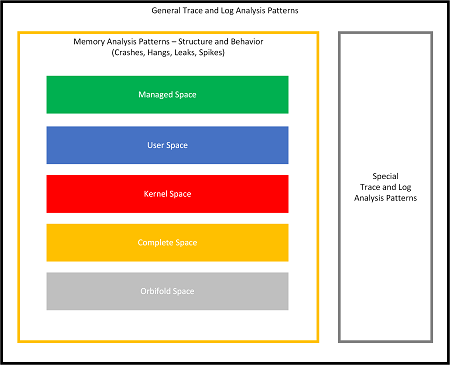
Also, at that time, trace and log analysis patterns were being extensively developed and later split into general and special analysis patterns, resulting in the current overall picture:
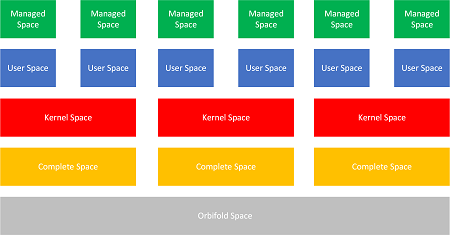
Memory dump types we can get from VM and traditional OS concepts such as threads and processes that span memory spaces are shown in this picture (spanning means that information about them can be found in all those memory dumps and associated spaces):
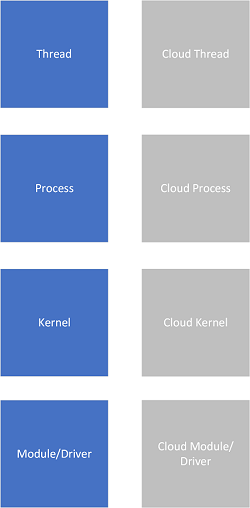
If we consider native cloud space as additional abstraction beyond the simple collection of memory spaces, we get the new native cloud memory space with corresponding cloud equivalents for traditional OS concepts:
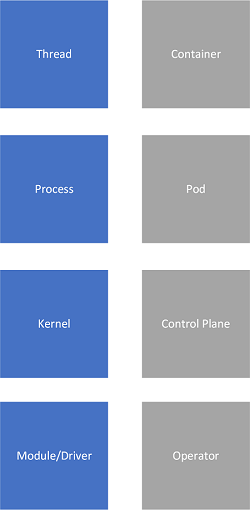
The advent of container orchestration platforms such as Kubernetes provides a similar hierarchy of concepts with containers corresponding to threads as units of execution, pods to processes as resource containers, kernel to control plane and kubelets, and operators to device drivers:
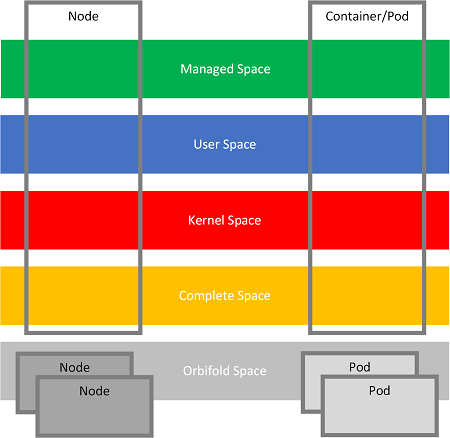
From the traditional memory perspective, Kubernetes concepts cut across the same spaces since they are implemented as collections of processes:
Our next step here is to adapt memory analysis pattern language to native cloud diagnostics and cloud problem analysis and provide analysis pattern specializations. The other part of software diagnostics, trace analysis pattern language, naturally extends to native cloud analysis, but from container environments, we recently discerned a few new log analysis patterns we plan to publish soon.
For the orchestration abstraction, we may add cluster space for nodes and pods in place of complete space and replace orbifold memory space with the native cloud space:
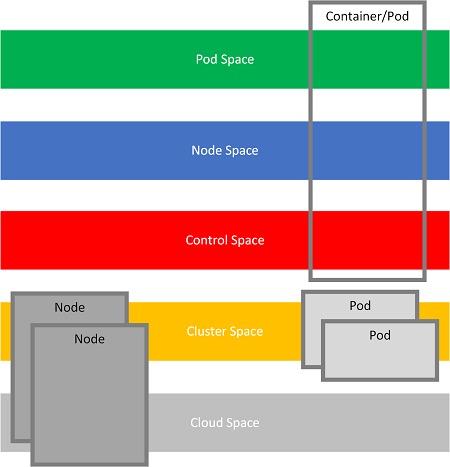
In the diagram above, nodes, containers, and pods have a different conceptual meaning instead of memory. They are more like spaces of relations between various objects/structures than spaces of objects/structures like memory spaces.
Now, having all these new abstract spaces, the next step is to consider this diagram where we replaced memory analysis patterns altogether with cloud analysis patterns:
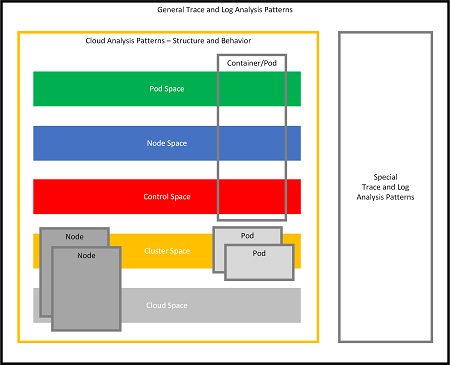
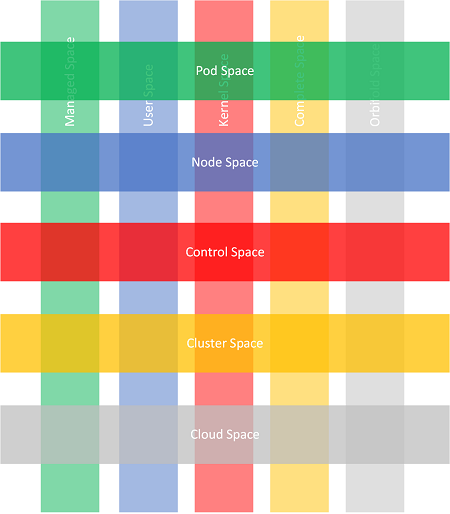
Memory analysis patterns are not gone but are at the lower level of abstraction, where individual spaces for cloud analysis patterns may require analysis of specific memory spaces if necessary. It is possible to represent both abstractions as Trace Quilt:
This description is preliminary and may have some modifications in the future. The corresponding analysis pattern language catalog is being developed now.
Encyclopedia of Software Diagnostic Analysis Patterns
Click on an individual book to see its description and table of contents:


This 1,600-page dense reference set includes:
- Encyclopedia of Crash Dump Analysis Patterns, Third Edition
- Trace, Log, Text, Narrative: An Analysis Pattern Reference for Data Mining, Diagnostics, Anomaly Detection, Fourth Edition
You can buy this reference set from Software Diagnostics Services with a discount.
Book: Principles of Memory Dump Analysis
The following direct links can be used to order the book now:
Buy Hardcover from Amazon
Buy Hardcover from Barnes & Noble
Buy Hardcover from Book Depository
Also available in PDF format from Software Diagnostics Services.
This is a collection of Software Diagnostics Services webinar transcripts about memory dump analysis methodology developed by Software Diagnostics Institute. Includes 6 seminars on physical memory dump analysis, cloud memory dump analysis, patterns, tools, processes and best practices for software trace and memory dump analysis, pattern-oriented software forensics, a pattern language for memory forensics, and mobile software diagnostics.
Now includes Fundamentals of Physical Memory Analysis: Anniversary Edition.
- Title: Principles of Memory Dump Analysis: The Collected Seminars
- Authors: Dmitry Vostokov, Software Diagnostics Services
- Publisher: OpenTask (September 2014)
- Language: English
- Product Dimensions: 28.0 x 21.6
- Hardback: 284 pages
- ISBN-13: 978-1906717667
Book: Software Diagnostics
The following direct links can be used to order the book now:
Buy Hardcover from Amazon
Buy Hardcover from Barnes & Noble
Buy Hardcover from Book Depository
Also available for sale in PDF format from Software Diagnostics Services.
This is a collection of Software Diagnostics Services webinar transcripts about pattern-oriented software diagnostics developed by Software Diagnostics Institute. Includes 9 seminars on pattern-driven software problem solving, software narratology, pattern-driven software diagnostics, systemic software diagnostics, pattern-based software diagnostics, philosophy of software diagnostics, victimware, malware narratives and pattern-oriented network trace analysis.
- Title: Software Diagnostics: The Collected Seminars
- Authors: Dmitry Vostokov, Software Diagnostics Services
- Publisher: OpenTask (September 2013)
- Language: English
- Product Dimensions: 28.0 x 21.6
- Hardback: 302 pages
- ISBN-13: 978-1908043641
Book: Accelerated Mac OS X Core Dump Analysis, Second Edition
The following direct links can be used to order the book now:
Buy iTunes version
Buy Kindle version
Buy Paperback from Amazon
Buy PDF + EPUB from Leanpub
Buy Paperback from Barnes & Noble
Buy Paperback from Book Depository
Available for SkillSoft Books24x7 subscribers
![]()
Also available for sale in PDF and EPUB formats from Software Diagnostics Services.
The full transcript of Software Diagnostics Services training with 12 step-by-step exercises. Learn how to analyse app crashes and freezes, navigate through process core memory dump space and diagnose corruption, memory leaks, CPU spikes, blocked threads, deadlocks, wait chains, and much more. We use a unique and innovative pattern-driven analysis approach to speed up the learning curve. The training consists of practical step-by-step exercises using GDB and LLDB debuggers highlighting more than 30 memory analysis patterns diagnosed in Intel x64 process core memory dumps. The training also includes source code of modelling applications written in Xcode environment, a catalogue of relevant patterns from Software Diagnostics Institute, and an overview of relevant similarities and differences between Windows and Mac OS X user space memory dump analysis useful for engineers with Wintel background. Audience: Software technical support and escalation engineers, system administrators, software developers, security professionals and quality assurance engineers.
- Title: Accelerated Mac OS X Core Dump Analysis, Second Edition: Training Course Transcript with GDB and LLDB Practice Exercises
- Authors: Dmitry Vostokov, Software Diagnostics Services
- Publisher: OpenTask (March 2014)
- Language: English
- Product Dimensions: 28.0 x 21.6
- Paperback: 406 pages
- ISBN-13: 978-1908043719
Book: Practical Foundations of Linux Debugging, Disassembling, Reversing
This training course is a Linux version of the previous Practical Foundations of Windows Debugging, Disassembly, Reversing book. It also complements Accelerated Linux Core Dump Analysis training course.
Although the book skeleton is the same as its Windows predecessor, the content was revised entirely because of a different operating system, debugger (GDB), toolchain (GCC, assembler, linker), application binary interface, and even an assembly language flavor, AT&T.
The course is useful for:
- Software technical support and escalation engineers, cloud security engineers, SRE, and DevSecOps
- Software engineers coming from JVM background
- Software testers
- Engineers coming from non-Linux environments, for example, Windows or Mac OS X
- Linux C/C++ software engineers without assembly language background
- Security researchers without assembly language background
- Beginners learning Linux software reverse engineering techniques
This book can also be used as an x64 assembly language and Linux debugging supplement for relevant undergraduate-level courses.
Product information:
- Title: Practical Foundations of Linux Debugging, Disassembling, Reversing: Training Course
- Authors: Dmitry Vostokov, Software Diagnostics Services
- Language: English
- Product Dimensions: 28.0 x 21.6
- PDF: 174 pages
- Publisher: OpenTask (January 2021)
- ISBN-13: 978-1-912636-34-1

Pattern-Oriented Software Diagnostics and Anomaly Detection Reference
Click on an individual book to see its description and table of contents:


Pattern-oriented software diagnostics, uniquely systematic and multidisciplinary, is the new approach in a long time. Described as the unified field theory of software diagnostics, It encompasses and expands the whole field, offers a wider range of software diagnostic possibilities, gives a novel lens to software diagnosis including specific guidelines for the dauntingly complex world of software problems. This 2,500-page reference set should be on the desk of every software engineer and software support problem solver. It includes:
- Encyclopedia of Crash Dump Analysis Patterns, Third Edition
- Trace, Log, Text, Narrative: An Analysis Pattern Reference for Data Mining, Diagnostics, Anomaly Detection, Fourth Edition
- Theoretical Software Diagnostics: Collected Articles, Third Edition
- Software Diagnostics: The Collected Seminars
- Fundamentals of Physical Memory Analysis: Anniversary Edition
- Principles of Memory Dump Analysis: The Collected Seminars
You can buy this reference set from Software Diagnostics Services with a discount.
General Architecture of Analysis Pattern Networks
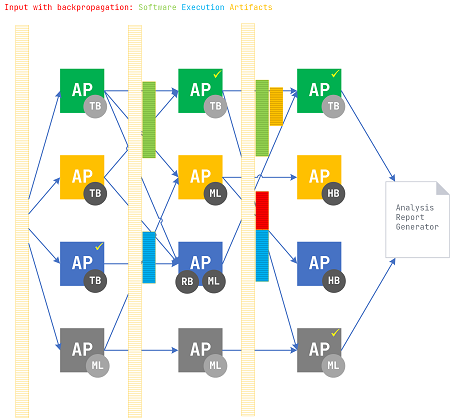
The system of diagnostic analysis patterns from Software Diagnostic Institute was created for humans and may appear too complicated for machines, although AI, machine learning, and data processing techniques may be used in individual computer-assisted pattern implementations. Fortunately, in theory, deep learning allows functional processing units of arbitrary complexity, and we can reuse its metaphors to propose a similar architecture but where all neurons in a layer perform different complex functions and use the same complex input. The output includes unmodified input plus the result of each neuron computation (enrichment). Some neurons may not produce any output given the set of data.
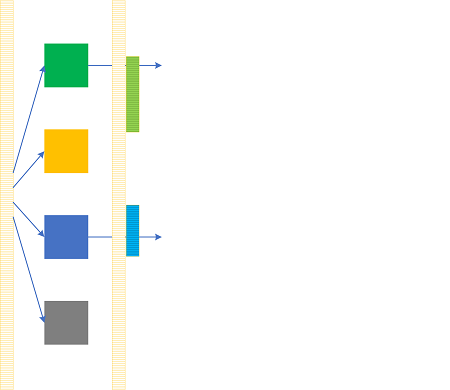
Concrete analysis patterns as techniques (algorithms) to uncover diagnostic indicators can be represented as generalized complex data processing “neurons” interconnected like artificial neural networks. Input data is a software execution artifact (or a set of them) such as a software trace and log, network trace, or memory snapshot. Each analysis pattern (AP) accesses the whole artifact data (no input neurons encoding data vector elements). Each AP processing enriches input data by adding another derivative artifact, artifact transformation, and the list of found diagnostic indicators (signs). Each AP from the next iteration processes the updated input data. Stateful AP may also store some other information for the next iterations (with or without data enrichment), and stateless AP may serve the role of pure transformation functions (operators). In summary, AP layers are identical but are fed with enriched artifacts for each iteration (backpropagation metaphor).
Links between AP from consecutive layers correspond to analysis and problem pattern sequences (schemas) known in advance (they may be the same between each consecutive pair of layers) and may also be built dynamically during iterations if correlations are discovered. Such links may also correspond to interfaces between AP components that query information from the previous iteration or ask for analysis services. The analysis report generator (“output neuron”) may use the link “weight” matrix of discovered AP dependencies for further insight. Flagged AP “neurons” in the diagram below represent found diagnostic indicators and concrete problem patterns to be used either in subsequent iterations or during analysis report generation. We call this method and its corresponding architecture Analysis Pattern Network (APN).
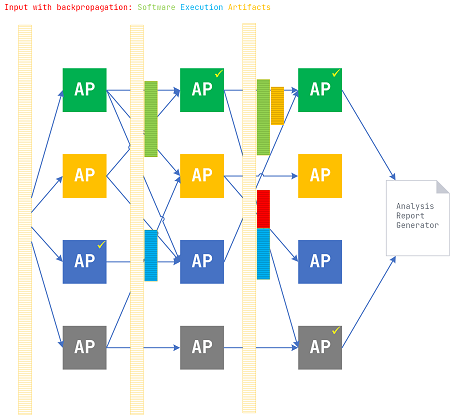
AP may be implemented using machine learning (ML), rule-based (RB), human-based (HB), and transformation-based (TB) techniques.
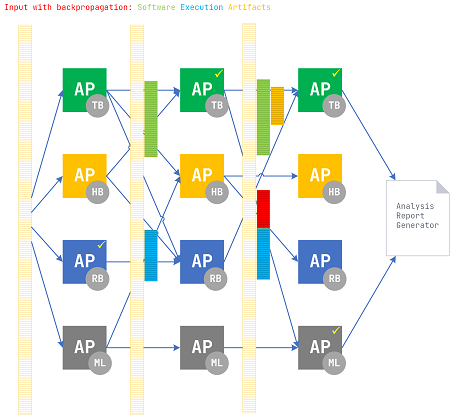
Different iterations may strategically use different implementation techniques based on pattern interconnections and enriched artifacts; for example, an AP during the first iteration used artifact transformation, during the second iteration used rule-based machine learning algorithm, and the third iteration required human introspection.
APN is an architectural pattern itself and is now added to our catalog of software diagnostics architecture patterns.
The Fractal Nature of Software Traces and Logs
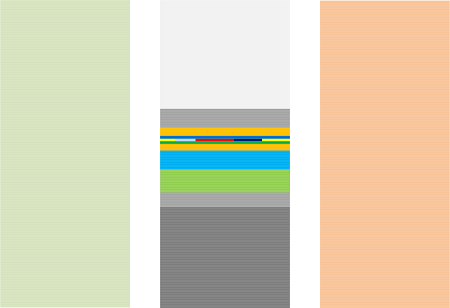
Self-similarity of Trace Shapes across sequences of trace runs, Activity Regions, trace messages, and parts of Multidimensional Messages with the later adding fractional dimensions suggests analogies with fractals.
Streaming Architecture of Pattern-Oriented Software Diagnostics Publications
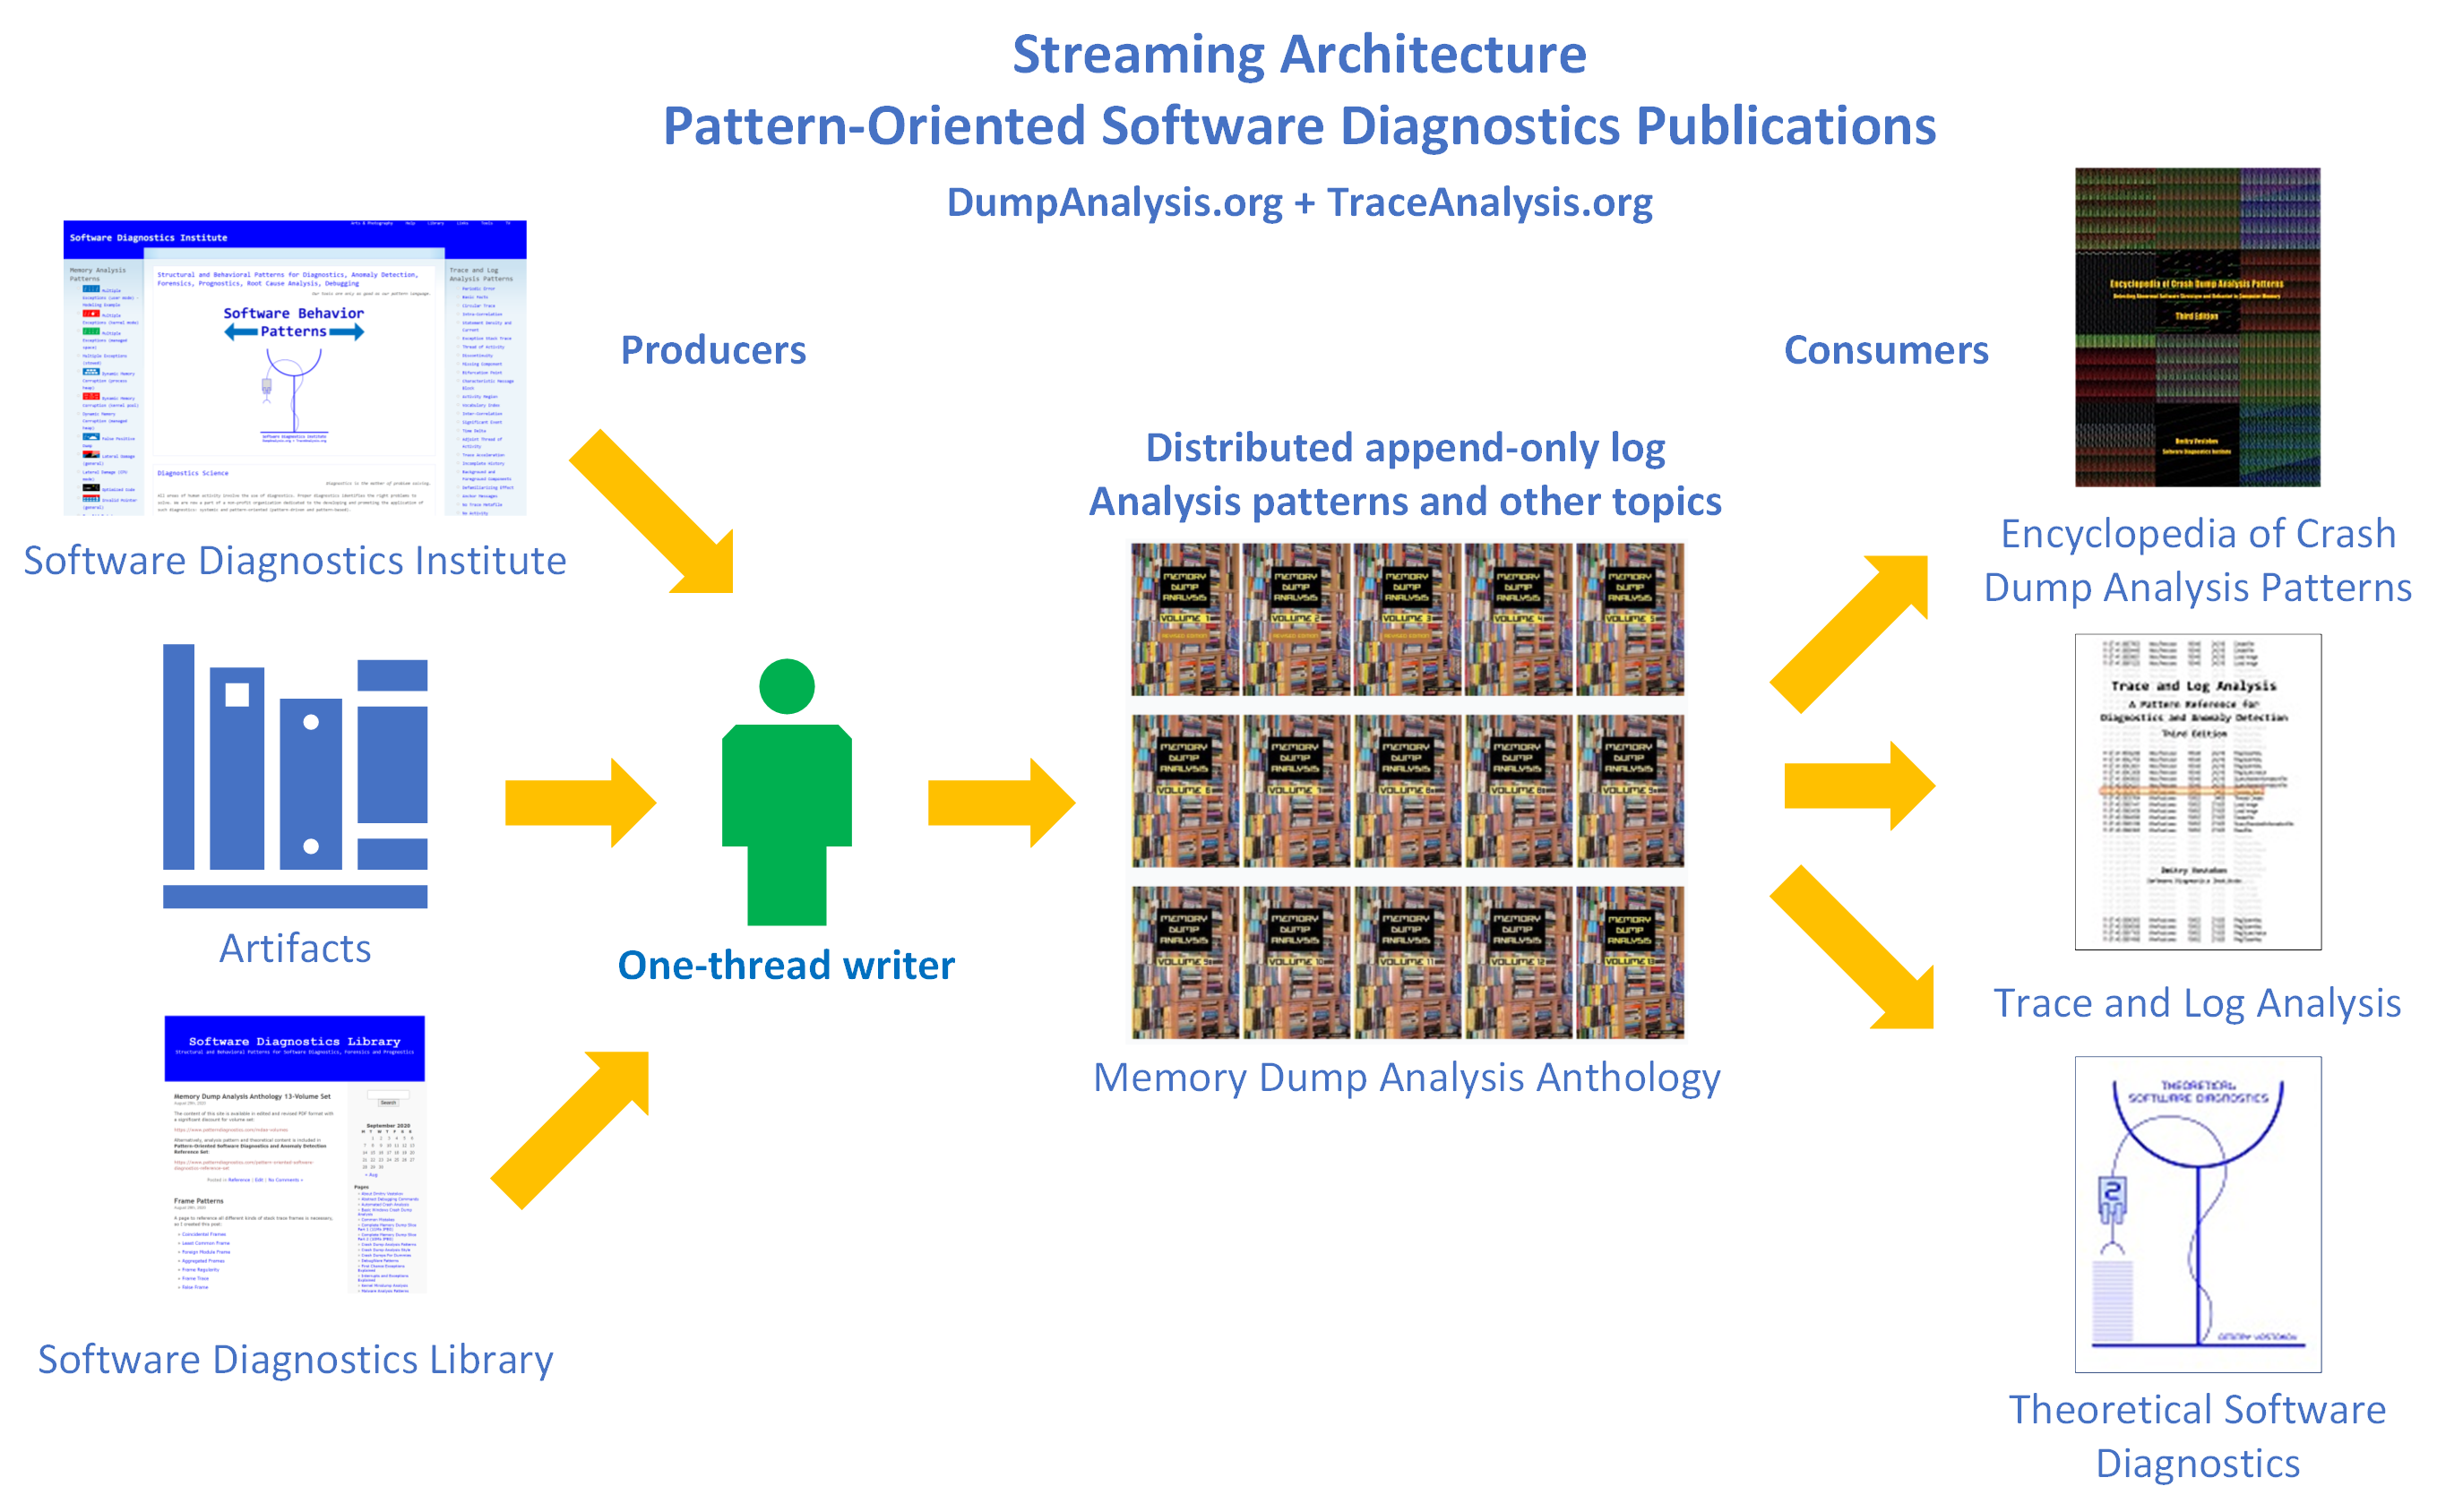
1. Producers: Software Diagnostics Institute, Library, and various artifacts from humans and software.
2. The one-thread writer to the distributed append-only log of analysis patterns and other topics: Memory Dump Analysis Anthology Volumes.
3. Consumers: Encyclopedia of Crash Dump Analysis Patterns, Trace and Log Analysis, Theoretical Software Diagnostics.
Mathematical Concepts in Software Diagnostics and Software Data Analysis
Various mathematical analogies and metaphors inspired memory and log analysis patterns and some concepts of software diagnostics and software data analysis. We list them in alphabetical order:
• 2-categories
• Adjoints, see also
• Braid groups
• Braids, see also
• Cartesian product
• Categories
• Causal sets, see also, and also
• Coalgebras, functors, 2-categories
• Cones
• Continuous and discontinuous functions
• Cover
• Critical points, Morse theory
• Curves
• Defect group of a block
• Derivatives, partial derivatives, see also
• Dessin d’enfant
• Dimension
• Direct sums and products of sets, see also
• Divergence
• Dual categories
• Duality
• Dynamical systems
• Edge contraction
• Equivalence relation
• Fiber bundles, see also
• Fibrations
• Fixed points
• Flag, filtration
• Foliation
• Fourier series
• Functor
• Fuzzy sets
• Galois connections
• Graphs
• Hasse diagrams
• Homotopy, see also
• Injections, surjections, bijections
• Intervals
• Jaccard index
• Lattices
• Manifolds, gluing
• Maps, see also
• Minimal surface
• Moduli space
• Monoids
• Motives, see also
• Motivic integration
• Nerve complex
• Open and closed sets
• Operads
• Orbifolds
• Order duality
• Ordinals
• Feynman path integral
• Phase
• Piecewise linear functions
• Poincaré map, Poincaré section
• Posets
• Powerset
• Presheaves
• Projective spaces
• Quotient groups
• Quotient space
• Retraction
• Riemann surfaces, multivalued functions
• Residue
• Rough sets
• Scalar field
• Semigroups
• Sheaves
• Significant digits
• Simplicial complex
• Step functions
• Structure Sheaf
• Surfaces
• Tensors
• Topology
• Ultrametric spaces, p-adic numbers
• Variadic functions
• Whiskering, also
The links to their definitions and examples can be found in the corresponding references. We give the original references to Memory Dump Analysis Anthology where possible, but most of them can also be found in Pattern-Oriented Software Diagnostics Reference books.
Memory Dump Analysis Anthology, Volume 13
Available in PDF format from Software Diagnostics Services
This reference volume consists of revised, edited, cross-referenced, and thematically organized selected articles from Software Diagnostics Institute (DumpAnalysis.org + TraceAnalysis.org) and Software Diagnostics Library (former Crash Dump Analysis blog, DumpAnalysis.org/blog) about software diagnostics, root cause analysis, debugging, crash and hang dump analysis, software trace and log analysis written in December 2019 - July 2020 for software engineers developing and maintaining products on Windows and Linux platforms, quality assurance engineers testing software, technical support, escalation and site reliability engineers dealing with complex software issues, security and vulnerability researchers, reverse engineers, malware and memory forensics analysts. This volume is fully cross-referenced with volumes 1 – 12 and features:
- 9 new crash dump analysis patterns with selected downloadable example memory dumps
- 15 new software trace and log analysis patterns
- Introduction to diagnostic analysis gestures
- Introduction to the category-theoretic view of debugging
- Lists of recommended category theory, number theory, and cybersecurity books
Product information:
- Title: Memory Dump Analysis Anthology, Volume 13
- Authors: Dmitry Vostokov, Software Diagnostics Institute
- Language: English
- Product Dimensions: 22.86 x 15.24
- Paperback: 197 pages
- Publisher: OpenTask (August 2020)
- ISBN-13: 978-1-912636-13-6
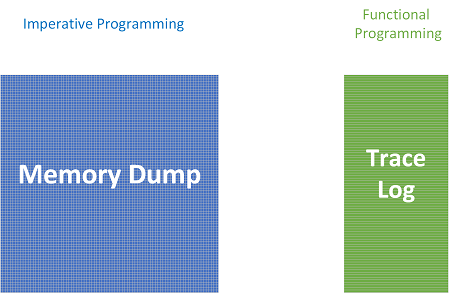
Programming Paradigms and Software Execution Artifacts
Sat, 08/08/2020 - 16:23 — Dmitry VostokovImperative vs. functional programming:
Memory Dump Analysis Anthology, Volume 3, Revised Edition
The new Revised Edition is available!
Available in PDF and EPUB formats from Software Diagnostics Services
This reference volume consists of revised, edited, cross-referenced, and thematically organized articles from Software Diagnostics Institute and Software Diagnostics Library (former Crash Dump Analysis blog) written in October 2008 - June 2009. In addition to various corrections, this major revision updates relevant links and removes obsolete references. Some articles are preserved for historical reasons. Most of the content, especially memory analysis and trace and log analysis pattern languages, is still relevant today and for the foreseeable future. The output of WinDbg commands is also remastered to include color highlighting. Crash dump analysis pattern names are also corrected to reflect the continued expansion of the catalog.
Compared to the second revised volume, the third revised volume features:
- 15 new crash dump analysis patterns
- 29 new pattern interaction case studies
- Trace analysis patterns
- Fully cross-referenced with Volume 1 and Volume 2
- New appendixes
The primary audience for Memory Dump Analysis Anthology reference volumes is: software engineers developing and maintaining products on Windows platforms, technical support, escalation, and site reliability engineers dealing with complex software issues, quality assurance engineers testing software on Windows platforms, security and vulnerability researchers, reverse engineers, malware and memory forensics analysts. Trace and log analysis articles may be of interest to users of other platforms.
- Title: Memory Dump Analysis Anthology, Volume 3, Revised Edition
- Authors: Dmitry Vostokov, Software Diagnostics Institute
- Publisher: OpenTask (July 2020)
- Language: English
- Product Dimensions: 22.86 x 15.24
- PDF + EPUB: 394 pages
- ISBN-13: 978-1912636235


Introducing Diags: Diagnostic Analysis Gestures and Logues

First, we introduce some definitions:
A diagnostic analysis action is a user interface action, a command, a technique, a diagnostic algorithm, a diagnostic analysis pattern.
A space of tools is a collection of physical and virtual (mental, imaginary) tools at some physical or virtual (mathematical) distance from each other.
A configuration of diagnostic analysis actions is a directed graph (digraph) in a topological space of tools or a diagram in a category theory sense (Visual Category Theory Brick by Brick, Part 3).
A diagnostic analysis gesture (diag) is a configuration of diagnostic actions across the space of tools and time, resulting in a workflow of diagnostic analysis actions.
A diagnostic analysis hypergesture is a gesture of diagnostic analysis gestures, a transformation of one gesture into another, between sets of tools, similar to porting diagnostic analysis patterns from one platform to another, for example, from Windows to Linux, or from one domain to another, for example, from logs to texts. We can view diagnostic hypergestures as diagnostic gesture patterns.
The “gesture” metaphor stems from the fact that despite recent automation efforts, the diagnostic analysis process is still manual when it requires substantial domain expertise. We still use various tools, graphical and command line (hand movements), and move in cyberspace. So, it is natural to combine all these physical and virtual movements into some abstract space path. There’s also a question of diagnostic performance (in terms of achieving diagnostic goals) and repertoire. Diagnostic gestures also include tool improvisation, data exploration, action experimentation, and aesthetics as well (coolness, for example). Some gestures can be used to discover analysis patterns.
Different mathematical approaches can be used to formalize Diags and HyperDiags; for example, category theory like it was done for musical gestures and homotopy theory for hypergestures (see The Topos of Music III: Gestures: Musical Multiverse Ontologies, Second Edition). For various perspectives on general gestures, please also refer to the opening chapters of The Topos of Music III.
Initially, years ago, we proposed thinking of diagnostic tools as arrows in a category of troubleshooting where objects are diagnostic artifact states (Category Theory and Troubleshooting, Theoretical Software Diagnostics, Second Edition, p. 105). Diags approach considers tools as objects.
Second, diagnostic gestures (and gestures in general) may be described using narrative forms, and we propose some new terminology here.
A logue is a narrative of diagnostic actions which that can be viewed as a langue from theoretical linguistics. It is similar to logs in their structure and allows the application of the whole apparatus of software narratology and trace analysis patterns similar to higher-order pattern narratives.
The idea stems from viewing catalogs of analysis patterns as cat-a-logs, a category of logs (and other categories of diagnostic artifacts and their analysis patterns in general), and the difference in catalog and catalogue spellings.
Finally, we also have dia-logs (dia-logues), dialogic actions between diagnostic analysis actors and logs (logues).
Fundamentals of Physical Memory Analysis
New Anniversary Edition is now available.
The following direct links can be used to order the book now:
Buy Kindle Print Replica from Amazon
Buy PDF and EPUB from Leanpub
The previous edition is also available for SkillSoft Books24x7 subscribers
![]()
This short book is a full transcript of the Software Diagnostics Services seminar about physical memory analysis on desktop and server Windows platforms (a revised version of the previous seminars on complete crash and hang memory dump analysis). Topics include memory acquisition and its tricks, user vs. kernel vs. physical memory space, fiber bundle space, challenges of physical memory analysis, common WinDbg commands, memory analysis patterns and their classification, common mistakes, a hands-on WinDbg analysis example with logs, and a guide to further study. For this new edition, slides and their transcript text have been significantly revised, links and references have been checked and updated, and the whole WinDbg analysis session has been redone for Windows 10.
- Title: Fundamentals of Physical Memory Analysis: Anniversary Edition
- Author: Dmitry Vostokov, Software Diagnostics Services
- Publisher: OpenTask (June 2020)
- Language: English
- Product Dimensions: 28.0 x 21.6
- Paperback: 58 pages
- ISBN-13: 978-1912636808
Memory Dump Analysis Anthology, Volume 2, Revised Edition
The new Revised Edition is available!
The following direct links can be used to order the English edition now:
Buy PDF and EPUB from Leanpub
Buy Kindle Print Replica from Amazon
Also available in PDF and EPUB formats from Software Diagnostics Services.
This reference volume consists of revised, edited, cross-referenced, and thematically organized articles from Software Diagnostics Institute and Software Diagnostics Library (former Crash Dump Analysis blog) written in January - September 2008. In addition to various corrections, this major revision updates relevant links and removes obsolete references. Some articles are preserved for historical reasons. Most of the content, especially memory analysis pattern language, is still relevant today and for the foreseeable future. The output of WinDbg commands is also remastered to include color highlighting. Crash dump analysis pattern names are also corrected to reflect the continued expansion of the catalog.
Compared to the first revised volume, the second revised volume features:
- 44 more crash dump analysis patterns
- Pattern interaction and case studies
- Fully cross-referenced with Volume 1
- New appendixes
The primary audience for Memory Dump Analysis Anthology reference volumes is: software engineers developing and maintaining products on Windows platforms, technical support, escalation, and site reliability engineers dealing with complex software issues, quality assurance engineers testing software on Windows platforms, security and vulnerability researchers, reverse engineers, malware and memory forensics analysts.
- Title: Memory Dump Analysis Anthology, Volume 2, Revised Edition
- Authors: Dmitry Vostokov, Software Diagnostics Institute
- Publisher: OpenTask (May 2020)
- Language: English
- Product Dimensions: 22.86 x 15.24
- PDF: 463 pages
- ISBN-13: 978-1912636228


Debugging and Category Theory
What is debugging? There are many definitions out there, including analogies with forensic science, victimology, and criminology. There are also definitions involving set theory. They focus on the content of debugging artifacts such as source code and its execution paths and values. We give a different definition based on debugging actions and using category theory. We also do not use mathematical notation in what follows.
What is the category theory? We do not give a precise mathematical definition based on axioms but provide a conceptual one as a worldview while omitting many details. A category is a collection of objects and associated arrows between them. Every pair of objects has a collection of arrows between them, which can be empty. So an arrow must have a source and a target object. Several sequential arrows can be composed into one arrow. We can even consider arrows as objects themselves, but this is another category with its new arrows between arrows as objects. If we consider categories as objects and arrows between these categories as objects, we have another category. So we can quickly build complex models out of that.
Can we build a conceptual model of debugging using objects and arrows? Yes, and it even has a particular name in category theory: a presheaf. So, debugging is a presheaf. To answer a question, what is a presheaf, we start constructing our debugging model focusing on objects and arrows. To avoid using mathematical language that may obscure debugging concepts, we use LEGO® bricks because we can feel the objects and arrows, and most importantly, arrows as objects (see visual category theory for more details). This hands-on activity also reminds us that debugging is a construction process.
Debugging activity involves time. We, therefore, construct a time arrow that represents software execution:

We pick two Time objects representing different execution times:

In our Time category, an arrow means the flow of time. It can also be some indexing scheme for time events or other objects (a different category) that represents some repeated activity. Please note that an arrow has specific object indicators assigned to it. Different object pairs have different arrows. It is not apparent when we use black and white mathematical notation and diagrams.

We can associate with Time objects some external objects, for example, memory snapshots, or some other software execution states, variables, execution artifacts, or even parts of the same artifact:

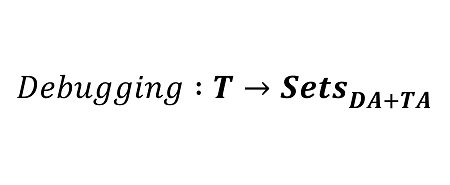
Therefore, we have a possible mapping from the Time category to a possible category of software execution artifacts that we name DA+TA (abbreviated [memory] dump artifacts + trace [log] artifacts). DA+TA objects are simply some sets useful for debugging. The mapping between different categories is usually called a functor in category theory. It maps objects from the source category to objects in the target category. It is itself an arrow in the category that includes source and target categories as objects:

However, we forgot to designate arrows in the target DA+TA category. Of course, a different choice of arrows makes different categories. We choose arrows that represent debugging activities such as going back in time when trying to find the root cause, such as walking a stack trace. It is a reverse activity:

A functor that maps arrows to reversed arrows is called a contravariant functor in category theory:

Such a contravariant functor from a category to the category of some sets is called a presheaf. Now we look at debugging using software traces and logs as another target category of sets. With our Time category objects, we associate different log messages:

When we use log and trace files for debugging we also go back in time trying to find the root cause message (or a set of messages) or some other clues:

Again, we have a presheaf, a contravariant functor that maps our Time category objects to sets of messages:

So, we see again, that debugging is a presheaf, a contravariant functor that maps software execution categories such as a category of time instants to sets of software execution artifacts.
Trace and log analysis pattern catalog includes another example of the source and target categories candidates for a debugging presheaf, Trace Presheaf analysis pattern that maps trace messages to memory snapshots (sets of memory cells or some other state information).
Presheaves can be mapped to each other, for example, from a presheaf of logs to a presheaf of associated source code fragments or stack traces, and this is called a natural transformation in category theory. It also fits with natural debugging when we go back in logs and, at the same time, browse source code or some other associated information sets.
This article is also available in PDF format.
Software Construction Brick by Brick
In the past, we used LEGO® bricks to represent some simple data structures and software logs, and recently, more complex data structures and algorithms, so all that transformed into a series of manageable short books (increments) to facilitate earlier adoption and feedback. Software diagnostics is an integral part of software construction and software post-construction problem-solving, and we aim to provide real hands-on training from general concepts and architecture to low-level details.
Increment 1 (ISBN-13: 978-1912636709) is currently available on Leanpub and Amazon Kindle Store. It covers memory, memory addresses, pointers, program loading, kernel and user spaces, virtual process space, memory isolation, virtual and physical memory, memory paging, memory dump types.